PROCEEDINGS of the Fifth International Driving Symposium on Human Factors in Driver Assessment, Training and Vehicle Design
PREDICTING OLDER DRIVERS’ DIFFICULTIES USING THE ROADWISE REVIEW Charles Scialfa, Jennifer Ference, Jessica Boone, Richard Tay & Carl Hudson University of Calgary Calgary, Alberta, Canada Email:
[email protected] Summary: There has been a substantial growth in research attempting to predict accidents and performance in older drivers. The Roadwise Review and the substantively identical Driver Health Inventory have been reported to provide a valid and cost-effective means of assessing crash risk in older communitydwelling adults. We administered the DHI to a community-dwelling sample of older (45 - 85 years) drivers. We also asked them to report on the difficulties they experienced while driving and on the frequency and type of crashes and moving violations the experienced in the previous two years. Results indicated on several of the tests there are substantial floor or ceiling effects, as well as barriers to usability and acceptance. Low inter-test correlations are consistent with the notion that different capacities are being indexed with the DHI. However, generally there were only low correlations between DHI performance and self-reported difficulties in driving, accidents or moving violations. While the DHI and Roadwise Review may well be valuable in providing older drivers with information on skills related to driving performance, in its current form it does not appear to be a useful tool in licensure or the prediction of driver risk. INTRODUCTION When adjusted for distance traveled, (i.e., by equating for distance driven) there is an increase in accident risk that begins around 50 years of age and grows linearly in older groups. While recent data challenges the conclusion that older drivers are unsafe (e.g. Hakamies-Blomqvist, Raitenen & O’Neill, 2002), their greater risk of death and burgeoning numbers have motivated a growing interest in issues of licensure and driver assessment (Grabrowski et al, 2004; Morrisey & Grabrowski, 2005; Tay, 2006, 2008). Further, because large-scale on-road assessments and highfidelity simulations are not currently cost-effective, research efforts have concentrated on using “off the shelf” tests that can be administered quickly and with minimal training. There have been some notable successes in this effort. Owsley, et al. (1998) evaluated visual and cognitive predictors of retrospective accident involvement in licensed drivers aged 57-83 yrs. Correlations between convictions or accidents and a mental status test or the Useful Field of View test (UFOV) were substantial. Janke and Eberhard (1998) reported that several measures of spatial vision and divided attention could predict on-road performance in a sample of medically or cognitively impaired elders. A small battery of cognitive tests including measures of shortterm memory and divided attention predicted accidents retrospectively in a sample of older North Carolina drivers (Stutts, Stewart & Martell, 1998) and Wood (2002) reported that a combination of spatial vision and cognitive measures accounted for 50% of the variance in the on-road performance of a life-span sample of drivers.
214
PROCEEDINGS of the Fifth International Driving Symposium on Human Factors in Driver Assessment, Training and Vehicle Design
Of particular relevance to the present research, Staplin, Lococo, Gish & Decina (2003) carried out a large-scale study of older U.S. drivers to determine the predictive validity of a battery of tests including measures of high-contrast and low-contrast visual acuity, divided attention, working memory, the UFOV, walking speed and head/neck flexibility. Most of the measures were able to discriminate crash-involved and crash-uninvolved older drivers. The Driving Health Inventory was developed largely on the basis of this study. With funding from the American Automobile Association and the Canadian Automobile Association, it is currently being distributed for self-assessment under the name of Roadwise Review. The Roadwise Review/DHI consists of 8 tests assessing spatial vision, the UFOV, divided attention, the ability to identify objects from incomplete information, working memory, walking speed and flexibility of the head and neck. Performance feedback indicating level of impairment (none, mild or serious impairment) is provided for each test and people are advised on a testspecific basis about what they might do to reduce their risk of accidents. Although Staplin, et al. (2003) have done a remarkable job of evaluating driver screening tools in older adults, there has not been an independent evaluation of the ability to predict driving difficulty using the DHI. The objective of the study is to administer the DHI to a sample of older drivers in the province of Alberta to assess its psychometric properties and to determine its ability to predict self-reported driving challenges and accidents. METHOD Subjects To date, we have assessed more than 70 adults between the ages of 45 and 85 yrs. Participants were recruited from seniors’ organizations in the Calgary area. They were all licensed drivers who currently drove. On average, they drove approximately 14, 000 km per year, but this was quite variable. The sample was predominantly female and relatively well educated (M = 13.8 yrs). As compensation for their involvement, participants either received $20 CDN or had that amount donated to their parent organization. This research was approved by the Conjoint Faculties Research Ethics Board of the University of Calgary. Materials The DHI consists of 8 tests administered in the following fixed order. -
High-contrast acuity (20/80). The number of errors out of four trials on a “Lazy E” chart with critical detail corresponding to 20/80 distance vision. Test distance was 10 ft and the optotypes were black stimuli on a white background. High-contrast acuity (20/40). Identical to the previous test with critical detail corresponding to 20/40 distance vision. Low-contrast acuity (20/80). Identical to the high-contrast test, but optotypes were printed in intermediate grey, reducing luminance contrast.
215
PROCEEDINGS of the Fifth International Driving Symposium on Human Factors in Driver Assessment, Training and Vehicle Design
-
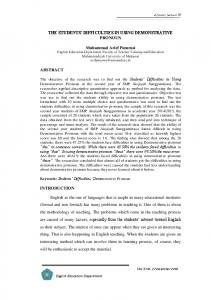
Low-contrast acuity (20/40). Identical to the low-contrast test, but optoptype critical detail corresponded to 20/40 distance vision. Walking speed. The time taken to walk 20 ft as quickly as possible. Head-neck flexibility. A range of motion test in which the participant had to identify an object 10 ft directly behind them while seated, without moving their body. Working Memory. The number of errors in recalling a list of three words, after a brief intervening task. Visualizing Missing Information. Identifying which of several objects match a target but for a missing part or parts. Scored as 0-11 incorrect. UFOV. The shortest duration when both a central target could be discriminated and a peripheral target localized with 75% accuracy. Visual Search A. Commonly called Trails A, the test requires people to connect a series of encircled numerals in ascending order. The score is time to completion. Visual Search B. Commonly called Trails B, the test requires people to connect a series of encircled numerals and letters in ascending order (e.g., 1-A-2-B-3-C). The score is time to completion. Driver Behaviour Questionnaire (Reason et al, 1990). A 45-item, Likert-scale questionnaire assessing difficulties experienced with various driving tasks (e.g., left turns). The Mini-Mental Status Exam (Folstein, et al, 1975). A global indicator of cognitive status, with a maximum score of 30. Lower scores indicate more impairment.
Figure 1. Examples of UFOV Test
RESULTS AND DISCUSSION Test Distributional Properties Between the two physical measures, walking speed performed best. Scores were normally distributed with a mean of approximately 5.3 seconds (SD = 1.3 sec), in agreement with the Staplin, et al. (2003) data. However, almost one-half of the participants failed the head and neck flexibility test, in contrast to a failure rate of approximately 20% for the residential and license renewal samples in Staplin, et al. This may be problematic from the standpoint of user
216
PROCEEDINGS of the Fifth International Driving Symposium on Human Factors in Driver Assessment, Training and Vehicle Design
acceptance, but is the test difficulty level at which discriminability is at maximum (See Hopkins, 1998). Three of the four acuity tests (which were not included in Staplin, et al.’s data), showed pronounced ceiling effects. The percentage of participants who made no errors ranged from 82% to 87%. Given that licensure requires 20/40 corrected distance vision in Alberta and many other jurisdictions, this should not be surprising and is, in that sense, an indication of test validity. However, the restricted range of scores will diminish correlations between these tests and any measure of driving performance. As would be expected (Scialfa, Kline & Wood, 2002), there is more variability in performance on the low-contrast test of acuity, but still, 77% of the participants had no errors. On the working memory test, 70% of the sample participants made no errors, somewhat higher than the 60% error-free percentage in Staplin, et al. Still, there appears to be adequate variability in scores to include the measure in any predictive efforts. Broadly consistent with the Maryland study, scores on the Visualizing Missing Information test were positively skewed, with approximately 60% of respondents making 2 or fewer errors. Trails A and B completion times were both normally distributed with means of 45.49 sec and 106.51 sec, respectively. Only Trails B was administered in the Maryland study and the sample mode of 100 sec is broadly consistent with our data.
Figure 2. UFOV
The UFOV data exhibited a marked departure from normality (p = .002) and, as can be seen in the histogram below, are positively skewed. Almost one-half of the participants were able to achieve 75% accuracy at the minimum duration of 100 ms.
217
PROCEEDINGS of the Fifth International Driving Symposium on Human Factors in Driver Assessment, Training and Vehicle Design
Correlational Analysis As can be seen in the following table, zero-order correlations between predictors and either DBQ total scores or accident involvement were generally quite low. In many cases, these correlations are opposite in sign to expectation, but this is probably only sampling variability around a true value of zero. Table 1. Zero-order correlations between predictors and indicators of driving performance Predictor Variable
DBQ Total Score
Accident (Yes or No)
Walking speed
-.07
-.18
Head-neck flexibility
.15
-.06
High-contrast acuity (20/80)
-.16
.02
High-contrast acuity (20/40)
.18
-.04
Low-contrast acuity (20/80)
.08
.02
Low-contrast acuity (20/40)
-.01
-.06
Visualizing Missing Information
.03
-.10
Visual Search A
-.25
-.06
Visual Search B
.30
.05
Working Memory
-.11
-.04
UFOV
-.01
.14
MMSE
-.33
.10
Predicting Driving Difficulty We first built a model predicting total DBQ scores from a combination of all tests in the Driving Health Inventory. This model was non-significant, F(11, 26) = 1.25, p = .302) with an R-squared of .35. Adding MMSE scores to the model produced an improvement in the model fit, in that the R-squared rose to .41 but it was still non-significant, F(12,25) = 1.48, p = .20. Using a forward selection procedure, the best one-variable model included MMSE alone (p = .043), while the best two-variable model included MMSE and Visual Search A (p = .02). Discriminant analysis and logistic regression were used in an effort to predict accident involvement and moving violations, but no model including any DHI predictors was successful. CONCLUSIONS There is a pressing need to develop assessment tools to evaluate older driver safety. While the DHI represents a significant and laudable effort, the present results suggest that it is in need of revision before it can be assessed for widespread use. Distributional properties of many of the tests limit predictive validity and may work against user acceptance. Low correlations with selfreported driving difficulty and retrospective accidents suggest poor reliability, validity or both. In this sample, a relatively inexpensive and brief assessment of cognitive function – the MMSE – was more successful at predicting driver difficulty than the DHI tests individually or collectively.
218
PROCEEDINGS of the Fifth International Driving Symposium on Human Factors in Driver Assessment, Training and Vehicle Design
There are several limitations to the present study to be addressed in future work. First, given the rarity of accidents, predictive success may grow with increasing sample size. Perhaps more importantly, our sample consisted of self-selected elders who were currently driving. It would be beneficial to collect data on older drivers who have recently given up driving or who have been referred for medical examinations, as was done in Staplin, et al (2003). Finally, because accident statistics are problematic, it would be useful to determine if the DHI is able to predict driving performance, either through on-road tests or simulations. ACKNOWLEDGEMENTS This research was funded by a grant to Richard Tay from the Alberta Motor Association. REFERENCES Folstein, M.F., Folstein, S.E., & McHugh, P.P. (1975). Mini-Mental State: A practical method for grading the cognitive stat of patients for the clinician. Journal of Psychiatric Research, 12, 189-198. Grabowski, D., Campbell, C. & Morrisey, M. 2004. Elderly licensure laws and motor vehicle fatalities, Journal of the American Medical Association, 291(23), 2840-2846. Hakamies-Blomqvist, L., Raitanen, T., O’Neill, D., 2002. Driver ageing does not cause higher accidents per km. Transportation Research. Part F: Traffic Psychology and Behavior, 15, 271–274. Hopkins, K. (1998). Educational and psychological measurement and evaluation (2nd ed.). Boston: Allyn & Bacon. Janke, M., & Eberhard, J. (1998). Assessing medically impaired older drivers in a licensing agency setting. Accident Analysis and Prevention, 30, 347-361. Morrisey, M. & Grabowski, D. 2005. State motor vehicle laws and older drivers, Health Economics, 14, 407-419. Owsley, C. Ball, K., McGwin, G., Sloane, M. E., Roenker, D. L., White, M. F., et al. (1998). Visual processing impairment and risk of motor vehicle crash among older adults. Journal of the American Medical Association, 279, 1083-1088. Reason, J.T., Manstead, A.S.R., Stradling, S., Baxter, J., Campbell, K., 1990. Errors and violations on the roads. Ergonomics, 33, 1315–1332. Scialfa, C., Kline, D., & Wood, P. (2002). Structural modeling of contrast sensitivity in adulthood. Journal of the Optical Society of America A, 19, 158-165. Staplin, L., Lococo,K., Gish, K., & Decina, L. (2003). Model driver screening and evaluation program final technical report volume 2: Maryland pilot older driver. Final Technical Report, DOTHS809581, National Highway Traffic Safety Administration. Stutts, J., Stewart, J., & Martell, C. (1998). Cognitive test performance and crash risk in an older driver population. Accident Analysis and Prevention, 30, 337-346. Tay, R. (2008). Marginal Effects of Increasing Ageing Driver on Injury Crashes, Accident Analysis and Prevention, 40, 2065-2068 219
PROCEEDINGS of the Fifth International Driving Symposium on Human Factors in Driver Assessment, Training and Vehicle Design
Tay, R. (2006). Ageing Driver: Storm in a Teacup? Accident Analysis and Prevention, 38(1), 112-121 Wood, J. (2002). Age and visual impairment decrease driving performance as measured on a closed-road circuit. Human Factors, 44, 482-494.
220