Marine Resource Economics , Volume 20, pp. 25–45 Printed in the U.S.A. All rights reserved
0738-1360/00 $3.00 + .00 Copyright © 2005 Marine Resources Foundation
Predicting Optimal Targeting Strategies in Multispecies Fisheries: A Portfolio Approach LARRY PERRUSO National Marine Fisheries Service RICHARD N. WELDON SHERRY L. LARKIN University of Florida Abstract When regulations are species specific but the species are part of a multispecies fishery, studies show that harvest rates are correlated such that net revenues attributed to each species are also correlated. This correlation suggests that portfolio theory is well suited for multispecies fisheries that exhibit joint productive characteristics. This paper uses a portfolio approach to model the behavior of fishermen faced with multiple targeting options in a randomharvest fishery. The approach draws from the expected utility hypothesis and financial portfolio theory to predict optimal targeting strategies. The methodology is applied to the pelagic longline fleet operating in the U.S. Atlantic Ocean, Caribbean, and Gulf of Mexico. The model provides evidence that area closures aimed at reducing juvenile swordfish mortality will be more effective in certain regions. Efficient risk-return frontiers are also generated for use in predicting targeting behavior in lieu of a closure. Key words Fisheries economics, fisheries management, highly migratory species, multispecies fisheries, portfolio theory, swordfish, targeting strategies. JEL Classification Codes Q22, G11, D81, C61.
Introduction In recent years the impact of risk in commercial fisheries has become more apparent. Biological studies have used risk assessment to determine the best long- and short-term management strategies under stock risk (Mendelssohn 1979; Francis 1992). Andersen (1982) was one of the first studies to incorporate risk into an applied economic model of commercial fisheries. The work introduced price risk and risk-averse producer behavior into a standard bioeconomic model for a single stock fishery. Bockstael and Opaluch (1983) developed a discrete choice model of supply
Larry Perruso is an industry economist at the National Marine Fisheries Service, Southeast Fisheries Science Center, 75 Virginia Beach Drive, Miami, FL 33149, email:
[email protected]. Richard N. Weldon is an associate professor and Sherry L. Larkin is an assistant professor in the Food and Resource Economics Department, Box 110240, Gainesville, FL 32611-0240, email:
[email protected] and
[email protected], respectively. We wish to thank an associate editor for constructive comments on an earlier draft. This research was supported by the Florida Agricultural Experiment Station and approved for publication as Journal Series No. R-09677. The research was conducted while Larry Perruso was a Ph.D. candidate at the University of Florida. Neither the analysis nor the policy observations presented herein represent the official position of the National Marine Fisheries Service.
25
26
Perruso, Weldon, and Larkin
response under uncertainty and applied it to location choice problems of New England fishing firms. This article, in particular, has provided a theoretical framework based on the random utility model for numerous studies about fisherman behavior and spatial decision-making in commercial fisheries (e.g., Dupont 1993; Ward and Sutinen 1994; Holland and Sutinen 1999; Larson, Sutton, and Terry 1999). Recent studies continue to focus on location choice as a critical aspect of the vessel operator’s decision-making process (e.g., Holland et al. 2004; Curtis and Hicks 2000; Holland and Sutinen 2000; Smith 2000; Mistiaen and Strand 2000; Smith and Wilen 2003). The considerable interest in spatial research implies that information about a fisherman’s targeting strategy has significance to commercial fishery managers attempting to recover dissipated rents from exploited fisheries. For inherently stochastic multispecies fisheries in particular, targeting strategies are made ex ante (before knowledge of realized, or ex post, returns) and, thus, directly incorporate expected spatial rent differentials. By analyzing optimal targeting strategies, researchers can gain insight into correlated spatial decisions as well as industry reactions to environmental regulations under output uncertainty. For example, when species-specific protection laws are enacted in multispecies fisheries, knowledge of rent-maximizing or risk-minimizing harvest portfolios can be used to predict the redirection and extent of fishing effort toward other species or fisheries. Another recent trend in the fisheries literature exploits neoclassical production theory to explain the joint harvest technology of multispecies fleets (Jensen 2002). Dual models are useful for explaining input factor demand, output supply, factor substitution, optimal fleet structure, and sources of rent dissipation. However, if harvests are stochastic, traditional least squares estimation of dual profit or cost systems leads to biased and inconsistent parameter estimates (Pope and Just 1996). Consequently, ignoring the unpredictable nature of outputs can lead to misguided policy decisions. When regulations are species-specific, but the species is part of a multispecies fishery, studies show that harvest rates are linked across species (Kirkley and Strand 1988; Squires and Kirkley 1995); consequently, net revenues attributed to each harvested species are also interrelated. Interdependence among multiproduct returns suggests that portfolio theory is well suited for use in multispecies fisheries that exhibit joint productive characteristics, such as those targeted by longline vessels. Studies of risk management through portfolio diversification in commercial fisheries have been limited. Baldursson and Magnusson (1997) use portfolio theory to determine the optimal fishing pattern in a single-species multicohort fishery modeling age cohorts as separate assets. Under the assumption of risk aversion they show that historical fishing effort in the Icelandic cod fishery is inefficient in terms of both profits and variance of returns. Lauck et al. (1998) investigate the use of portfolio theory as a tool for fishery managers by proposing the use of marine protected areas as a management diversification tool. Hilborn et al. (2001) argue that a diversified harvest portfolio is consistent with the implementation of the precautionary approach in fisheries management and possibly could prevent total closures due to stock depletions. Lastly, Sanchirico and Smith (2003) apply portfolio theory to investigate historical exploitation patterns for ten species categories in the Northwest Atlantic from 1950-2001 and hypothesize a reduced-form modeling procedure that utilizes trophic-level catch correlations to examine aggregate ecosystem efficiency. Efficient mean-variance frontiers are derived based on sustainability concepts with actual catch data plotted over different time intervals relative to the sustainability frontiers. This paper introduces an empirical model to the commercial fisheries literature that derives optimal supply decisions (i.e. , species targeting strategies) under production risk, thus providing managers with important information on firm behavior that is also correlated with spatial decision making. Specifically, this paper proposes a static trip-level model that uses mean-variance or portfolio theory as outlined by
Portfolio Approach to Predicting Targeting Strategies
27
Markowitz (1959) to estimate optimal species targeting decisions for risk-averse fishermen in a multispecies fishery under output uncertainty. The approach builds on the current commercial fisheries literature by proposing a tractable technique that allows researchers, regulators, and fishermen to use historical cost and revenue data to derive future optimal targeting strategies based on a risk-return tradeoff. A goal of this research is to provide a link between risky ex ante production and a priori targeting and spatial decision-making in random-harvest multispecies fisheries. The methodology is applied to the pelagic longline (PLL) fleet operating in the U.S. Atlantic Ocean, Caribbean, and Gulf of Mexico. Due to the indiscriminate nature of longline gear, recent studies categorize this fleet as facing unpredictable harvest levels of any one species (Strand 2004; Perruso 2003; Mistiaen and Strand 2000). Thus, dual methods cannot consistently predict optimal harvest levels for this fleet. However, we assume longliners do make targeting and technological decisions based on expectations of output and net revenues. A major factor in this decision-making is historical returns.1 The portfolio approach explicitly uses information on the first two moments of past net revenues, which proxy for expected net returns, to derive optimal ex ante harvest strategies (portfolios) for the fleet. Since ex post net revenue figures for individual trips are available for this fleet (Larkin, Adams, and Lee 2000), Atlantic and Gulf longliners provide an opportunity to implement this methodology. The main objective of this paper is to develop an alternative behavioral modeling approach for multispecies vessels that incorporates the harvest risk of each species into targeting decisions. 2 Optimal targeting portfolios are generated for a representative PLL vessel at the trip level. Portfolios are generated under several scenarios designed to capture the effects of strategic targeting decisions and exogenous regulatory mandates. The former is addressed by generating risk-variance frontiers based on whether the operator targeted swordfish, the single most prevalent and valuable species harvested by the PLL fleet operating in the Atlantic and Gulf of Mexico (Strand 2004; Larkin, Adams, and Lee 2000). The latter is addressed by generating risk-variance frontiers by region and trip length in order to capture spatial differences in stock availability and differences in vessel-level production constraints that are bound to impact the effectiveness of recent regulatory actions (National Marine Fisheries Service 2003).
Methodology A Theory of Fisherman Behavior Portfolio theory is based on the expected utility model (EUM) (Von Neumann and Morgenstern 1944). In this paper we assume that the relevant targeting decisions are
1
The strategic response of vessel operators (e.g. , change in gear deployment or fishing location) to continually updated information (e.g. , environmental conditions, sonar, cooperation with other operators) allows for a degree of control over ex post harvest portfolios. In this trip-level analysis, these responses are assumed identical within each defined subgroup. The distinction of trips by species targeting, location, and trip length are intended to capture the exogenous effects that these characteristics have (which is, in part, a reflection of differences in strategic response) on the resulting harvest mix. The effect of these factors will be to reduce overall production risk. Thus, the reported optimal portfolios will be biased to the extent that these responses have changed since 1996. 2 The focus on harvest risk reflects that the optimal portfolios are based on pounds landed, which is essentially production risk. Given that fish sizes and prices can also vary, additional sources of risk could be modeled for this fleet. Kumbhakar (2002) provides a generalized derivation of a risk preference function. The lack of trip-level fish size and price data precludes the explicit incorporation of these factors; however, relative differences in fish size and price are captured in the analysis.
28
Perruso, Weldon, and Larkin
made at the trip level with no updating occurring during the trip. The fisherman (whether risk averse, risk neutral, or risk preferring) calculates the expected utility associated with each potential harvest portfolio and chooses the alternative that yields the maximum amount of expected utility. This implies that the fisherman is interested in the probability distribution of a portfolio’s net returns because the distribution of this random variable is what generates the values of expected utility used by the vessel operator to rank different targeting strategies. We follow Mistiaen and Strand (2000) and assume that a longliner’s initial wealth is zero in order to rule out the possibility that existing wealth influences ex ante targeting decisions. Consequently, net trip revenues, W *, completely explain fisherman-targeting behavior (i.e., utility function) at the trip level since net returns equal end-of-trip wealth. Since we assume targeting and technological decisions are made ex ante and based on expected trip wealth, our application of the EUM in the quasi-random PLL fishery must consider the probability distribution of W*, as well as the expected utility function so that an optimal harvest portfolio is identified that is consistent with maximization of expected utility. It can be shown that given a fisherman’s utility function, the expected utility associated with a targeting choice is a function of the resulting harvest portfolio’s mean and variance of returns. A Taylor Series expansion is used to approximate a fisherman’s utility function around expected net trip revenues, E[W*]:
U(W*) = U(E[W*]) + U′(E[W*])(W* – E[W* ]) +
1 2
U″(E[W* ])(W* – E[W* ])2 + R3, (1a)
where: ∞
R3 =
∑ n! U 1
(n )
(E[W * ])(W * − E[W * ]) n ,
(1b)
n =3
U(n) denotes the n-th derivative of U, and E[·] is the expectation operator. Assuming the Taylor’s series converges, the fisherman’s expected utility may be expressed as:
E[ U(W *)] = U(E[ W *]) +
1 2
U″(E[ W * ])σ 2 (W *) + E[ R 3 ],
(2a)
where σ2(W*) is the variance of net returns, and mn(W*) denotes the n-th central moment of W*: ∞
E[R3 ] =
∑ n! U 1
(n)
(E[W * ])m n (W * ).
(2b)
n =3
Assuming that a fisherman’s expected utility function is monotonic and strictly concave, preference for expected returns and aversion to variance in returns is guaranteed. By adopting a second-order approximation of the expected utility function, it is further assumed that the corresponding loss function is symmetric, which
Portfolio Approach to Predicting Targeting Strategies
29
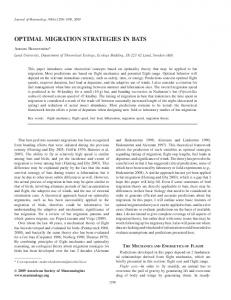
implies that the fisherman is equally averse to negative and positive deviations from expected outcomes.3 Equation (2b) reflects that a fisherman’s expected utility is not solely explained by the first two moments. Rather, expected utility is a function of the mean, variance, skewness, and other higher moments of the probability distribution of net returns. The terms in equation (2b) may be characterized as the approximation error associated with adopting a second-order approximation of the utility function. Since the second-order approximation is exact for certain functional forms (e.g., quadratic), the approximation error will be zero if fisherman behavior (as reflected by the utility function) is correctly specified. Clearly though, expected utility is a function of risk, which we assume is primarily due to production and not price uncertainty, as is more completely described in Kumbhakar (2002). The supply problem facing a multispecies fisherman participating in a quasirandom-harvest fishery is to determine the optimal portfolio of harvested species from an infinite number of possibilities. This is equivalent to determining the probability distribution of net returns. The EUM provides a framework that allows for the characterization of optimal supplies under stochastic harvests by deriving optimal targeting strategies based on the moments of the probability distribution of ex post net returns, which can be estimated using the probability distribution of historical net returns. The EUM also depends upon the fisherman’s utility function. Figure 1 shows indifference curves for a risk-averse fisherman, where each indifference curve represents an infinite number of combinations of expected returns, E, and variance of returns, V, for a given level of expected utility for one individual at one point in time. Higher indifference curves represent successively higher levels of expected utility and, thus, fisherman satisfaction. Furthermore, indifference curves for riskaverse fishermen are sloped upward and convex to reflect a desire for expected returns, a dislike for risk, and a diminishing willingness to assume extra risk. The portfolio method allows one to construct an efficient frontier representing the infinite strategies that could maximize the expected utility of a risk-averse fisherman. For example, point A in figure 1 represents an efficient strategy that would produce the maximum expected utility level EU 2. The portfolio (E-V) model, as initially developed by Markowitz (1959), is an application of EUM based upon specific assumptions about the probability distribution of net returns or the decision-maker’s utility function. For this study, net returns for each candidate species are assumed multivariate normally distributed. Thus, our applied portfolio model of fishermen behavior is based on the mean and variance of expected net revenues under constant fish prices and sizes and is endogenous to the choices implied by the scenarios examined in this paper. However, the model is static and does not incorporate the long-run, dynamic, and possibly nonstationary nature of PLL harvest distributions.
3
This assumption may be unrealistic since fishermen are unlikely to be equally averse to upside and downside risk (i.e. , unusually large or small catches, respectively). However, the symmetry of the loss function is an implicit assumption that is common due to tractability concerns. Although criticism exists in regards to E-V portfolio analysis, Samuelson (1967) comments that “in practice, where crude approximations may be better than none, the two-moment models may be found to have pragmatic usefulness.” Following Samuelson (1967), we argue that relaxing the symmetry assumption by specifying a semivariance or skewed model is beyond the scope of this study and would not readily enhance the applicability of the portfolio model or the final results generated from this particular application.
30
Perruso, Weldon, and Larkin
Figure 1. Efficient Frontier and Optimal Portfolio for Risk-Averse Fishermen
Portfolio Targeting Model The multispecies targeting decision is similar to a financial portfolio allocation problem in that scarce resources are allocated in an effort to acquire valuable assets (fish) from a set of choice possibilities. The targeting choice, which is made prior to departure (ex ante), is considered risky because random factors such as weather, stock size, and unpredictable management rules can cause stochastic harvests and returns. It is assumed that the risk-averse decision maker maximizes expected utility by selecting a harvest strategy on the efficient frontier. Consequently, their targeting strategy consists of allocating effort toward a set of n species based on a tradeoff between trip-level expected returns and variance of returns (i.e. , E and V, respectively). The trip-level unit returns for each species, which are used to calculate E, are assumed to be distributed multivariate normal to ensure that the total trip-level returns (E) are distributed normally. E and V are calculated as follows: n
E =
∑ qe
(3)
i i
i=1
n
V =
n
∑∑ i =1
j=1
σ ij qi q j =
n
n
i=1
j =1
∑ ∑ρ σ σ q q , ij
i
j i
j
(4)
Portfolio Approach to Predicting Targeting Strategies
31
where qi is the trip-level landings in pounds of species i, e i is the per pound net revenues associated with landing species i, and σ i and σii (or σ 2i ) are the standard deviation and variance, respectively, associated with e i. The covariances and correlation coefficients between the per pound net revenues of species i and j are represented by σ ii and ρij, respectively. The resulting quadratic programming problem is to minimize variance of trip returns (V) subject to a specified level of total returns (β), non-negative landings of each species, and trip limits for each species (Qi), respectively:
Minimize V =
n
n
i =1
j=1
∑ ∑σ q q ij
i
j
(5)
subject to: n
E =
∑ qe
i i
≥ β, qi ≥ 0, and qi ≤ Q i ,
i=1
where E is trip net revenue. Varying the value of β in repeated optimizations generates a frontier of efficient harvest strategies. Each point on the E-V frontier minimizes the variance of trip net revenues (E) given a level of expected trip wealth (β). The optimal targeting strategy is the utility maximizing set of qi values, which are used to determine the proportion of each species contained in the optimal portfolio.
Application of the Portfolio Method The PLL Fleet The U.S. Atlantic and Gulf of Mexico PLL fleet is comprised of commercial vessels that fish in the mid-water column by towing a line of at least 100 baited hooks. This fleet fishes out of harbors from Maine to Florida and from Texas to the Caribbean and operates in a multioutput environment, targeting several highly migratory species (HMS). In 1996, the fleet of 272 vessels landed nearly 240,000 fish and sharks valued at $42 million dockside (Larkin, Adams, and Lee 2000). Landings included over 30 species, but were primarily composed of swordfish, tunas (bigeye, albacore, yellowfin, and skipjack), dolphin fish (mahi-mahi), and pelagic and large coastal sharks (i.e. , makos, porbeagles, threshers, sandbars, silkys, blacktips, duskys, and hammerheads).4 The Magnuson-Stevens Fishery Conservation and Management Act requires managers to address overfishing, rebuild fisheries, and minimize bycatch (U.S. Department of Commerce 1996). Management goals are to conserve the biological resource and to achieve economic efficiency within the fishery. In doing so, resource managers are required to minimize any negative economic impacts on fishing communities and industry participants resulting from new regulations (NMFS 1999).
4
Incidental catch (discards) of juveniles, prohibited fish species, marine mammals, and seabirds have recently become an issue for this fishing fleet. These species are not explicitly included in this analysis due to lack of ‘price’ information and reliable catch data in 1996. The implied assumption is that catch of these species is random and uniform across trips.
32
Perruso, Weldon, and Larkin
This objective is mandated by the Regulatory Flexibility Act (RFA), which requires federal regulators to minimize negative regulatory effects on small businesses. All vessels in the Atlantic PLL fleet are classified as small businesses (Larkin, Adams, and Lee 2000). Empirical analysis of this fleet under the RFA has traditionally involved estimating the reduction of commercial fishing revenues resulting from a proposed regulatory change using a deterministic approach (e.g. , Lee, Larkin, and Adams 2000). The portfolio methodology proposed in this paper has the potential to benefit managers trying to more accurately evaluate the economic effects for multispecies fishing fleets. Currently, Atlantic HMS are managed by the National Marine Fisheries Service under the 1999 Fishery Management Plan for Atlantic Tunas, Swordfish, and Sharks (NMFS 1999). By attempting to manage these species under a single plan, regulators acknowledge the importance of biological and economic interactions between the HMS. However, current and proposed time-area closures for individual species (and input controls in general) do not fully account for the multispecies nature of this fishery; thus, possible regulatory cross effects within the fishery are ignored. The portfolio model takes into account these biological and economic interrelationships by examining the covariance structure of species-specific historical net returns. If future HMS policies and regulations are to be efficient, economic information that acknowledges the multispecies nature of the PLL fishery must be considered. The need for additional economic analysis is highlighted by recently enacted regulations that affect specific fishing areas of the HMS fisheries and, thus, the Atlantic PLL fleet. For example, since March 2001, 133,000 square miles of U.S. waters in the South Atlantic and Gulf of Mexico have been partially or entirely closed to longline fishing to protect juvenile swordfish and large coastal shark populations. In the North Atlantic, closures have been enacted to protect bluefin tuna and endangered marine turtles off the coast of New Jersey and on the Grand Banks, respectively. The enactment of time-area closures and proposed input-directed capacity reduction programs ( e.g. , House Resolutions 1367, 4749) suggests that HMS stakeholders are still willing to micromanage the fishery without considering the system-wide effects of the regulations (i.e. , effects on all fisheries and fishing communities). More generally, the existence of these regulatory cross effects implies that imposing indiscriminate time-area closures on a heterogeneous fleet that participates in multiple fisheries with nonselective gear will lead to inefficient utilization of commercial fish stocks.
Data Construction Net revenues per trip and the underlying information to calculate gross revenues and total costs were obtained from data described in Larkin, Adams, and Lee (2000). Data are from 1996, which is the most recent year that sufficient cost information is available.5 Gross trip revenues (TR) are calculated at the ex-vessel level using logbook-reported landings (number of fish), NMFS-reported average fish weights, and dealer-reported mean prices. Total revenues net of operating or variable costs (VC), which is trip net revenue (E), is calculated by subtracting expenditures for fuel, ice,
5
The data collection program was initiated under a voluntary basis in 1996, after which response dropped appreciably. The program has recently been revitalized, although participants are now randomly selected for mandatory reporting (NMFS 2003).
Portfolio Approach to Predicting Targeting Strategies
33
bait, light sticks, and miscellaneous items (e.g. , replacement tackle). The trip-level net revenues reflect the returns to the capital investment and labor. 6 A total of 561 trips with complete cost and landings information was available for the analysis. Although over 30 species were landed in 1996, the number of candidate species, i, included in this study is restricted to eight ( i.e. , n = 8), since the top eight accounted for 95% of total revenues in 1996 (Larkin, Adams, and Lee 2000). In addition, reducing the number of candidate species facilitates the comparisons. The eight species are selected based on a ranking of total average trip revenue and include: swordfish, bigeye tuna, albacore tuna, yellowfin tuna, mako shark, sandbar shark, dolphin fish, and oilfish. Generation of the E-V frontier requires data on the per pound net returns of each species, e i, which are calculated as follows. First, a trip-level activity measure, a, is calculated as a = R/TR, where R is the total trip revenue received from the top eight species, and TR is the total trip revenue received from all species. Thus, a is the revenue share accounted for by the top eight species during each trip. If a = 0, the trip is deleted from the analysis. The total number of trips dropped due to this restriction is 36, which represents 6.4% of the sample. Second, total operating costs are adjusted downward to account for the effort (costs) associated with harvesting and marketing valuable species that are not classified as one of the top eight revenueproducing outputs. This adjustment is accomplished by multiplying the total operating costs for the trip by the trip-level activity measure. Next, activity measures are recalculated for each of the top eight revenue-producing species for each trip as ri = R i/TR, where R i is the total revenue from species i. The net revenues per pound for each species, e i = { Ri – [(VC · a) · ri]}/qi, are then calculated using the adjusted operating costs (VC · a), the species-specific activity level (ri), and the reported landings in pounds per trip (qi ). The decision to allocate costs amongst the species implies that vessel operators expect to harvest a mix of species and no species is costless to harvest, which is a reasonable assumption for this fleet given the indiscriminant nature of the gear and unpredictability of harvest levels (Strand 2004; Mistiaen and Strand 2000). In addition, the single most valuable species harvested by this fleet (of 30 total) accounted for just 47% of total landings in 1996 (Larkin, Adams, and Lee 2000). By assuming the costs are proportional to the total revenue derived from each species, cost effects are captured in the net revenue measure for each species (e i) and will affect the determination of the optimal portfolios to the extent that such costs differ among the defined subgroups (targeting swordfish vs. other or fishing in the North Atlantic vs. Gulf of Mexico). For example, swordfish targeted trips have higher expenditures for light sticks (Larkin, Adams, and Lee 2000). In addition, cost differences affect the measure of total net return (E) and, thus, the location of the E-V frontiers. Using the e i data, the standard deviations, variances, and covariances associated with e i are calculated. The maximum allowable harvest per species per trip, Qi, is computed by multiplying observed species-specific maximum trip-level landings by 125%. 7 The expected net returns, β, are established by increasing net trip returns in6
Labor costs could be removed by assuming the owner receives a share of E, which is typically between 50–60% for this fleet depending on whether the owner also served as captain (Strand 2004; Larkin, Adams, and Lee 2000). For simplicity, the labor payment was not subtracted since it would not change the nature of the results. 7 Since trip-level quotas did not exist for the 1996 PLL fishery, upper boundary harvest levels were arbitrarily set equal to 125% of the maximum observed harvest level. The constraint needs to be set close enough to observed levels to ensure relatively profitable or less risky species do not overwhelm the optimal solution set. However, the constraint should be flexible enough to allow for legitimate effort shifts that would create optimal harvest levels greater than historical levels. If Qi is too low, species i will be underrepresented in the predicted targeting strategy (i.e. , the optimal portfolio will be biased).
34
Perruso, Weldon, and Larkin
crementally. More specifically, β values are incrementally increased by $1,000 beginning with β = 0, which is the “break-even” level, to one increment above the maximum observed net trip revenue.
Results and Policy Implications Scenarios Two sets of scenarios are defined to address the effects of strategic behavior and uniform fishery regulations. For the first set of scenarios, the data are divided into trips that target swordfish and those targeting other species. While ex ante targeting information would be ideal, reliable information is not available for the 1996 PLL fleet operating in the Atlantic and Gulf of Mexico. 8 Thus, an ex post assignment of the trip is necessary. A recent study of the Hawaiian longline fleet identified several factors that can be used to classify trips by target strategy including the use of catch composition, input use, and fishing location (Pradhan, Sharma, and Leung 2003). For swordfish trips in particular, distinguishing statistics include the use of more light sticks or fewer hooks per set (Pradhan, Sharma, and Leung 2003). In 1996, PLL vessels operating in the Atlantic and Gulf whose swordfish revenues accounted for the majority of total trip revenues, spent an average of $627 on light sticks and used 416 hooks per set; for comparison, the remaining trips reported an average expenditure of $221 on light sticks and used 762 hooks per set (Larkin, Adams, and Lee 2000). In this study, revenue compositions are used to identify swordfish trips since the published data supports the distinction, revenue shares incorporate relative price differences (versus catch compositions), and revenue shares are highly correlated with the alternative input use measures ( i.e. , light stick expenditures and hooks per set). Specifically, if swordfish (SWO) revenues accounted for the majority of revenues generated by the top eight species during the trip (i.e. , ri=SWO ≥ 50%), then the trip was considered to have targeted swordfish. 9 Fishing location was not considered, since it will be addressed in the second set of scenarios. The second set of scenarios distinguishes trips by location and length for the purpose of analyzing the effect of an area closure. The geographic distinction is broad; the fishing area is divided into four regions following a recent cost-earnings analysis that showed differences at this resolution (Larkin, Adams, and Lee 2000). This study analyses just two regions, the North Atlantic and Gulf of Mexico,10 since recently enacted and proposed closures affect these areas (NMFS 2003). Within each area, mean-variance frontiers are generated for different trip lengths, which capture differences in vessel size and fishing capabilities (Larkin, Adams, and Lee 2000). These scenarios are specifically designed to examine the impact of area closures intended to protect juvenile swordfish and, to a lesser extent, seabirds and marine
8
While the set forms request the identification of target species, the low response rate and relatively large number of non-exclusive candidate species precludes the use of this information to group trips in this data set (Larkin, Adams, and Lee 2000). 9 A majority rule was used since there was a break in the distribution of the swordfish revenue shares at 50%. While the majority rule is essentially ad hoc, it is stringent given there are a total of eight candidate species. The lack of uniformity in the distribution of swordfish revenue shares reduces the likelihood that trips were misclassified, which would reduce harvest variances and, thus, positively bias swordfish harvest shares. 10 The North Atlantic region corresponds to areas 1, 2, and 3, while the Gulf of Mexico region corresponds to areas 7, 8, 13, and 14 as shown in figure 1 of Strand (2004, p. 149).
Portfolio Approach to Predicting Targeting Strategies
35
Table 1 Summary Statistics for Historical Net Trip Returns Data Subset Swordfish Targeting: ri=SWO ≥ 50% ri=SWO < 50% North Atlantic Region: Trip length 1–3 sets 4–6 sets 7 or more sets Gulf of Mexico Region: Trip length 1–3 sets 4–6 sets 7 or more sets
Obs. (N)
Mean
Standard Deviation
Minimum
Maximum
246 279
6,364.74 5,076.01
10,304.85 6,406.87
–6,108.88 –4,332.29
85,215.64 43,380.40
28 16 29
2,300.14 7,674.47 28,866.12
2,096.21 4,680.76 35,037.31
420.16 1,860.26 2,797.47
10,563.13 18,698.50 150,690.63
36 87 120
4,166.99 6,947.50 13,065.43
7,092.54 5,638.27 9,074.59
107.81 504.63 1,697.55
41,502.96 29,618.63 42,619.57
turtles. The situation of the Atlantic and Gulf of Mexico PLL fleet is analogous to the Hawaiian longline fleet that has also been subject to area closures for turtle protection, which has driven some vessels from the fishery (Pradhan, Sharma, and Leung 2003). Table 1 summarizes information about the historical net trip returns for each scenario. The sample is split almost evenly between trips that target swordfish and those that do not (N = 246 versus 279, respectively). In terms of regional data, there are more observations for the Gulf of Mexico region than for the North Atlantic (N = 243 versus 73, respectively). The “swordfish-targeting” trips, where swordfish revenues comprise the majority of total revenues, earn high average net returns on swordfish, and swordfish returns are generally less risky than those attributed to other species for all trips (table 2). However, trip net returns are more variable for “swordfish” trips compared to those that mainly target other species. The shorter trips (those taking six sets and less) in the North Atlantic region (i.e., Maine through Virginia) earn lower returns, on average, than longer trips (those placing fewer than seven sets) and exhibit lower variability relative to mean net returns. 11 On the other hand, the “long” North Atlantic trips have higher average returns and experience higher risk. The “short” trips in the Gulf region also earn lower mean net revenues; however, variability of returns for these trips is significantly higher than for long trips in this region even though the maximum net return from the shortest trips (1-3 sets) is very close to that of the longer trips ($41,503 versus $42,619, respectively). Ceteris paribus, shorter trips in the Gulf of Mexico appear more lucrative than the same trips in the North Atlantic; however, net returns for these trips are more variable in the Gulf. The opposite is true for longer trips. On average, returns are higher in the North Atlantic but less variable in the Gulf.
11
In reality, operators of vessels fishing fewer days would have less ability to endogenize fishing decisions, such as whether to change the offloading port, days at sea, and fishing location to reduce harvest risk. Under such conditions, the optimal portfolios associated with shorter trips would be based on risk levels that are lower than the actual levels.
36
Perruso, Weldon, and Larkin Table 2 Harvest Portfolios for Trips by Targeting Strategy and Specified β Constraint Portfolio Share Mean ei ($/lb.)
Std Dev ei
Break-Even
Average
High
SWO Targeting: Swordfish Bigeye Tuna Albacore Tuna Yellowfin Tuna Sandbar Shark Mako Shark Dolphin Fish Oilfish
2.73 0.85 0.11 0.88 0.13 0.32 0.57 0.29
0.66 1.36 0.28 0.89 0.28 0.56 0.50 0.52
(β = 0) 0.636 0.030 0.079 0.066 0.083 0 0.085 0.022
(β = 10,000) 0.636 0.030 0.079 0.066 0.083 0 0.085 0.022
(β = 65,000) 0.608 0.055 0.046 0.149 0.036 0 0.093 0.012
Non-SWO Targeting: Swordfish Bigeye Tuna Albacore Tuna Yellowfin Tuna Sandbar Shark Mako Shark Dolphin Fish Oilfish
1.67 0.93 0.21 1.35 0.14 0.40 0.66 0.24
1.38 1.44 0.37 0.80 0.30 0.61 0.49 0.47
(β = 0) 0.052 0.015 0.009 0.203 0.400 0.086 0.165 0.069
(β = 5,000) 0.061 0.015 0.008 0.234 0.293 0.119 0.192 0.078
(β = 45,000) 0.098 0.124 0.020 0.338 0.055 0.056 0.293 0.015
Species
Scenario Set 1: Targeting Behavior Figure 2 depicts the E-V frontiers associated with trips that report 50% or more revenues attributed to swordfish landings and those that do not. The break-even, mean, and maximum levels of expected net returns (i.e. , different β values) are also included. If all longliners in each sample partition are assumed to have similar utility functions and risk preferences, one could imagine a family of indifference curves, as described in figure 1, superimposed on figure 2. The frontiers in figure 2 suggest trips that target swordfish exhibit a smaller degree of variability than trips that do not. This is because swordfish is a relatively high-priced low-risk output, especially when caught in large quantities (as in the “swordfish” trips); thus, this attractive asset dominates the harvest portfolio. Mean returns per pound for each species and their associated risk are reported in table 2. Swordfish-targeted trips can expect to earn, on average, an additional $1.06 per pound for swordfish than trips targeting an alternative species, and the nonswordfish targeted trips experience more variability in swordfish returns. When compared to bigeye tuna, yellowfin tuna generate higher returns with lower risk to PLL vessels, especially for nonswordfish targeted trips. Dolphin fish appear to generate moderate returns with relatively low risk regardless of swordfish targeting behavior. Although trips targeting other species expect higher returns on nonswordfish species (such as tuna, shark, or dolphin fish) relative to the swordfish trips, the standard deviations indicate that these returns are risky for both types of targeting behavior. Ceteris paribus, a swordfish targeting strategy is preferred, since expected trip wealth is higher at various levels of risk based on the 1996 data.
Portfolio Approach to Predicting Targeting Strategies
37
Figure 2. E-V Frontiers by Swordfish (SWO) Targeting Strategy
Table 2 also includes optimal portfolios associated with the break-even, average, and high net revenue trips identified on the efficient frontier in figure 2. Average net revenue trips have β values that are close to the reported means in table 1, while high net revenue trips approach levels that are approximately two standard deviations above mean net revenues. As the top half of table 2 shows, the model is consistent in the sense that it suggests vessels that target swordfish should continue that targeting behavior regardless of expected revenues. For instance, if the model had proposed that average-revenue swordfish trips should target more than 50% of the catch as tunas, stakeholders would have little confidence in the model’s usefulness. The model also suggests that as the expected net revenues increase, vessels targeting swordfish could reduce production risk by diversifying the harvest portfolio and increasing relative harvest levels of yellowfin tuna. A swordfish-targeting vessel operator may be intrigued to know that in order to minimize risk, secondary harvests of tuna, dolphin, and sandbar sharks are beneficial since these species contributed 3% to 15% each to the risk-minimizing harvest portfolio for a high-return swordfish trip. For trips that mainly target species other than swordfish, the bottom half of table 2 shows that the model again produces strategies consistent with historical data. Whether revenue expectations are low, medium, or high, the model suggests that swordfish harvest should be less than 10% of the total catch. Again, as expected net revenues increase, risk-minimizing strategies suggest that yellowfin tuna and dolphin fish take on a more significant role. Also, in this general scenario, lowerrevenue trips would be expected to heavily target dolphin and shark species to diversify their harvest portfolio.
38
Perruso, Weldon, and Larkin
Scenario Set 2: Area Closures The frontier and portfolio comparisons across regions and trip length are utilized to investigate the usefulness of the portfolio model to regulators in policy-making situations. Given the legislated need for an assessment of the economic effects associated with proposed regulatory changes, fishery managers are interested in the optimal targeting behavior of risk-minimizing, expected profit-maximizing operators. In particular, PLL managers may use the new methodology to assess the economic effects of area closures on specific partitions of the fleet. For instance, Perruso (2003) suggests that vessels making shorter trips might be disproportionately affected by area closures designed to protect juvenile swordfish species in the Gulf of Mexico. When area closures are enacted, affected longliners must search for alternative fishing grounds. Because trip length and vessel size are positively correlated, area closures may change the composition of the PLL fleet (Larkin, Adams, and Lee 2000). In particular, smaller vessels that have less capability to substitute fuel for location (and less hold capacity to remain at sea longer) could be effectively eliminated from open-access fisheries by the increased search requirements. Table 3 shows optimal targeting strategies for trips in the North Atlantic by the specified return constraint (β) and number of sets, as well as the mean and variability of net returns per pound per species. One commonality among the North Atlantic trips is that net returns for bigeye and yellowfin tuna rival those from swordfish in magnitude and variability. Furthermore, swordfish harvests should account for less than 6% of the total catch portfolio for trips that place less than seven sets in the North Atlantic region, regardless of the level of expected net returns, but should heavily target sandbar sharks, and to a lesser extent dolphin fish. The model suggests that longer trips (i.e. , more than six sets) should include swordfish in the output portfolio at levels from 23% to 46%, depending on the net revenue expectation. These results suggest that an indiscriminate closure, designed to limit swordfish or tuna harvests and force the fleet from an area (e.g. , North Atlantic), could disproportionately harm certain sectors of the fleet (e.g. , if shorter trips are taken primarily by vessels that have a limited capacity to substitute fuel for an alternative location). From the model, it is clear that vessels taking shorter trips in the North Atlantic should not be actively targeting swordfish, but instead should be focusing more on sharks. If these operators are allowed to remain in the regulated areas, they may have only a minimal effect on the stock rebuilding process. Returns may be recovered by allowing these vessels to stay in the regulated area and adjust their targeting strategies away from swordfish and threatened tuna species toward sharks and dolphin fish. However, if these operators are forced to move and have trouble absorbing the extra search costs associated with the closure, the regulation will unequally burden these firms and might cause otherwise healthy and efficient operators to leave the industry. Additionally, longer trips (i.e. , those that placed more than six sets) generally expect higher returns for all species and much less variability of these returns. The lower level of risk that these vessels face allows them to incorporate the extra costs associated with a closure much easier than shorter trips (i.e. , those that placed six sets or less). In the North Atlantic, vessels making short trips have to deal with the same extra search burden that the longer trips incur, but they must also contend with a more uncertain production scenario as evidenced by the much higher variability in expected returns. The vessels making the shortest trips (i.e., three sets or less) are the most likely to be forced from the industry during the closure period. Not only do they have to accept the same search costs to find alternative grounds as the larger boats, but they also expect to receive much lower returns, on average, under more production risk.
Portfolio Approach to Predicting Targeting Strategies
39
Table 3 Harvest Portfolios for North Atlantic Region by Trip Length and β Constraint Portfolio Share Species
Mean ei ($/lb.)
Std Dev ei
Break-Even
Average
High a
1–3 Sets per Trip: Swordfish Bigeye Tuna Albacore Tuna Yellowfin Tuna Sandbar Shark Mako Shark Dolphin Fish Oilfish
0.48 0.82 0.13 0.70 0.46 0.99 0.28 0
1.08 1.38 0.32 0.88 0.44 0.68 0.50 0
(β = 0) 0.045 0.064 0.045 0.154 0.407 0.174 0.110 0.045
(β = 3,000) 0.044 0.116 0.035 0.159 0.442 0.071 0.132 0.044
N/A N/A N/A N/A N/A N/A N/A N/A
4–6 Sets per Trip: Swordfish Bigeye Tuna Albacore Tuna Yellowfin Tuna Sandbar Shark Mako Shark Dolphin Fish Oilfish
1.76 2.90 0.39 1.67 0.08 0.62 0.60 0
1.46 1.01 0.47 0.58 0.22 0.67 0.51 0
(β = 0) 0.017 0.116 0 0.209 0.541 0.066 0.050 0
(β = 8,000) 0.034 0.187 0 0.336 0.320 0.041 0.082 0
(β = 13,000) 0.062 0.261 0.053 0.251 0.226 0.029 0.119 0
7+ Sets per Trip: Swordfish Bigeye Tuna Albacore Tuna Yellowfin Tuna Sandbar Shark Mako Shark Dolphin Fish Oilfish
2.72 2.74 0.68 1.65 0.02 0.94 0.83 0.05
0.73 1.22 0.37 0.55 0.13 0.57 0.38 0.29
(β = 0) 0.230 0.036 0.178 0.233 0 0.058 0.266 0
(β = 30,000) 0.286 0.048 0.030 0.286 0 0.087 0.264 0
(β = 75,000) 0.462 0.100 0.014 0.175 0.002 0.121 0.129 0
N/A indicates the β level was not available for this scenario (i.e. , the mean and maximum values were very similar). a
On the other hand, table 4 (with corresponding results for the Gulf of Mexico region) suggests that shorter trips (i.e. , six sets or less) in the Gulf region should target swordfish more heavily (even more than longer trips with more than six sets in most instances). The mean and variability of returns attributed to swordfish are similar across short and long trips in the Gulf region. According to the portfolio model, under a race-to-harvest management regime where, for example, species are regulated with aggregate harvest quotas, all types of PLL vessels in the Gulf region would likely target swordfish. This specific harvest pressure differentiates short trips in this region from short trips in the North Atlantic. In both regions, the model highlights the importance of cross-species effects in the PLL fishery. Thus, managers could use the information on optimal portfolios to predict where redirected effort will be applied in response to species-specific legislation. Regulated or bycatch species could be introduced into the model through additional constraints or a penalty function.
40
Perruso, Weldon, and Larkin
Table 4 Harvest Portfolios for the Gulf of Mexico Region by Trip Length and β Constraint Portfolio Share Species
Mean ei ($/lb.)
Std Dev ei
Break-Even
Average
High
1–3 Sets per Trip: Swordfish Bigeye Tuna Albacore Tuna Yellowfin Tuna Sandbar Shark Mako Shark Dolphin Fish Oilfish
1.83 0 0 0.50 0.20 0.31 0.31 0.19
1.24 0 0 0.72 0.33 0.56 0.42 0.42
(β = 0) 0.164 0 0 0.180 0.382 0.045 0.202 0.027
(β = 3,000) 0.205 0 0 0.210 0.271 0.046 0.239 0.028
(β = 9,000) 0.138 0 0 0.607 0.102 0.018 0.125 0.010
4–6 Sets per Trip: Swordfish Bigeye Tuna Albacore Tuna Yellowfin Tuna Sandbar Shark Mako Shark Dolphin Fish Oilfish
2.20 0.26 0.05 1.17 0.12 0.21 0.57 0.27
1.10 0.80 0.17 0.80 0.28 0.46 0.48 0.48
(β = 0) 0.211 0.022 0.074 0.216 0.072 0.177 0.153 0.074
(β = 5,000) 0.245 0.022 0.018 0.242 0.118 0.084 0.182 0.089
(β = 15,000) 0.198 0.008 0.006 0.340 0.081 0.031 0.291 0.043
7+ Sets per Trip: Swordfish Bigeye Tuna Albacore Tuna Yellowfin Tuna Sandbar Shark Mako Shark Dolphin Fish Oilfish
2.25 0.60 0.04 1.44 0.07 0.28 0.74 0.61
1.21 1.18 0.17 0.76 0.23 0.55 0.46 0.62
(β = 0) 0.128 0.020 0.141 0.183 0.108 0.061 0.263 0.096
(β = 15,000) 0.176 0.026 0.015 0.256 0.070 0.056 0.367 0.032
(β = 35,000) 0.206 0.018 0.008 0.295 0.034 0.027 0.395 0.016
The increased influence of swordfish on optimal harvest portfolios and a greater number of trips indicates that regulators may have a legitimate reason for enacting an area closure across the entire fleet in the Gulf of Mexico to preserve swordfish stocks. Furthermore, trips placing three sets or less in the Gulf expect much higher and less variable earnings than their counterparts in the North Atlantic. In fact, the risk associated with Gulf earnings for short trips is very similar to longer trips (i.e. , those that place four or more sets) for moderate trip income expectations (i.e. , below $5,000). Figure 3 shows the E-V frontiers for all trips in the Gulf region. Another insight is the lack of influence that bigeye and albacore tuna species have on all trips in this region; however, yellowfin tuna should be a major part of the harvest portfolio for trips that expect high revenues, regardless of the number of sets placed. Similarly, harvests of dolphin fish should comprise a significant portion of the catch of all trips. This information is important because regulators are concerned about the increased impact on dolphin fish and yellowfin species from the longline industry (NMFS 2003).
Portfolio Approach to Predicting Targeting Strategies
41
Figure 3. E-V Frontiers for the Gulf of Mexico by Number of Sets
Figure 4. E-V Frontiers for 4-6 Set Trips in the North Atlantic and Gulf of Mexico
42
Perruso, Weldon, and Larkin
Lastly, figure 4 compares the E-V frontiers of trips that placed from four to six sets in both the Atlantic and Gulf of Mexico. Although expected returns are high in the Gulf region in most cases for these medium range trips, a comparison of the frontiers clearly shows that returns in the North Atlantic are less variable, ceteris paribus, than those associated with harvests in the Gulf of Mexico.
Summary and Conclusions This paper applies a portfolio approach to modeling the behavior of fishermen faced with multiple targeting options in a random-harvest fishery. The approach utilizes historical landings data on multiple species to explain the risky targeting decision, which is assumed made at the onset of the trip. The approach is novel in that it draws from the expected utility hypothesis and financial portfolio theory to predict optimal targeting strategies of fishermen participating in multiple-species fisheries. The model addresses the production risk in multispecies harvesting by using the expectation and variability of net returns to produce an efficient risk-return frontier. As trip-level expected net returns are varied, the model produces minimum-risk harvest portfolios that maximize the expected utility of the fisherman. The model is applied to the U.S. Atlantic and Gulf of Mexico pelagic longline fleet that primarily targets swordfish, large tunas, dolphin fish, and sharks. Application of the portfolio model to the 1996 longline fleet produces a variety of insights. The results suggest that, in general, vessels that take longer trips (i.e. , larger vessels; Larkin, Adams, and Lee 2000) expect to receive higher and less variable returns. In the Gulf of Mexico, however, vessels taking shorter trips are not as negatively affected as those in other regions. Yellowfin tuna should be a dominant species in the output mix of all trips except those that mainly target swordfish; as expected, the swordfish-targeted trips should devote over 60% of their portfolios to swordfish, regardless of revenue expectations. Also, fishermen may be surprised to find that diversifying their harvest portfolios with secondary species such as sharks and dolphin fish reduces the variance associated with net revenue expectations. Lastly, the model predicts that dolphin fish and yellowfin tuna should become more dominant species in the output mixes. The derived harvest strategies may also differentiate sectors of the fleet that might be disproportionately affected by an indiscriminate regulation, such as closures. The portfolio model gives supporting evidence to the likelihood that vessels taking shorter trips would be unequally burdened under an area closure. For instance, due to the low expected profits and high associated variability of short trips in the North Atlantic region, these vessels would have greater difficulty adapting to the additional search burden than vessels able to take longer trips. Furthermore, the results suggest that risk-minimizing, expected profit-maximizing vessels that take shorter trips should limit swordfish to less than 6% of their output portfolio in all regions. Since these trips are short in duration, relatively few in number, and collectively account for a minor share of total swordfish landings (Larkin, Adams, and Lee 2000), regulators could consider excluding these vessels from swordfish-directed regulations, so they may stay in the industry. Conversely, the results suggest that short trips in the Gulf of Mexico should target swordfish, just as their longer-trip counterparts. Taking into account the higher returns, lower risk, and larger number of trips associated with short trips in this region, the portfolio model provides regulators with evidence that an indiscriminate area closure with the goal of reducing juvenile swordfish mortality might be more suitable for this area. Lastly, portfolio information may predict which species will be targeted in lieu of a closure. This is
Portfolio Approach to Predicting Targeting Strategies
43
important if economic and biological interrelationships exist in a multispecies fishery. Managers could predict where displaced swordfish effort may be redirected in response to an area closure by looking at optimal portfolios. For example, in response to a closure of juvenile swordfish grounds, the model predicts optimal target strategies would shift toward dolphin fish, yellowfin tuna, or shark species. Overall, the portfolio model appears to have value for managers attempting to assess the economic impacts of legislation in accordance with government requirements. An individual fisherman could use his/her historical returns to derive optimal portfolios based on the probability distribution of their observed net returns, not on those based on an entire subsection of the fleet, which is assumed to consist of a representative, homogeneous PLL vessel. Also, individual fishermen considering switching to a dominant swordfish strategy could use optimal portfolio information along with their preference for risk to decide if the change would be profitable. If the portfolio model is to be practical for individual fishermen making long-run decisions, consideration should be given to a dynamic analysis and the likelihood of additional species-specific regulations.
References Andersen, P. 1982. Commercial Fisheries under Price Uncertainty. Journal of Environmental Economics and Management 9:11–28. Baldursson, F.M., and G. Magnusson. 1997. Portfolio Fishing. Scandinavian Journal of Economics 99(3):389–403. Bockstael, N.E., and J.J. Opaluch. 1983. Discrete Modeling of Supply Response under Uncertainty: The Case of the Fishery. Journal of Environmental Economics and Management 10:125–37. Curtis, R., and R.L. Hicks. 2000. The Cost of Sea Turtle Preservation: The Case of Hawaii’s Pelagic Longliners. American Journal of Agricultural Economics 82:1191–97. Dupont, D. 1993. Price Uncertainty, Expectations Formation and Fishers’ Location Choices. Marine Resource Economics 8:219–47. Francis, R.I.C.C. 1992. Use of Risk Analysis to Assess Fishery Management Strategies: A Case Study Using Orange Roughy (Hoplostethus atlanticus ) on the Chatham Rise, New Zealand. Canadian Journal of Fisheries and Aquatic Sciences 49:922–30. Hilborn, R., J. Maguire, A.M. Parma, and A.A. Rosenberg. 2001. The Precautionary Approach and Risk Management: Can They Increase the Probability of Successes in Fishery Management? Canadian Journal of Fisheries and Aquatic Sciences 58:99–107. Holland, D.S., J.N. Sanchirico, R.E. Curtis, and R.L. Hicks. 2004. An Introduction to Spatial Modeling in Fisheries Economics. Marine Resource Economics 19(1):1–6. Holland, D.S., and J.G. Sutinen. 1999. An Empirical Model of Fleet Dynamics in New England Trawl Fisheries. Canadian Journal of Fisheries and Aquatic Sciences 56:253–64. _. 2000. Location Choice in New England Trawl Fisheries: Old Habits Die Hard. Land Economics 76:133–49. Jensen, C.L. 2002. Applications of Dual Theory in Fisheries: A Survey. Marine Resource Economics 17:309–34. Kirkley, J.E., and I.E. Strand. 1988. The Technology and Management of Multi-Species Fisheries. Applied Economics 20:1279–92.
44
Perruso, Weldon, and Larkin
Kumbhakar, S.C. 2002. Risk Preferences and Technology: A Joint Analysis. Marine Resource Economics 17(2):77–89. Larkin, S., C. Adams, and D. Lee. 2000. Assessing Heterogeneity in the U.S. Atlantic Pelagic Longline Fleet Using 1996 Logbook Data. Marine Fisheries Review 62:49–60. Larson, D.M., W.R. Sutton, and J.M. Terry. 1999. Toward Behavioral Modeling of Alaska Groundfish Fisheries: A Discrete Choice Approach to Bering Sea/Aleutian Islands Trawl Fisheries. Contemporary Economic Policy 17:267–77. Lauck, T., C.W. Clark, M. Mangel, and G.R. Munro. 1998. Implementing the Precautionary Principle in Fisheries Management through Marine Reserves. Ecological Applications 8(1):S72–S78. Lee, D., S. Larkin, and C. Adams. 2000. A Bioeconomic Model of Management Alternatives for the U.S. North Atlantic Swordfish Fishery. Marine Resource Economics 15(2):77–96. Markowitz, H.M. 1959. Portfolio Selection: Efficient Diversification of Investments. New York: John Wiley and Sons, Inc. Mendelssohn, R. 1979. Determining the Best Trade-Off between Expected Economic Return and the Risk of Undesirable Events When Managing a Randomly Varying Population. Journal of the Fisheries Research Board of Canada 36:939–47. Mistiaen, J.A., and I. Strand. 2000. Location Choice of Commercial Fishermen with Heterogeneous Risk Preferences. American Journal of Agricultural Economics 82:1184–90. National Marine Fisheries Service (NMFS). 1999. Final Fishery Management Plan for Atlantic Tunas, Swordfish and Sharks, Volume I. Silver Spring, MD. _. 2003. 2003 Stock Assessment and Fishery Evaluation for Atlantic Highly Migratory Species. Silver Spring, MD. Perruso, L. 2003. Three Essays on Production Models in Multispecies Fisheries. Ph.D. Dissertation, Department of Food and Resource Economics, University of Florida, Gainesville, FL. Pope, R.D., and R.E. Just. 1996. Empirical Implementation of Ex Ante Cost Functions. Journal of Econometrics 72:231–49. Pradhan, H.C., K.R. Sharma, and P. Leung. 2003. Analyzing Technical and Economic Interrelationships in Hawaii’s Longline Fishery. Marine Resource Economics 18(2):167–93. Samuelson, P.A. 1967. General Proof That Diversification Pays. Journal of Finance and Quantitative Analysis 2:1–12. Sanchirico, J.N., and M.D. Smith. 2003. Trophic Portfolios in Marine Fisheries: A Step towards Ecosystem Management. RFF Working Paper, Resources for the Future, 1616 P Street NW, Washington, DC 20036, August. Smith, M.D. 2000. Spatial Search and Fishing Location Choice: Methodological Challenges of Empirical Modeling. American Journal of Agricultural Economics 82:1198–1206. Smith, M.D., and J.E. Wilen. 2003. Economic Impacts of Marine Reserves: The Importance of Spatial Behavior. Journal of Environmental Economics and Management 46:183–206. Squires, D., and J. Kirkley. 1995. Resource Rents from Single and Multispecies Individual Transferable Quota Programs. ICES Journal of Marine Science 52:153–64. Strand, I.E. Jr. 2004. Spatial Variation in Risk Preferences Among Atlantic and Gulf of Mexico Pelagic Longline Fishermen. Marine Resource Economics 19(1):145– 60.
Portfolio Approach to Predicting Targeting Strategies
45
U.S. Department of Commerce (USCD). 1996. Magnuson-Stevens Fishery Conservation and Management Act. NOAA Technical Memorandum NM S-/SPO-23. Washington, D.C. Von Neumann, J., and O. Morgenstern. 1944. Theory of Games and Economic Behavior. New York: John Wiley and Sons, Inc. Ward, J.M., and J.G. Sutinen. 1994. Vessel Entry-Exit Behavior in the Gulf of Mexico Shrimp Fishery. American Journal of Agricultural Economics 76:916– 23.