Jun 19, 2010 - visual complexity âαâ as well as with the fractal dimension Db. KEYWORDS: .... Used first to study natural forms [23], fractal analyses covered ..... http://www.levien.com/artofcode/ei04/contrast.pdf ... Fractals: Form, Chance, and.
Courrier du Savoir – N°16, Octobre 2013, pp.89-97
PREDICTING PERCEIVED COMPLEXITY USING LOCAL CONTRAST STATISTICS AND FRACTAL INFORMATION *
*
*
**
L. KACHA , N. MATSUMOTO , A. MANSOURI , A. CAVALCANTE *
Nagoya Institute of Technology, Graduate School of Engineering, Japan ** Nagoya University, Graduate School of Information Science, Japan
ABSTRACT This study aims to explore visual complexity in streetscape composition using RMS contrast information and Fractal Analysis. The dataset was composed of 74 streetscape images, taken in Algeria and Japan in daytime and nighttime. The evaluation and analysis covered two phases: (1) Subjective quantification of perceived complexity using ranking method. (2) Visual complexity measurement based on RMS contrast statistics and fractal characteristics of the streetscape images. The results showed a positive correlation between the subjective ranking of complexity in streetscape images and the proposed measure of visual complexity “α” as well as with the fractal dimension Db.
KEYWORDS: Visual Complexity, Cognitive appraisal, RMS Contrast statistics, Fractal Dimension
1
INTRODUCTION
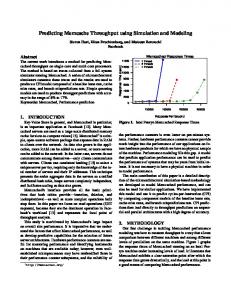
A Street is not simply a space along which pedestrians move. Together with buildings and natural scenery, it is a substantial part of the outdoor environment. Streetscape is a key element of townscape because of its substance that creates the city’s attractiveness and affects the pedestrians’ comfort [1, 2]. The present study focuses on the complexity that refers to visual richness, which is generated from layered profiles within a streetscape. These profiles include the street space, architectural variety of buildings, street elements like signage and furniture, trees, human activity, etc. The complexity generated through the connectedness of these profiles is the theme of the present study (Figure 1). The idea was to explore visual complexity in selected streets from different architectural and urban contexts in Algeria and Japan. In Algerian cities, streets have a mosaic of typologies generated by a superposition of diverse urban patterns, such as Ottoman, French colonial and vernacular [3]. Like in major Asian cities, streets in Japan are generally characterized by an ephemera of elements attached to the buildings and an intense human activity [1]. The sensory overload in streetscapes caused by an excessive complexity can influence the cognitive responses of pedestrians and their behavior. In order to explore how the physical characteristics of the streetscape can influence the perception of visual complexity, this research proposed two different approaches of measurement. (1) Root Mean Square (RMS) contrast measures and (2) Estimation of fractal dimension. These two measures might help in predicting human judgments of complexity in streetscapes.
Figure 1: Conceptual composition of the streetscape system
2
LITERATURE DESIGN
REVIEW
AND
RESEARCH
Basically, subjective or perceived complexity is defined as the complexity of a composition as perceived by an external observer [4]. In order to measure subjective complexity, some studies tried to quantify complexity of the stimuli by asking subjects to rate scenes on the basis of a general complexity scale [5, 6]. Other studies collected ratings from subjects on different scales of complexity and transformed them into a single measure [7, 8]. Objective or physical complexity is defined as the intrinsic complexity of a composition, independent from an external observer. The analysis of physical complexity is related to the level in which the streetscape is perceived. Low-level of
Université Mohamed Khider – Biskra, Algérie, 2013
L. KACHA & al. perception is related to edges and textures while high-level perception is related to objects and scene recognition. Several studies attempted to derive objective measures of complexity by analyzing different aspects that covered: (1) irregularity and amount of elements disposition [9], (2) number of segments constituting random polygons [10], (3) checkerboard grain [11], (4) order and disorder using Fourier transform [12,13] and (5) entropy of pixel intensities [14], etc.
images were shot from the right side of each street to avoid heterogeneity in the vision fields. The image resolution was 4288 x 2848 pixels with a quality of 14 bits/pixel. The original set of images was converted to JPEG format using Nikon ViewNx 2 software, with “Highest Compression Ratio” settings. For the evaluation done by the subjects, original images in the format described above were used.
The present study attempted to explore complexity in the visual composition of streetscapes according to the relationship between subjective and objective measurements (Figure 2). (1) The first phase consisted in the quantification of the cognitive features related to visual complexity as seen by fifteen subjects. This phase covered complexity ranking using C-score. (2) The second phase covered two physical dimensions: (2.a) Low level perception: measuring the fractality of the edge textures in streetscape images using box-counting method;
Figure 3: Example of streetscape images
(2.b) High level perception: measuring visual complexity using RMS contrast statistics. RMS contrast measure represents the most reliable [15] and the most commonly used measure to quantify the details of an image in image processing systems [16, 17].
Figure 2: Research design Figure 4: Data collection method
3
DATA COLLECTION
4
The dataset used in this study was composed of 74 streetscape images. 37 images were shot in Al-Kantara and Batna cities. The other 37 images were taken in the cities of Kyoto and Tokyo (Figure 3). Within the dataset, 40 images were acquired in daytime and 34 images in nighttime using a digital camera Nikon D300S with Nikkor lens system AFS DX 35mm f/1.8G. All images were taken during summer season in two phases. The first phase was done in Algeria between the 17th and the 19th of June 2010. The second phase was done in Japan between the 4th and the 5th of August 2010. The camera was fixed on a tripod in order to avoid artifacts caused by camera shaking (Figure 4). All
4.1 4.1.1
COGNITIVE VISUAL COMPLEXITY Experiment Subjects
Fifteen Japanese undergraduate and graduate students in the department of architecture at Nagoya Institute of Technology took part in this study. The experiment was conducted with seven males and eight females who have basic academic experience in urban studies. Their average age was 23 years old.
90
Predicting Perceived Complexity Using Local Contrast Statistics and Fractal Information
4.1.2
Procedure
r
Images in the dataset were presented in RGB color model using a large high-resolution display Dell UltraSharpTM 3008WFP 760 (Figure 5). The distance between each participant and the display was about 80 cm.
1 80 vi .c (i ) 3 i
Where vi is the number of times a specific image was located by the subjects at a position i.
Figure 7 exhibits the range of r-values for each streetscape category, based on the ranking of all subjects. The category of simple streetscapes consisted of 25 Algerian streetscapes (15 daytime and 10 nighttime streetscapes) and three Japanese streetscapes (one daytime and two nighttime streetscapes). The category of ordinary streetscapes included 18 images (nine Algerian and nine Japanese streetscapes; among them six were daytime streetscapes and 12 were nighttime streetscapes). The category of complex streetscapes covered 28 images (Three Algerian and 25 Japanese streetscapes; among them 18 were daytime streetscapes and ten were nighttime streetscapes).
Fi gure 5: Participant evaluating Streetscape images
Authors explained the aim of the experiment to the subjects and asked each one of them to estimate the visual complexity of each streetscape image by considering it as a whole system of interacting elements and patterns. Each participant was asked:
Algerian streetscapes dominated the low level of the rating scale, in which they represented the entire simple category and the lower part of the ordinary category. Japanese streetscapes dominated the higher level of the rating scale, in which they represented the major part of the complex group and the higher part of the ordinary group.
(1) First, to divide the dataset into seven different groups on the basis of a general seven-point scale of complexity “very simple, considerably simple, a bit simple, ordinary, a bit complex, considerably complex, very complex” (Figure 6).
Figure 6: Complexity ranking scale
(2) Second, to rate the images within each group according to an increasing order of complexity from 1 to 74.
4.2
Cognitive ranking
After gathering the ranked data from the subjects, it was necessary to represent the divisions among the seven categories. These divisions could be identified by including five more imaginary items, with additional ranking positions that represent five axes of separation within the dataset. For example, if the simple group contained ten streetscapes, the division between simple and ordinary categories occupies the 11th position in the ranking. The ranking positions “i” (where i=1, 2,…,80) were scaled down to c-scores “c(i)”.
c (i ) 2.
Figure 7: Cognitive ranking analysis
5
i 38.5 5 22
FRACTAL CHARACTERISTICS OF THE EDGE TEXTURES IN STREETSCAPES
Fractal is a term derived from the Latin verb “frangere” and the adjective “fractus”, which means rough, irregular and fragmented [18]. Fractal geometry describes fractured shapes, which show repeating patterns that demonstrate “scale invariance” or “self-similarity” at different fine magnifications. This description is based on a parameter
The final rank r of each picture was calculated on the basis of its average positioning.
91
L. KACHA & al. called fractal dimension [19, 20, 21, 22]. Used first to study natural forms [23], fractal analyses covered also urban studies by linking urban hierarchy to fractal geometry. Other studies explored the relationship between the fractal character of townscape and environmental perception, such as: preference, aesthetics, complexity, interest, etc. Fractal dimension in urban and architectural studies has been investigated by a number of authors according to different objectives in order to analyze: (A) the structure of spatial growth of cities [24, 25], (B) natural and urban skyline [26, 27, 28, 29], and (C) historic street plans [30, 31].
Figure 8: Box-counting method
5.1
6
Image preprocessing
CONTRAST STATISTICS OF STREETSCAPE IMAGES
To analyze fractal information and self-similarity in streetscapes, images in the dataset were transformed into binary bitmap files (*.bmp) using Sobel algorithm in order to detect their edges. The process was based on detecting white edges on a black background.
Human capacity to discern information includes the ability to perceive differences in luminance within a field of vision. This creates different patterns of contrast that provide visual information to the viewer.
5.2
The definition of image contrast depends on its application. Various methods of contrast measurement emerged from each application, that is to say: simple contrast, Weber contrast, Michelson contrast and RMS (root-mean-square) contrast.
Estimation of Fractal Dimension Db
Fractal dimension can be measured according to various methods that depend on the aim of each research. However, all these methods are based on a power law that generates scale-invariant properties [32]. Box-counting is the most commonly used mathematical method to estimate the fractal dimension of an object because it can measure images that are not entirely self-similar.
RMS contrast is defined as the standard deviation of pixel intensities, commonly applied for non-periodic targets (noise, textures and images) [16, 17]. It does not depend on spatial frequency content neither on spatial distribution of contrast within an image. It is considered by Levien (2003), in his study on contrast in natural images, as the most reliable indicator of visible images [15]. It represents the most commonly used measure to quantify image details in image processing systems as well as a good predictor of the subjective/apparent contrasts of compound grating images and random noise patterns [28].
In this study, a large grid was placed over each streetscape image. Each square in the grid was checked to determine the presence of white pixels (Figure 8). Then, boxes that contain white pixels were recorded. In the following step, a grid of smaller scale was placed over the streetscape images and the same process was applied in order to search possible white pixels (details) in the grid boxes. Finally, a comparison was made between the number of boxes with details in the first grid and the number of boxes with details in the second grid. This comparison was made by plotting a log-log diagram (Richardson plot) for each grid size . Repeating this process over multiple grids of different scales produce a log-log linear correlation between the number of counted boxes and the associated grid.
6.1
Images were transformed from color scales to grayscale and resampled to 1072 x 712 pixels because of the complexity of color images and the hardness of their processing whereas contrast can be efficiently estimated using grayscale images. A “gray” color is the one in which red, green and blue components all have equal intensity in RGB space. Grayscale images are entirely sufficient for many tasks because less information needs to be provided for each pixel. It is only necessary to specify a single intensity value for each pixel, as opposed to three intensities needed to specify each pixel in a full color image.
This paper used Benoit 1.3© software, which defines fractal dimension as the exponent D in the equation: N (d )
Image preprocessing
1 d Ds
Where N(d) is the number of boxes of linear size d, necessary to cover a data set of points distributed in a two-dimensional plane.
6.2
Image Contrast and Measure of complexity α
In this study, let us consider around every pixel I(i,j) of the
92
Predicting Perceived Complexity Using Local Contrast Statistics and Fractal Information
input image, a neighborhood of 2N x 2N pixels denoted by a vector n. σn represents the RMS contrast of luminance, which is the standard deviation of luminance values in a neighborhood n (Figure 9). For all possible locations (i,j), the respective n is processed by a workflow. Then, a contrast map C is built, so that each value C(i,j) is the RMS contrast of n.
2
1 4L n (ni n)2 2 4L i 1 σn represents the RMS contrast of luminance ni represents one pixel inside the neighborhood n n is the mean value of n.
Figure
10:
Fractal dimensions of Algerian and Streetscapes in daytime and nighttime
Japanese
Figure 9: Block diagram of the physical measure.
By considering a specific pixel I(i,j) and its respective n, the contrast map C is calculated as:
C (i, j ) n
The proposed measure of visual complexity was based on the statistical analysis of contrast distribution within each streetscape image. For an objective appraisal of visual complexity α, this study defines α as the mathematical product of the mean value of a neighborhood n and the standard deviation of pixel intensities:
c . n α is the visual complexity; μc is the mean of RMS contrast values C(i,j); σc is the standard deviation of RMS contrast values C(i,j).
7
Figure 11: Visual complexity α of Algerian and Japanese Streetscapes in Daytime and Nighttime
Figure 12 shows examples of contrast maps of seven streetscape images as ranked on the 7-point scale: (1) very simple, (2) considerably simple, (3) rather simple, (4) ordinary, (5) rather complex, (6) considerably complex, (7) very complex. Figure 12.a represents the original images, figure 12.b represents their respective grayscale images, figure 12.c represents their respective contrast maps, figure 12.d represents the histogram of the contract map C, figure 12.e represents their respective edge texture and figure 12.f represents their respective log-log plot. In contrast maps, sharp changes of luminance receive very high values, which highlight features such as image contours. The differences between contrast maps were quantified using their histograms.
RESULTS AND DISCUSSION
The results related to fractal dimension Db and visual complexity α showed higher values for Japanese streetscapes compared to Algerian streetscapes. This is due to the important amount of details and elements (such as signage, vegetation, etc.), which characterizes Japanese streetscapes. Also, daytime streetscapes have higher fractal dimension and visual complexity compared to nighttime streetscapes. Light in daytime makes details and textures more apparent, which is not the case in nighttime (Figure 10, 11).
93
L. KACHA & al.
Figure 12: Contrast and Fractal Analysis of selected streetscapes
94
Predicting Perceived Complexity Using Local Contrast Statistics and Fractal Information
Figure 13 shows how visual complexity α, mean contrast µ, standard deviation σ and fractal dimension Db correlate with the cognitive rankings given by r-values.
The correlation between fractal dimension and visual complexity α was strong (r=0.80). Fractal dimension also strongly correlates with mean contrast µ (r=0.84) and with standard deviation σ (r=0.65) (Table 2).
Table1: Correlation coefficients between complexity measures μ, σ, α, Db and subjective rankings r-values
Time
City
r-values
Country/Time
Country
Streetscapes
Figure 13: Correlation between μ, σ, α, Db and r-values
Table 1 shows in detail how visual complexity α, mean contrast µ, standard deviation σ and fractal dimension Db correlate with judgmental responses of subjects using rvalues. For example, Japanese streetscapes have higher correlation coefficients compared to Algerian streetscapes, both in daytime and nighttime. This is due to richness and complexity that characterize Japanese streetscapes.
μ
σ
α
Db
All Str.
0.63
0.63
0.69
0.44
Algerian Str.
0.49
0.47
0.53
0.29
Japanese Str.
0.65
0.54
0.68
0.47
Algerian Daytime Str.
0.60
0.57
0.69
0.35
Algerian Nighttime Str.
0.52
0.43
0.49
0.30
Japanese Daytime Str.
0.63
0.43
0.70
0.02
Japanese Nighttime Str.
0.63
0.44
0.64
0.47
Batna Daytime Str.
0.73
0.33
0.67
0.72
Al-Kantara Daytime Str.
0.61
0.72
0.76
0.14
Batna Nighttime Str.
0.44
0.30
0.38
0.19
Al-Kantara Str.
Nighttime
0.33
0.39
0.36
0.19
Tokyo Daytime Str.
0.70
0.09
0.49
-0.41
Kyoto Daytime Str.
0.40
0.59
0.79
-0.06
Tokyo Nighttime Str.
0.08
0.20
0.12
-0.13
Kyoto Nighttime Str.
0.69
0.40
0.69
0.47
Daytime Str.
0.75
0.70
0.79
0.53
Nighttime Str.
0.72
0.69
0.75
0.59
Time
Perceived complexity is likely to increase as the number of high-contrast features increases. The mean µ positively correlates with the subjective ranking of complexity of each streetscape image. Standard deviation σ is a measure of contrast variety within the visual composition. It increases with the presence of features that generate C(i,j) values, either higher or lower than µ. Interestingly, visual complexity α and fractal dimension Db do not use information about color distribution, which is likely to have an important influence on the judgments of subjects.
City
Fractal Dimension Db
Compared to daytime streetscapes, most of nighttime streetscapes have lower mean contrasts because of the lack of light. Since several nightscapes have high r-values, humans do not seem to judge their visual complexity only on the basis of parameters derived from contrast information.
Country/Time
Country
Table2: Correlation coefficients between complexity measures μ, σ, α and fractal dimension Db
95
Streetscapes
μ
σ
α
All Str.
0.84
0.65
0.80
Algerian Str.
0.81
0.64
0.75
Japanese Str.
0.88
0.60
0.81
Algerian Daytime Str.
0.76
0.02
0.53
Algerian Nighttime Str.
0.75
0.76
0.77
Japanese Daytime Str.
0.48
-0.51
0.05
Japanese Nighttime Str.
0.84
0.62
0.82
Batna Daytime Str.
0.75
0.00
0.53
Al-Kantara Daytime Str.
0.81
0.03
0.58
Batna Nighttime Str.
0.93
0.88
0.96
Al-Kantara Str.
0.74
0.68
0.71
Tokyo Daytime Str.
-0.42
-0.63
-0.57
Kyoto Daytime Str.
0.69
-0.61
0.05
Tokyo Nighttime Str.
0.40
0.03
0.41
Kyoto Nighttime Str.
0.83
0.55
0.80
Daytime Str.
0.78
0.21
0.60
Nighttime Str.
0.78
0.70
0.79
Nighttime
L. KACHA & al.
8
[12] Matsumoto, N., Teranishi, N. & Senda, M. (1991). Studies on factors of disorder and regularity in the street view: Studies on disorder and regularity in the central business district -Part 1-, Journal of architecture, planning and environmental engineering, No. 429, pp. 73-82.
CONCLUSION
The present study tried to estimate perceived complexity in streetscapes using local contrast statistics and fractal information. The findings of this research could reflect a positive correlation between the complexity ranking of streetscape images and their visual complexity as well as their fractal dimension. This correlation was higher with visual complexity α compared to the correlation with fractal dimension. It was high in daytime and moderate in nighttime.
[13] Seta, S, Matsumoto N, Tanabe J. (2003). A study on usefulness of Fourier Transform Method for Evaluating Streetscapes, Journal of architecture, planning and environmental engineering, No. 569, pp. 85-92. [14] Mansouri, A., Matsumoto as a background of composition of daytime Japan, proceeding of the on Architecture in Asia, 1204.
It is important to mention the limitations of this study. First, this study could only cover four cities in Japan and in Algeria, because of many constraints related to time limits. Second, this study covered only one view position from the sidewalk. Third, physical characteristics did not take into consideration other psychological variables such as familiarity. And finally, both methods of physical complexity methods did not use information about color distribution, which is likely to have an important influence on the judgments of subjects.
[15] Levien, R. (2003). Resolution-Dependence of Perceived Contrast of Textures. http://www.levien.com/artofcode/ei04/contrast.pdf [2012 – 09 – 10]. [16] Frazor, R.A., Geisler, W.S. (2006). Local luminance and contrast in natural images, Vision Research, Vol. 46, pp.1585-1598.
REFERENCES [1]
Ashihara, Y. (1983). The Aesthetic Townscape, Translate by: E. Riggs L., MIT press, Cambridge London
[2]
Matsumoto, N. et al. (1997). Physical and mental factors of anticipation in the streetscape, MERA International Conference on Environment-Behavior Studies for the 21st Century, pp: 283-286.
[3] [4] [5]
[6]
Côte, M. (1993). L'Algérie ou Édition Média plus, Constantine. Cullen, G. London.
N. (2010). Study of entropy complexity in the visual streetscapes in Algeria and 8th International Symposium AIJ, Kitakyushu, pp. 1201-
(1961). Townscape,
l'Espace
[17] Bex, P.J. et al. (2009). Contrast sensitivity in natural scenes depends on edge as well as spatial frequency structure, Journal of Vision, Vol. 9(10), pp.1-19. [18] Mandelbrot, B.B. (1982) The Fractal Geometry of Nature. W.H. Freeman, New York [19] Taylor, R. P., Micolich, A.P., & Jonas, D. (1999a). Fractal analysis of Pollock's drip paintings. Nature, 399, 422.
retourné,
Architectural
[20] Taylor, R. P., Micolich, A. P., & Jonas, D. (1999b). Fractal expressionism. Physics World, 12, pp. 25-28.
Press,
[21] Taylor, R. P., Micolich, A. P., & Jonas, D. (2002). The construction of Pollock's fractal drip paintings. Leonardo, 35, 203.
Messinger, S. M. (1998). Pleasure and complexity: Berlyne revisited. The Journal of Psychology, Vol. 132, pp. 558-560.
[22] Gouyet, J. F. (1996). Physics and fractal structures. New York: Springer.
Nasar, J. (2002). What design for a presidential library? Complexity, typicality, order and historical significance, Empirical Studies of the Arts, Vol. 20, pp. 83-99.
[23] Mandelbrot, B. B. (1977). Fractals: Form, Chance, and Dimension. San Francisco: W. H. Freeman and Company,
[7]
Osborne, J. W., Farley, F. H. (1970). The relationship between aesthetic preference and visual complexity in abstract art, Psychonomic Science, Vol. 19, pp. 69-70.
[24] Batty, M., Longley, P. (1994). Fractal cities: A Geometry of Form and Function, Academic press, London.
[8]
Stamps, A. E. (2002). Entropy, visual diversity, and preference, The Journal of General Psychology, Vol. 129, pp. 300-320.
[25] Frankhauser, P. (1994). La Fractalite des structures urbaines, Anthropos, Paris.
[9]
Berlyne, D. E., Ogilvie, J. C., & Parham, L. C. C. (1968). The dimensionality of visual complexity, interestingness, and pleasingness. Canadian Journal of Psychology, Vol. 22, pp. 376-387.
[26] Oku, T., (1990). On visual complexity of the urban skyline'' Journal of Planning, Architecture and Environmental Engineering, Vol. 412, pp.61-71 [27] Cooper, J., (2003). Fractal assessment of street level skylines: a possible means of assessing and comparing character, Urban Morphology, Vol. 7(2), pp. 73-82
[10] Hall, A. C. (1969). Measures of the complexity of random black and white and colored stimuli. Perceptual and Motor Skills, Vol. 29, pp. 773-774.
[28] Cooper, J. (2005). Assessing Urban Character: The Use of Fractal Analysis of Street Edges. Urban Morphology 9(2), pp. 95-107.
[11] Nicki, R. M. (1972). Arousal increment and degree of complexity as incentive. British Journal of Psychology, Vol. 63, pp. 165-171.
[29] Heath, T., Smith, S. G. and Lim, B., (2000). Tall
96
Predicting Perceived Complexity Using Local Contrast Statistics and Fractal Information
Building and the Urban Skyline: The Effect of Visual Complexity on Preferences, Environment and Behavior, Vol. 32, No. 4, pp. 541-556
[32] Taylor, R.P., Sprott, J.C., (2008). Biophilic Fractals and the Visual Journey of Organic Screen-savers, Nonlinear Dynamics, Psychology, and Life Sciences, Vol. 12, No. 1, pp. 117-129.
[30] Kakei, H. and Mizuno, S., (1990). Fractal Analysis of Street Forms, Journal of Architecture, Planning and Environmental Engineering, Vol. 8, No. 414, pp. 103108
[33] Moulden, B., Kingdom F., Gatley L F. (1990). The standard deviation of luminance as a metric for contrast in random-dot images, Perception 19(1), pp. 79-101.
[31] Rodin, V. and Rodina, E., (2000). The fractal dimension of Tokyo's streets, Fractals Vol. 8 pp. 413418
97