ACSIJ Advances in Computer Science: an International Journal, Vol. 3, Issue 2, No.8 , March 2014 ISSN : 2322-5157 www.ACSIJ.org
Predicting students’ grades using fuzzy non-parametric regression method and ReliefF-based algorithm Javad Ghasemian1, Mahmoud Moallem1 and Yasin Alipour2 1
School of Mathematics and Computer Sciences, Damghan University Damghan, Iran
[email protected],
[email protected] 2
Information Technology Department, Damghan University Damghan, Iran
[email protected]
Abstract
potentially ameliorate some aspect of educations. These
In this paper we introduce two new approaches to predict the
data can be extracted from a number of sophisticated web-
grades that university students will acquire in the final exam of a
based learning and course management tools called
course and improve the obtained result on some features
Virtual Learning Systems (VLSs) such as Moodle, eFront,
extracted from logged data in an educational web-based system.
ATutor and many others, include among other features
First we start with a new approach based on Fuzzy non-
such as course content delivery features, assignment
parametric regression; next, we introduce a simple algorithm
submission, online conferences, quiz modules, grade
using ReliefF estimated weights. The first prediction technique is
reporting system and log books [1].
yielded by integrating ridge regression learning algorithm in the
Educational Data Mining can be used in many aspects of
Lagrangian dual space. In this approach, the distance measure for
education, from students, to instructors, as well as staff to
fuzzy numbers that suggested by Diamond is used and the local
improve teaching/learning process and make better
linear smoothing technique with the cross validation procedure
decisions
for selecting the optimal value of the smoothing parameter is
prediction of student performance with high accuracy is
fuzzified to fit the presented model. Second approach is based on
useful in many contexts in all educational institutions for
ReliefF attribute estimation as a weighting vector to find the best
identifying slow learners and distinguishing students with
adjusted results. Finally, to check the efficiency of the new
low academic achievement or weak students who are
proposed approaches, the most popular techniques of traditional
likely to have low academic achievements.
data mining methods are compared with the presented methods.
The increase of transactional educational systems as well
Keywords: Educational Data Mining, Predicting Marks, Fuzzy
as rich databases of student information has created large
Non-parametric Regression, KDD, ReliefF, WEKA, Matlab
repositories of valued data reflecting how students learn.
about
educational
activities.
Hence,
the
On the other hand, the use of internet in education has created a new context known as e-learning or web-based
1. Introduction
education in which large amounts of information about Globally the application of data mining [25] in education
teaching/learning interactions are endlessly generated and
is great. Educational data mining (also known as EDM) is
ubiquitously available. All this information provides a
a type of knowledge discovery science and focused on the
gold mine of educational data [2] and also makes some
development of techniques for making discoveries within
challenges for researchers for a long time.
the unique types of data that gathered from educational
In this paper we have presented two new approaches. First
environments, and using those methods to understand
we introduced a novel approach based on fuzzy non-
efficaciously the students and help them to learn better and
parametric
regression
by
integrating
ridge-type
43 Copyright (c) 2014 Advances in Computer Science: an International Journal. All Rights Reserved.
ACSIJ Advances in Computer Science: an International Journal, Vol. 3, Issue 2, No.8 , March 2014 ISSN : 2322-5157 www.ACSIJ.org regularization in the Lagrangian dual space and using
Martnínez [10], predicts student academic success (classes
Gaussian kernel as well as smoothing parameter, all
that are successful or not) using discriminant function
together to reach the accurate prediction. And second
analysis. Minaei Bidgoli and Punch [11], classify students
approach introduced an algorithm to integrate a ReliefF
by using genetic algorithms to predict their final grades.
weighting criteria as a weighting vector to find the
Kotsiantis and Pintelas [12], predict a student’s marks
adjusted result. In both presented proposals, with
(pass and fail classes) using regression techniques for the
discovering of dataset composed of crisp inputs, we can
students at Hellenic Open University. Romero et al. [13]
infer a single aspect of data (student marks) from some
show how web usage mining can apply in e-learning
combination of other aspects of data (such as online
systems in order to predict the final marks and Amelia
quizzes).
Zafra, et al. [14] presented a multiple instance learning for
In the next section, we summarize the related work. The
classifying students for data in Cordoba University.
proposed statistical approach includes concepts and
As a valued reference, Romero and Ventura [15] provided
applied methods introduced in section 3. Section 4
a survey which contains a categorized review of the main
introduces of integrating ReliefF weighting criteria as a
research studies using educational data mining techniques
weighting vector to use in prediction. Section 5 introduces
in the virtual learning environments.
the case study and the data in this study carried out. Section 6 reports on and compares experimental results for
3. First Approach: Fuzzy Non-parametric Regression methods
all algorithms tested. Finally, Section 7 concludes the paper.
Generally there are two ways to develop a fuzzy regression model: (1) models where the relationship of the
2. Related work
variables are fuzzy; and (2) models where the variables
In last decades, many studies around the determining of
themselves are fuzzy. In order to formulation the problem,
students’ performance have been performed. Many
we focus on models, in which the data and relationship
statisticians have tried to predict and examine the
between variables are fuzzy.
outcomes [3] and many educational psychologists have
Although many practical situations has implemented using
tried to understand and explain the issue [4].
parametric forms of fuzzy regression, large datasets with a
Also with the widespread accessibility of the World Wide
complicated underlying variation trend, that used fuzzy
Web services and evidence of e-learning solutions many
parametric regression, may have produce unrealistic
technological approaches have been emerged. Naeimeh
outcomes. Hence, some other approaches have been
Delavari et al. [5], proposed a model with different types
developed to deal with the fuzzy non-parametric
of education-related guidelines and the data mining
regression problems; such as Ishibuchi and Tanaka [16],
techniques appropriate for dealing with large amounts of
that integrated several fuzzy non-parametric regression
generated data in higher learning institutions. Luan et al.
techniques with traditional back-propagation networks and
[6], express an instance of a specific case study of
Cheng and Lee [17], have applied the radial basis function
clustering students with similar characteristics. Zafra and
in fuzzified neural networks. Also with respect of
Ventura [7] proposed an innovative technique based on
significant development of statistical non-parametric
multi-objective grammar guided genetic programming to
smoothing methods, integrating smoothing techniques into
detect the most relevant activities that a student needs to
non-parametric regression problems lead to achieve the
pass a course in virtual learning environment. Chanchary
better prediction.
et al. [8], analyze student logs belong to a learning
In this study, we concentrate on ridge regression method,
management system with data mining and statistical tools
which
to discover relationships between student’s access
smoothing (LLS), that is a special case of the local
behavior and overall performance. Fausett and Elwasif [9],
polynomial smoothing technique, which is fuzzified to
predict student’s grades (classified in five classes: A, B, C,
handle fuzzy non-parametric regression with triangular
D and E or F) from test scores using neural networks.
fuzzy numbers based on the distance measure proposed by
integrated
with
non-parametric
local
44 Copyright (c) 2014 Advances in Computer Science: an International Journal. All Rights Reserved.
linear
ACSIJ Advances in Computer Science: an International Journal, Vol. 3, Issue 2, No.8 , March 2014 ISSN : 2322-5157 www.ACSIJ.org dependent variable (output). F(x), a mapping from D to
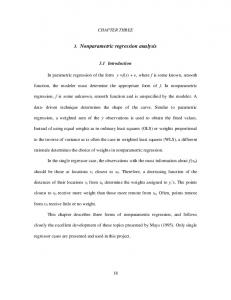
Diamond [18]. Figure 1 shows a representation of
T(R), is an unknown fuzzy regression function with its
triangular fuzzy number. A distance based on cross
center, lower and upper limits being respectively m(x),
validation procedure for selecting the optimal value of the
l(x) = m(x) − α(x) and r(x) = m(x) + β(x). Moreover ε
smoothing parameter is also suggested.
is an error term. Instead of being solely regarded as a
random error with mean zero, ε may also be considered as a fuzzy error or a hybrid error containing both fuzzy and random components. {+} is an operator whose definition depends on the fuzzy ranking method used.
3.2 Local Linear Smoothing Method Let (x , Y )| x ∈ R , i = 1,2,3, … , n be a sample of the observed crisp inputs and triangular fuzzy outputs of Fig. 1 A triangular fuzzy number M
model (1) with the underlying fuzzy regression function:
F(x) = (l(x), m(x), r(x)). The main object in fuzzy non-
In the rest of the study first explain the basic concepts of
parametric regression is to estimate F(x) at any x ∈ D ⊆
triangular fuzzy numbers and the local linear smoothing model will be presented. Then appropriate kernel function
R based on (x , Y ), i = 1,2, … , n. As pointed out by Kim
and the smoothing parameter have been determined.
corresponding observed fuzzy number. From this point of
3.1 Basic concepts
view, we shall estimate m(x), l(x) and r(x) for each x ∈ D
method. Next fuzzy ridge non-parametric regression
and Bishu [19], the membership function of an estimated fuzzy output should be as close as possible to the
in the sense of best fit with respect to some distances that As described later, this section is focused on fuzzy non-
can measure the closeness between the membership
parametric regression model with multiple crisp input and
functions of the estimated fuzzy output and the corresponding observed one. Suppose that m(x), l(x) and
triangular fuzzy output. In this section, based on local
r(x) have continues partial derivatives with respect to
linear smoothing approach, a fitting procedure is proposed
each component x in the domain D of x. Then, for a given x = (x , x , … , x ) ∈ D and with Taylor’s expansion,
for this model. Assume a = (m − α , m , m + β ) be a triangular
m(x), l(x) and r(x) can be locally approximated in a
fuzzy number with its left, center, and right spread being. The membership function of a is:
neighborhood of x , respectively by the following linear
t − (m − α ) if m − α ≤ t < m α m + β −t μ = if m ≤ t < m + β ⎨ β ⎪ otherwise (1) ⎩0
functions:
⎧ ⎪
l(x) ≈ l(x) = l(x ) + l( )(x )(x − x ) + ⎧ … + l( ) (x ) x − x , ⎪ ⎪ m(x) ≈ m(x) = m(x ) + m( ) (x )(x − x ) + … + m( ) (x ) x − x , ⎨ ⎪ r(x) ≈ r(x) = r(x ) + r ( ) (x )(x − x ) + ⎪ … + r( ) (x ) x − x , ⎩
In this paper we point to the space of all fuzzy triangular numbers by T(R), i.e.:
(R) = {a: a = (m − α , m , m + β )}
(4)
(2)
Where l (x ), m (x ), and r (x ), j = 1,2,3, … , p are respectively the derivatives of m(x), l(x) and r(x)
Now, look at the following multi variable fuzzy nonparametric regression model:
with respect to x at x .
Y = F(x){+}ε = m(x) − α(x), m(x), m(x) + β(x) {+}ε
Let a = (l , m , r ) and b = (l , m , r ), m , r , m , r ≥
(3)
In this model, x = (x , x , … , x ) is a p-dimensional crisp
0 be any two triangular numbers in T(R). Diamond
defined a distance between a and b as follows:
independent variable (input) where, its domain is assumed
to be D ⊆ R ; also Y ⊆ T(R) is a triangular fuzzy
d(a, b) = (l − l ) + (m − m ) + (r − r )
45 Copyright (c) 2014 Advances in Computer Science: an International Journal. All Rights Reserved.
(5)
ACSIJ Advances in Computer Science: an International Journal, Vol. 3, Issue 2, No.8 , March 2014 ISSN : 2322-5157 www.ACSIJ.org F(x) = l(x), m(x), r(x) at x .
The distance (5) measures the closeness between the
in equation (7), denoted, respectively by m(x ), l(x ) and r(x ) as the estimates of the centre, the lower and the
We henceforth based on this distance we can extend the local linear smoothing technique to fit the fuzzy non-
upper spread of F(x) at x . That is the estimate of F(x) at
parametric model (1). With the observed data
(x , Y ) = x , … , x , l , m , r i = 1,2,3, … , n
( )
,
x :
F(x) =
(6)
and based on Diamond’s distance (5), the following
( ), ( ), ̂ ( ) =
locally weighted least-squares is formulated. That is
d
l ,m ,r
( )
K (‖x − x ‖) =
−
+
+
With
− x ‖)
m − m(x ) −
−x
r − r(x ) −
respect
− x ‖)
to
, l(x ), m(x ), r(x )
l − l(x )
l
m
(x ) x − x
( )
K (‖x − x ‖) =
( )
(10)
and by utilizing matrix notations, we can immediately obtain
l(x ), l(
K (‖x
)
(x ), … , l
(x )
= X (x )W(x ; h)X(x ) m(x ), m(
)
(x ), … , m
= X (x )W(x ; h)X(x ) r(x ), r (
(x ) x − x
K (‖x and l
‖x − x ‖ h , i = 1,2,3, … , n h
)
(x ), … , r
(7)
(x ),
(x )
are a sequence of weights at x whose role is to make the
X (x )W(x ; h)M
= X (x )W(x ; h)X(x )
X (x )W(x ; h)R
1 x ⎡ 1 x X(x ) = ⎢ ⎢⋮ ⎣1 x
−x ⎤ −x ⎥ ⎥ −x ⎦
l ⎡ l ,L = ⎢ ⎢ ⋮ ⎣l
(8)
X (x )W(x ; h)L
(x )
Where
m (x ), r (x ), j = 1,2,3, … , p for the given kernel K (. ) and smoothing parameter h,
K
(( ),
According to the principle of the weighted least-squares
(x ) x
m(x ), l(x ), r(x )
( ) − ( ),
− ( )
K (‖x − x ‖)
r
(9)
It is natural to take the solutions of m(x ), l(x ) and r(x )
membership functions of two triangular fuzzy numbers.
and
⎤ ⎥, ⎥ ⎦
−x −x −x
…x …x ⋮ …x
m m M = ⋮ m
,
R =
r r
r
⋮
W(x ; h) = diag K (‖x − x ‖)K (‖x − x ‖), … , K (‖x − x ‖) .
data that are close to x contribute more in estimating the
parameters at x than those that are farther away with the
adjustment of h. By solving this weighted least-squares
problem, we can obtain not only the estimates of m(x ),
(11)
(12)
Thus, the estimated fuzzy regression function is
l(x ) and r(x ) at x , but also those of their respective
F(x ) = l(x ), m(x ), r(x )
derivatives l (x ), m (x ), r (x ), j = 1,2,3, … , p. Since we mainly focus on estimating the underlying fuzzy
( )
= e H(x ; h)L , e H(x ; h)M , e H(x ; h)R
non-parametric regression function
46 Copyright (c) 2014 Advances in Computer Science: an International Journal. All Rights Reserved.
(13)
ACSIJ Advances in Computer Science: an International Journal, Vol. 3, Issue 2, No.8 , March 2014 ISSN : 2322-5157 www.ACSIJ.org parameter value is the important key point in the local
where
H(x ; h) = X (x )W(x ; h)X(x )
smoothing techniques. There are a few approaches to
X (x )W(x ; h)
selecting the optimal value of the smoothing parameter for
(14)
the above local linear smoothing method, such as
and e = (1,0, … ,0) , a (p+1)-dimensional vector with the
Bayesian and bootstrap, cross-validation and generalized cross-validation [20-22]. In this paper, a distance based on
first element being unity and the others being zero.
Diamond [18] to describe a fuzzified cross-validation
3.3 Fuzzy ridge nonparametric regression model
procedure can be used and described as follows. Let F( ) (X ; h) = l( ) (X ; h), m( ) (X ; h), r( ) (X ; h)
In most cases, due to multi co-linearity among independent
variables,
either
the
matrix
( )
(18)
be a predicted fuzzy ridge non-parametric regression
X (x )W(x ; h)X(x ) , is a singular matrix or it is very
function at input X computed by equation (13) with the
close to a singular matrix. In this paper, we use ridge
smoothing parameter h. In this paper we use the following
regression to overcome this problem. Ridge regression
error evaluation criterion that we named it as CV (Cross-
gives computational efficiency in finding solutions of fuzzy regression models particularly for multi variable
validation). In practice, to reach the optimal value of h
cases. In this case if we denote Θ, M, W, W and N by
closely depends on the degree of smoothness of the
Θ = (θ , … , θ , θ , … , θ , θ , … , θ ) , M = (M , … , M , M − α , … , M − α , M + β ,…,M + β ) , W = W(x ; h) = diag K (‖x − x ‖), K (‖x − x ‖), … , K (‖x − x ‖) ,
regression function we have to compute for a series of values of h to obtain h0. Afterward, we reach the most minimum value of proposed CV based on h0.
CV(h) =
(15)
WQ 0 0 W 0 0 W = 0 W 0 and N = 0 WQ 0 0 0 W 0 0 WQ
=
Where Q is a n × n matrix of Q =< x , x > and 0 is the
n × n zero matrix. We have:
Θ = 2λ(N + λI) WM.
1 n
1 n
d
Y , F (x , h) l − l (x ; h)
m − m (x ; h)
+
+ r − r (x ; h)
(19)
(16)
4. ReliefF-based algorithm
3.4 Selecting the kernel function and adjust smoothing parameter
Beside the presented approach in section 3, in this paper we also introduce a simple but robust solution to achieve a
After we use the above procedure to fit the fuzzy ridge
good prediction. In the rest of the article we utilize the
non-parametric regression model (1), the regularization
ReliefF weighting criteria as follows.
parameter λ, the Kernel K(. ) and the smoothing parameter
h in the weight K (. ) should be determined first. As
4.1 ReliefF basic concepts
point x contribute more to estimate F(x) than those that
which can be used with incomplete and noisy data [23]. A
discussed later the role of weights K(‖x − x ‖), i =
ReliefF is an improved algorithm and more robust one,
1,2,3, … , n is to make the data that are close to the given
key idea of the ReliefF algorithm is to estimate the quality
are farther away. There are many types of kernel
of attributes (predictors) for input data and response a
functions. In this study, we used Gaussian kernel
weighting vector for classification or regression with K
K(x) =
exp −
(17)
nearest neighbors. Weight vector, is consisting of attribute
Smoothing parameter h in the weight K (. ) is used to
weights ranging from [-1..1] with large positive weights
√
.
assigned to important attributes. Attribute weights
adjust the smoothness of the estimates l(x), m(x), and r(x). Therefore, the proper selection of the smoothing
computed by ReliefF usually depend on accurate selection
47 Copyright (c) 2014 Advances in Computer Science: an International Journal. All Rights Reserved.
ACSIJ Advances in Computer Science: an International Journal, Vol. 3, Issue 2, No.8 , March 2014 ISSN : 2322-5157 www.ACSIJ.org
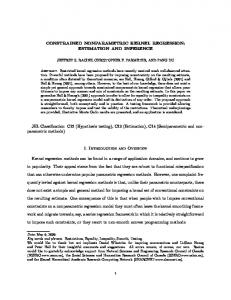
Fig. 2 Prediction accuracy of testing data in FNPreg, RMSE= 0.0031, Accuracy= 0.994
of K nearest neighbors. User-defined parameter k controls the locality of the estimates. In most proposes, this
5. Case study
parameter can start with 10, so in the presented algorithm it can be safely set to 10 too.
This study employs actual training and testing datasets exported to CSV format with totally 108 records from
4.2 Proposed Algorithm
students in Damghan University during an academic year In algorithm 1 the pseudo code of the presented approach
from September to June in machine learning course using
has been provided. Vector W is consisted of ReliefF
the Moodle platform [1]. This platform can store some
weighting factors (line 4) and utilize with a metric element
specific tasks carried out by the students during an
to make a metric vector called S (lines 5, 6, 7). Finally the
academic year, just before the Final Examinations. In
index of minimum value in vector S is mapped to a class
order to collect information, each user in the system is
position in training set and its value returned as outcome
assigned an identifier and every time he/she logs onto the
(lines 8, 9, 10).
framework, all movements within a particular course are stored with respect to his/her access to content and tools
Algorithm 1 proposed ReliefF-based Algorithm
(e.g. calendar, discussion forum, email archive, chat,
1. set all weightsW[A] = 0.0;
quizzing, and assignments) [24]. In our work, both the
2. set C1 = count(TestingSet);
information about four quizzes that taken from students
3. set C2 = count(TrainingSet);
along the semester as well as final marks obtained in this
/* Estimate attributes weight and make weighting
course, are considered.
vector W */ 4. W[A] = ReliefF(TrainingSet, k)
6. Experimentation and results
5. for i = 1 to C1 do begin 6.
This section discusses the experimental results. First
for j = 1 to C2 do begin [ ] = ∑( [ ] × |
7.
_ ( )|);
section provides the results of the traditional algorithms as
_ ( )−
shown in table 1. And second section provides the performance of our proposal that is provided in table 2.
/* find the minimum value in Set with its position */
6.1 Experimental results of traditional algorithms
8. value = minimum(Set);
The purpose of the experimentation is to show that
9. position = indexvalue;
proposed
10. return(TrainingSet_Class[position]);
effectiveness of the classical representation, in predict
11. end;
student’s grades. Thus, first a comparative study is carried
approaches
improve
the
efficiency
and
out between the most applicable algorithms and then the presented proposal is evaluated for solving the same
48 Copyright (c) 2014 Advances in Computer Science: an International Journal. All Rights Reserved.
ACSIJ Advances in Computer Science: an International Journal, Vol. 3, Issue 2, No.8 , March 2014 ISSN : 2322-5157 www.ACSIJ.org
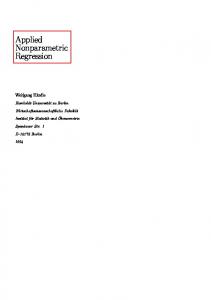
Fig. 3 Prediction accuracy of testing data in ReliefF-based algorithm, RMSE= 0.6236, Accuracy= 0.9075
problem. In order to hold all experiments in the same conditions, each of them using 10-fold stratified cross-
6.2 Results obtained using our proposals
validation, and they are reported in this section. To
In this section we discuss the performance achieved by our
compare the proposed approach we consider some popular
proposal. Number of records is chosen to be 30 percent
paradigms that have shown good results in other
randomly chosen as testing set and number of running
applications.
algorithms are about over 25 times. Results of two
Table 1 report Root Mean Squared Error and accuracy
proposed algorithms are shown as follows:
using R2 criterion for the measurements for all algorithms
•
Fuzzy nonparametric regression
employed in this study.
CV outcomes for some smoothing argument (ℎ)
and regularization parameter ( ) is adjusted and
Table 1 Experimental results of traditional methods
Algorithms
Accuracy
best value is computed around ℎ = 0.128 and
RMSE
= 0.0002. Figure 2 shows the prediction
Algorithms based on rules
results for randomly 30 percent samples as fuzzy
M5Rules
0.7066
1.4709
triangular final grades. At a glance, the accuracy
Bagging
0.7049
1.4481
of the prediction is clearly seen and it can be
DecisionTable
0.5662
1.6357
shown that the presented approach returns values
ConjunctiveRule
0.3974
1.7529
much nearest to the actual ones beside traditional
Algorithms based on decision tree
presented algorithms. •
M5P
0.7066
1.4709
RepTree
0.4694
1.6965
Figure 4 shows the prediction diagram for 30
DecisionStump
0.3046
1.9544
percent randomly chooses. And figure 5 shows
ReliefF-based algorithm
Algorithms based on regression
the accuracy of the presented algorithm using R2
PaceRegression
0.7200
1.4635
LinearRegression
0.7066
1.4709
SMOreg
0.6865
1.3402
SimpleLinearRegression
0.6398
1.6088
LeastMedianSquared
0.6383
1.9360
6
IsotonicRegression
0.5662
1.6140
4
AdditiveRegression
0.5029
1.6572
2
criterion. 10 R² = 0.994
8
Algorithm based on Neural Network
FNPReg Linear (FNPReg)
0
GuassianProcess
0.7628
1.4188
MultilayerPerceptron
0.6961
1.7692
RBFNetwork
0.5722
1.6211
0
5
10
Fig. 4 Prediction accuracy of fuzzy non-parametric regression (FNPreg)
49 Copyright (c) 2014 Advances in Computer Science: an International Journal. All Rights Reserved.
ACSIJ Advances in Computer Science: an International Journal, Vol. 3, Issue 2, No.8 , March 2014 ISSN : 2322-5157 www.ACSIJ.org In the following, table 2 shows the accuracy and root
categorical variables together. Another interesting work is
mean squared error (RMSE) provided by each proposed
implementing a method with integrating ridge-type
algorithm of testing datasets. The values indicates that the
regularization in fuzzy nonlinear regression, in which it
proposed models completely overcome all traditional
can be so more value to the work.
algorithms and make much more accurate prediction.
References [1] Zafra, A., Ventura, S. (2012) Multi-instance genetic
R² = 0.9075
10
programming for predicting student performance in web
8
ReliefF Based
6 4
based educational environments. Applied Soft Computing. 12(8): 2693–2706. [2] Mostow, J., Beck. ,J. (2006) Some useful tactics to modify,
Linear (ReliefF Based)
2 0 0
5
map and mine data from intelligent tutors. Natural Language Engineering, 12(2): 195-208. [3] Minnaert, A., Janssen, P. (1999) The additive effect of
10
regulatory activities on top of intelligence in relation to academic performance in higher education. Learning and
Fig. 5 Prediction accuracy of ReliefF-based algorithm
Instruction, 9, pp. 77–91. [4] Busato, V., Prins, F., Elshout, J., Hamaker, C. (2000)
Table 2 Results obtained using our proposals
Algorithms
Accuracy
Intellectual ability, learning style, personality, achievement motivation and academic success of psychology students in
RMSE
Fuzzy non-parametric regression
0.9940
0.0031
ReliefF-based
0.9075
0.6236
higher education. Personality and Individual Differences, 29, pp. 1057–1068. [5] Delavari, N., Phon-amnuaisuk, S., Beikzadeh, M.R. (2008) Data Mining Application in Higher Learning Institutions. Informatics in Education. 1(7): 31–54.
7. Conclusion and future work
[6] Luan, J., Zhao, C.M. ,Hayek, J. (2004) Use data mining
To achieve more accuracy in prediction process in
techniques to
educational environments, two new proposals based on
develop
institutional
typologies
for
NSSE. National Survey of Student Engagement.
statistical approach were presented. First we introduced a
[7] Zafra, A., Ventura, S. (2010) Web Usage Mining for
novel approach based on fuzzy non-parametric regression
Improving Students Performance in Learning Management
by integrating ridge-type regularization in the Lagrangian
Systems. 6098, pp. 439-449.
dual space and using Gaussian kernel as well as smoothing
[8] Chanchary, F.H., Haque, I., Khalid, M.S. (2008) Web Usage
parameter, all together to fit the presented model. Second
Mining to Evaluate the Transfer of Learning in a Web-based
we integrate ReliefF weighting algorithm as a weighting
Learning Environment. Knowledge Discovery and Data
vector
Mining. WKDD 2008. pp. 249–253.
in
the
proposed
algorithm.
Computational
experiments show that when the problem is regarded as fuzzy
non-parametric
regression
or
[9] Fausett, L., Elwasif, W. (1994) Predicting Performance from
ReliefF-based
Test Scores using Backpropagation and Counterpropagation.
algorithm, performance is significantly better and the
IEEE Congress on Computational Intelligence, pp. 3398–
weakness of all other traditional proposed algorithms is
3402.
overcome.
[10] Martnínez, D. (2001) Predicting student outcomes using
Although the results are so interesting, there are still
discriminant function analysis. In: Annual Meeting of the
quite a few considerations that could surely add even more
Research and Planning Group, California, USA. pp. 163–
value to results obtained. As considered later this study is
173.
concentrated only on crisp inputs such as online students’
[11] Minaei-Bidgoli, B., Punch, W. (2003) Using genetic
quizzes marks, to predict final grades, so it would be
algorithms for data mining optimization in an educational
interesting to design a method to apply desirable
50 Copyright (c) 2014 Advances in Computer Science: an International Journal. All Rights Reserved.
ACSIJ Advances in Computer Science: an International Journal, Vol. 3, Issue 2, No.8 , March 2014 ISSN : 2322-5157 www.ACSIJ.org [25] S. A. Diwani and A. Sam, “Data Mining Awareness and
web-based system. Genetic and Evolutionary Computation,
Readiness in Healthcare Sector : a case of Tanzania,” ACSIJ
2, pp. 2252–2263.
Adv. Comput. Sci. an Int. J., vol. 3, no. 1, pp. 37–43, 2014.
[12] Kotsiantis, S., Pintelas, P. (2005) Predicting students marks in Hellenic open university. In ICALT’05: The fifth international conference on advanced learning technologies. Kaohsiung, Taiwan, pp. 664–668. [13] Romero, C., Espejo, P.G., Zafra, A., Romero, J.R., Ventura, S. (2010) Web Usage Mining for Predicting Final Marks of Students That Use Moodle Courses. Computer Applications in Engineering Education. 1(21): pp. 1–12. [14] Zafra, A., Romero, C., Ventura, S. (2011) Multiple instance learning for classifying students in learning management systems. Expert Systems with Applications. 12(38): pp. 15020–15031. [15] Romero, C., Ventura, S. (2010) Educational data mining: A review of the state-of-the-art. IEEE Transaction on Systems, Man and Cybernetics Applications and Reviews. 40(6): 610– 618. [16] H. Tanaka, H. Ishibuchi, Identification of possibilistic linear systems by quadratic membership functions of fuzzy parameters (1991) Fuzzy Sets and Systems 2(41): pp. 145160. [17] C.B. Cheng, E.S. Lee (2001) Fuzzy regression with radial basis function networks. Fuzzy Sets and Systems 2(16): pp. 291–301. [18] P. Diamond, Fuzzy least squares (1988). Inform. Sci. 3(46): pp. 141–157. [19] Kim B, Bishu R. R. (1998) Evaluation of fuzzy linear regression models by comparing membership functions. Fuzzy sets and systems, 100, 343 – 352. [20] J. Fan, I. Gijbels (1996) Local Polynomial Modeling and Its Applications, Chapman & Hall, London. [21] J. D. Hart (1997) Nonparametric Smoothing and Lack-of-fit Tests, Springer-Verlag, New York. [22] D. H. Hong, C. Hwang, C. Ahn (2004) Ridge estimation for regression models with crisp inputs and Gaussian fuzzy output. Fuzzy Sets and Systems, 142, 307-319. [23] Robnik M.S., Kononenko I. (2003) Theoretical and Empirical Analysis of ReliefF and RReliefF. Machine Learning Journal. pp. 23-69. [24] Zafra A., Romero C., Ventura S. (2011) Multiple instance learning for classifying students in learning management systems. Expert Systems with Applications. 12(38), pp. 15020–15031
51 Copyright (c) 2014 Advances in Computer Science: an International Journal. All Rights Reserved.