given multimedia contents in pre-defined rating scales. In addition, brain ..... [3] H.-C. O. Li, J. Seo, K. Kham, and S. Lee, âMeasurement of 3D visual fatigue using ...
PREDICTING SUBJECTIVE SENSATION OF REALITY DURING MULTIMEDIA CONSUMPTION BASED ON EEG AND PERIPHERAL PHYSIOLOGICAL SIGNALS Eleni Kroupi1 , Philippe Hanhart1 , Jong-Seok Lee2∗ , Martin Rerabek1 , and Touradj Ebrahimi1 1
Multimedia Signal Processing Group (MMSPG) ´ Ecole Polytechnique F´ed´erale de Lausanne (EPFL) EPFL/STI/IEL/GR-EB, Station 11, CH-1015 Lausanne, Switzerland 2
School of Integrated Technology Yonsei University 162-1 Songdo-dong, Yeonsu-gu, 406-840 Incheon, Republic of Korea ABSTRACT Sensation of reality refers to the ability of users to feel present in a multimedia experience. As 3D technologies target to provide more immersive and higher quality multimedia experiences, it is important to understand Quality of Experience (QoE) and sensation of reality. Recently, there have been efforts to measure brain activity in order to understand implicitly QoE for various multimedia contents. However, brain activity accounting for sensation of reality has not been adequately investigated. The goal of this paper is twofold. First, we investigate how various aspects, such as perceived quality, perceived depth, and content preference affect subjective sensation of reality through explicit subjective ratings. Second, we construct subjective classification systems to predict sensation of reality from multimedia experiences based on electroencephalography (EEG) and peripheral physiological signals such as heart rate and respiration. Index Terms— EEG, heart rate, classification, sensation of reality 1. INTRODUCTION Sensation of reality in digitally created virtual environments refers to subjective sensation of being present in these environments. 3D image and video are representative multimedia technologies that can enhance sensation of reality. Adding the depth dimension to the traditional 2D imaging technologies enables users to feel like watching the real-world in 3D visual scenes. ∗ Refers to the corresponding author. The research leading to these results has been performed in the framework of Swiss National Foundation for Scientific Research (FN 200020149259-1, FN IZK0Z2-150904, and FN 200020-143696-1) and the Basic Science Research Program through the National Research Foundation of Korea funded by the Ministry of Science, ICT and Future Planning, Korea (2013R1A1A1007822).
As 3D technologies target to enhance multimedia experiences, it is important to understand perceived Quality of Experience (QoE). Subjective quality assessment has been popularly used for this purpose. In particular, human subjects are hired and asked to explicitly rate the perceived quality of given multimedia contents in pre-defined rating scales. In addition, brain and peripheral physiological activities provide an implicit channel to understanding QoE from immersive multimedia. Brain-computer interfaces (BCI) have recently received great attention as a more natural and convenient way to monitor user-specific responses to given multimedia contents from non-verbal cues (e.g., [1]). Once accurate implicit BCI-based QoE recognition systems are constructed, no overt response (i.e., explicit rating) will be required, facilitating real-time monitoring of QoE without biases that may be involved in explicit ratings. Recently, there have been efforts to measure brain activity in order to understand QoE in various multimedia contents. In [2], it was demonstrated that abrupt changes in 2D visual quality give rise to specific components in the electroencephalogram (EEG), which has potential to be used for implicit subjective quality assessment. In the field of 3D image/video, researchers attempted to detect fatigue caused by 3D visual media based on EEG. The study in [3] showed that the power of the high frequency bands and the change of the P700 component are strong candidates for measuring 3D visual fatigue. In [4], it was shown that 3D visual fatigue is linked to human cortical activities measured by fMRI. These results show that monitoring neurological responses can provide hints for the perceived QoE. However, this topic is still in its infancy with many research questions unanswered. For instance, measuring sensation of reality based on EEG and peripheral physiological signals for 3D media has not been considered previously. Also, most of the studies target to explore subject-independent patterns reflected in brain signals, although experiencing multimedia is a rather subjective phe-
nomenon. This paper presents a novel approach to predict sensation of reality in a subjective way, based on EEG and peripheral physiological signals. We conduct extensive experiments to acquire both explicit subjective ratings and implicit physiological responses while 2D and 3D visual stimuli are shown. The acquired data are analyzed in two ways. First, we study influences of different aspects of media experience on the sensation of reality by analyzing the explicit subjective ratings. In particular, considered aspects include rendering mode (i.e., 2D or 3D), objective quality, content, perceived quality, perceived depth, and content preference. Second, we construct subjective classification systems that predict sensation of reality based on the recorded EEG and peripheral physiological signals, such as heart rate and respiration. The performance of the two modalities (EEG and peripheral signals) for prediction is presented and compared.
2. DATA COLLECTION 2.1. Participants Sixteen subjects (5 females, 11 males) took part in our experiments. They were between 19 and 30 years old with an average of 23.8 years of age. All subjects were screened for correct visual acuity (no errors on 20/30 line), color vision and stereo vision using the Snellen, Ishiara and Randot charts, respectively. They all provided written consent forms. Before each experiment, a training session was organized to allow participants to familiarize with the assessment procedure. The content shown in the training session was selected by experts in order to include 2D and 3D examples of various quality levels. 2.2. Video stimuli The dataset was composed of eight video contents: one for the training and seven for the tests. All contents were shot during a music festival, with two RED SCARLET-X mounted on a Genus Hurricane Rig. All video sequences were recorded in REDCODE RAW (R3D) format, DCI 4K resolution (4096 × 2160 pixels), at 25 fps, and had a duration of about one minute long. Stereo audio was recorded in PCM format, sampled at 48 kHz, 24 bits. Table 1 describes the contents and their characteristics. The recorded video sequences were cropped and downsampled to Full HD resolution (1920 × 1080 pixels) and then compressed with H.264/MPEG-4 AVC. Two different quantization parameters (QP) were selected: QP=2 for high quality (HQ) and QP=35 for low quality (LQ). For each content, four different versions were considered: 2D HQ, 3D HQ, 2D LQ, and 3D LQ, leading to a total of 28 video sequences, 14 of which in 2D and 14 in 3D.
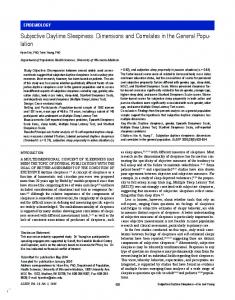
2.3. Monitor, sound system and environment To display the video stimuli, a HD 46” Hyundai S465D polarized stereoscopic monitor was used. The laboratory setup was controlled in order to ensure the reproducibility of results by avoiding involuntary influence of external factors. The test room was equipped with a controlled lighting system with a 6500K color temperature and an ambient luminance at 15% of the maximum screen luminance. For the audio playback, the PSI A14-M professional studio full range speakers were used. 2.4. Physiological signal acquisition The EEG was recorded from 256 electrodes placed at the standard positions on the scalp. An EGI’s Geodesic EEG System (GES) 300 was used to record, amplify, and digitalize the EEG signals. Additionally, two standard electrocardiogram (ECG) leads were used and placed on the lower left ribcage and on the upper right clavicle, as well as two respiratory inductive plethysmography belts (thoracic and abdomen). All signals were recorded at 250 Hz. 2.5. Experimental protocol The participants were seated at a distance of 3.2 times the picture height, corresponding to roughly 1.8 meters from the stereoscopic monitor, as suggested in [5]. All video sequences were viewed with 3D glasses. Experiments were conducted in three sessions. A fifteen-minute break was provided between two sessions, in order to avoid subjects’ fatigue. Nine video sequences were presented in the first and second sessions, and ten in the last one, leading to a total of 28 video sequences, and thus, to a total of 28 trials. Each trial consisted of a ten-second baseline period and a stimulus period. The biosignals recorded during the baseline period were used to remove stimulus-unrelated variations from the signals obtained during the stimulus period. During the baseline period, the subjects were instructed to remain calm and focus on a 2D white cross on a black background presented on the screen in front of them. Once this baseline period was over, a video sequence was randomly selected and presented. After the video sequence was over, the subjects were asked to provide their self-assessed ratings for the particular video sequence without any restriction in time, following the Absolute Category Rating (ACR) evaluation methodology [6]. An example of a trial is shown in Figure 1. Once a trial was over, the next baseline period was recorded and the next video sequence was randomly selected, presented and rated. The procedure was repeated until all 28 video sequences were presented and rated. Regarding the self-assessed ratings, subjects were asked to evaluate the video sequences in terms of four different aspects, namely perceived overall quality, content preference,
Table 1. Characteristics of the multimedia contents used in our experiments. Content Description and characteristics Training Jazz Rock Stage Speech1 Speech2 Outdoor Interview
Rock band playing. Dark. Bright spots. Shot from the back of the auditorium. Jazz band playing . Wide shot. Rock band playing. Dark. Bright spots. Shot from the back of the auditorium. General manager on stage introducing the next artist. Very dark. Wide shot. General manager giving a speech at the Opening Party. Mid shot. Speech at the Opening Party. Mid shot. Crowd walking on the street near the lake. Lot of depth. Wide shot. Interview of an artist. Medium close up.
Fig. 1. Example of a trial sensation of reality, and perceived depth quantity. Two different rating scales were used for each aspect, a 9-point and a 3-point scale. The 9-point rating scale ranged from 1 to 9, with 1 representing the lowest value, and 9 the highest value of each aspect. In particular, the two extremes (1 and 9) correspond to “low” and “high” for perceived overall quality and content preference, “no presence” and “very strong presence” for sensation of reality, and “no depth” and “a lot of depth” for perceived depth quantity. Regarding the 3-point rating scales, the choices were {“do not like it”, “neutral”, “like it”} for perceived overall quality and content preference, {“low presence”, “middle presence”, “high presence”} for sensation of reality, and {“low depth”, “middle depth”, “high depth”} for perceived depth quantity. The 3-point scale was intended to be used for classification purposes.
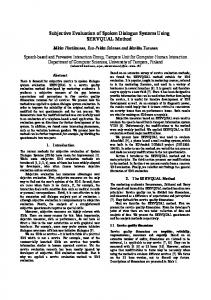
Fig. 2. Cumulative histogram per subject: sensation of reality.
3. ANALYSIS In this section, the analysis on the subjective ratings is elaborated. Then, the biosignal processing is detailed, as well as the classification scheme to automatically distinguish between low and high sensation of reality in a subjective way. 3.1. Subjective rating analysis To detect and remove subjects whose ratings appear to deviate significantly from others, outlier detection was performed according to the guidelines described in Section 2.3.1 of Annex 2 of [7]. During the training session, examples of the lowest and highest quality levels were shown, in order to guide subjects to bound their own perceived overall quality
Fig. 3. Mean opinion scores: sensation of reality.
ratings in a similar way. Since quality was the only factor in which subjects could be trained, the outlier detection was performed only on the perceived overall quality ratings. No outliers were detected, thus, for the subjective ratings analysis all sixteen subjects were included. Figure 2 presents the cumulative histogram per subject using the 3-point scale on sensation of reality. Obviously, sensation of reality from multimedia is very subjective, as indicated by the fact that the ratio of “low presence”, “middle presence”, and “high presence” values varies across subjects. The mean opinion score (MOS) and associated 95% confidence interval (CI) were computed for each test stimulus, assuming a Student’s t-distribution on the subjective ratings, to represent explicit estimates of perceived reality. Figure 3 shows the resulting MOS and CI for the sensation of reality using the 9-point rating scale. As it can be observed, 3D sequences generally obtained higher ratings for sensation of reality than their corresponding 2D versions. Similarly, high quality sequences generally obtained higher ratings for sensation of reality than their corresponding low quality versions. As content Stage is very dark, the perceived 3D effect was not very strong and the overall quality was rated lower, resulting in lower sensation of reality. To investigate quantitatively whether the objective factors, such as the rendering mode, actual quality level, and content, have a significant influence on sensation of reality, an ANOVA analysis was performed on the subjective ratings. In particular, the null hypothesis was that the rendering mode, quality level, and content do not influence sensation of reality. The null hypothesis was rejected for all cases, p < 0.005, indicating that the effects of the rendering mode, actual quality level, and content on sensation of reality were significant. However, the interactions among these three different factors were not significant, p > 0.3. Also, to understand the impact of the perceptual factors, such as perceived depth quantity, content preference, and perceived overall quality, on sensation of reality, the correlation between the MOS of each pair of all four factors was measured using the Pearson correlation coefficient. Table 2 reports the estimated correlation coefficients. Results show that there is a strong correlation between sensation of reality and perceived depth quantity (ρ > 0.88), as well as between sensation of reality and perceived overall quality (ρ > 0.73). However, the correlation between perceived overall quality and perceived depth quantity is relatively low (ρ = 0.42), but statistically different from zero, p = 0.03. Since the correlation between sensation of reality and perceived depth quantity, as well as between sensation of reality and perceived overall quality, is strong, it is rational that the correlation between perceived overall quality and perceived depth quantity is also different from zero, due to the transitivity property. The correlation between sensation of reality and content preference is very low (ρ < 0.3) and not statistically different from zero, p = 0.12.
Table 2. Pearson correlation coefficients between the ratings of different perceptual aspects. Content Sensation Depth preference of reality quantity Overall 0.3392 0.7308 0.4172 quality Content 0.3017 0.1527 preference Sensation 0.8835 of reality
Overall, the results from the ANOVA analysis revealed that content has an impact on sensation of reality. However, the results from the correlation analysis revealed that content preference does not influence perceived reality. These findings indicate that sensation of reality is influenced by content per se, but not by content preference. 3.2. Physiological signal analysis For the purpose of classification, only the two extreme classes of the 3-point scale (“Low presence” and “High presence”) were used to predict sensation of reality in a subjective way. Subjects 1, 8, 12, and 15 were not taken into account, because they provided at most two values for one of the two classes (see Figure 2), making the training and testing of a binary classifier impossible. 3.2.1. Biosignal pre-processing EEG electrodes in which muscle activity was discernible were rejected manually, leading to a total 216 electrodes for processing and analysis. EEG signals were filtered between 3-47 Hz using a third order Butterworth filter, in order to remove electrooculogram (EOG) and electromyogram (EMG) artifacts. Remaining artifacts were removed by cubic interpolation. All signals were visually inspected to make sure they did not contain further artifacts. EEG signals were initially referenced to the Cz electrode and re-referenced to the common average. ECG signals were used to extract the heart rate variability (HRV), which reflects the sympathetic/parasympathetic modulation. HRV is the physiological measurement of variation in the time interval between consecutive heart beats. In order to extract the HRV, the interval between two QRS complexes defined as R-R interval (tR−R ) was estimated using the realtime algorithm developed by Pan and Tompkins [8]. Then the heart rate (HR, in beats per minute) was estimated as: HR =
60 tR−R
.
(1)
The HRV is the variation of HR over time. As the HR is a time-series of nonuniform R-R intervals, the HR was regu-
larly resampled at 4 Hz rate. Then, the respiration drift was removed using a morphological operator. Both respiratory signals (abdomen and thoracic) were filtered by a second-order Butterworth bandpass filter with cutoff frequencies at the range of 0.1-1 Hz. Only the last 45 seconds of all signals were used in our analyses, considering that inducing sensation of reality may take some time. 3.2.2. Feature extraction Regarding the EEG signals, the frequency power of the signals was extracted for frequencies between 4 and 47 Hz, using the Welch’s method with windows of 128 samples. The mean trial power was then divided by the mean baseline power, in order to extract the power changes without considering the pre-stimulus period. These power changes were captured for different frequency bands, namely theta band (4-7 Hz), alpha band (8-13 Hz), beta band (14-29 Hz) and gamma band (30-47 Hz). Apart from the power division, a novel distance metric between trial and baseline power is also used as a feature, namely the Wasserstein distance [9]. This metric is less sensitive to the location of the frequency peaks, but provides, instead, information about the global structure of the frequency domain. Physiological signals of living organisms appear to vary over time in a complex manner. These temporal variations result from intrinsic disturbances and actions, such as the activity of an organism. In physiological signals these fluctuations are non-periodic. In the current study, the Normalized Length Density (NLD) [10] index is extracted in order to capture the self-similarities of the EEG, HRV and respiration signals during reality perception processes. Regarding the peripheral signals, mean, standard deviation, and mean absolute values of the first and second derivatives were extracted for both HRV and respiration [11]. Regarding the frequency domain, the power of the Very Low Frequency (VLF, 0.0033-0.04 Hz), the Low Frequency (LF, 0.04-0.15 Hz), High Frequency (HF, 0.15-0.4 Hz), and the LF/HF ratio were extracted from HRV [12]. Finally, the power of three different bands was extracted from the respiration signals (0.1-0.2 Hz, 0.2-0.3 Hz, and 0.3-0.4 Hz). 3.2.3. Classification A Support Vector Machine (SVM) classifier with radial basis function (RBF) kernel was trained for each subject, and was used to predict high and low sensation of reality, in a within-subject classification scheme. The RBF kernel was used due to the fact that this kernel considers the possible nonlinear relationships between class labels and features. The LIBSVM package was used for this study [13]. The parameters of the classifier, as well as the most relevant features, were optimized for each trial, using a grid search in a leave-
one-trial-out cross-validation scheme [13]. Fisher’s linear discriminant, which is defined as J(f ) =
|µ1 − µ2 | , σ12 + σ22
(2)
was used to estimate the most significant features. In eq. (2), µ and σ are the mean and standard deviation for each feature f , respectively. The training and testing of the classifier were also carried out in a leave-one-trial-out cross-validation scheme. For subjects with highly unbalanced classes (e.g., subjects 4, 10, 16, 18, and 19), the Smote algorithm (Synthetic Minority Over-sampling Technique, [14]) was implemented and applied to the feature space, in order to generate more data for the minority class. According to the Smote, synthetic samples are estimated as the difference between each feature vector under consideration and its nearest neighbor. The estimated value is then multiplied by a random number in (0, 1), and added to the value of the feature vector. To evaluate the performance of the classifiers, the Matthews Correlation Coefficient (MCC) and the F1-score were estimated. The MCC was selected as a measure of performance of a binary classifier. It takes into account true and false positives and negatives, and is considered as an accurate metric of performance of a classifier with unbalanced classes [15]. It is defined as M CC = =
√
T P ×T N −F P ×F N , (T P +F P )(T P +F N )(T N +F P )(T N +F N )
(3)
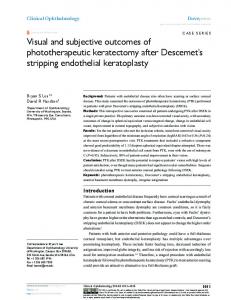
where TP, FP, TN, and FN refer to True Positives, False Positives, True Negatives, and False Negatives, respectively. F1-score is a combination of precision and recall, thus provides information only about the positive class [15]. Usually the minority class corresponds to the positive class, thus F1-score assesses the performance of the minority class. 3.2.4. Results Figures 4(a)-4(b) present the MCC and the F1-score, respectively, both for the EEG and for the Peripheral signals. Regarding the EEG signals, the MCC is higher than random for all subjects, except for subject 6. The mean MCC across subjects is significantly higher than random for the EEG signals (mean M CC = 0.65, p < 0.001), indicating that EEGbased classification is possible and can be used to automatically recognize sensation of reality, in a within-subject classification framework. Regarding the peripheral signals, classifying automatically sensation of reality is also possible for the majority of the subjects (for 7 subjects out of 12), with mean M CC = 0.16 that is again statistically significant from random (p < 0.05). However, as expected, classifying sensation of reality through EEG signals yields an overall significantly better performance (p < 0.01) than through peripheral signals.
1
0.2
uates sensation of reality. Regarding the classification analysis, it was demonstrated that EEG-based classification is possible and can be used to automatically recognize high from low sensation of reality, in a subjective framework. Finally, classification of sensation of reality from HR and respiration was also possible, but less accurate than using EEG signals.
0
5. REFERENCES
0.8 0.6
MCC
0.4
-0.2
[1] S. Koelstra, C. M¨uhl, M. Soleymani, J.S. Lee, A. Yazdani, T. Ebrahimi, T. Pun, A. Nijholt, and I. Patras, “DEAP: A database for emotion analysis; using physiological signals,” Affective Computing, IEEE Transactions on, vol. 3, no. 1, pp. 18–31, 2012.
-0.4 EEG Periph Random Mean EEG Mean Periph
-0.6 -0.8 -1
2
3
4
5
6
7
9
10 11
13 14 16
Subjects
[3] H.-C. O. Li, J. Seo, K. Kham, and S. Lee, “Measurement of 3D visual fatigue using event-related potential (ERP): 3D oddball paradigm,” in Proc. 3DTV Conf., Istanbul, Turkey, 2008, pp. 213–216.
(a)
1
[4] D. Kim, Y. J. Jung, E. Kim, Y. M. Ro, and H. W. Park, “Human brain response to visual fatigue caused by stereoscopic depth perception,” in Proc. Int. Conf. Digital Signal Processing, Corfu, Greece, 2011, pp. 1–5.
0.9 0.8
[5] ITU-R BT.2021, “Subjective methods for the assessment of stereoscopic 3dtv systems,” International Telecommunication Union, August 2012.
0.7
F1
0.6
[6] ITU-T P.910, “Subjective video quality assessment methods for multimedia applications,” International Telecommunication Union, April 2008.
0.5 0.4
[7] ITU-R BT.500-13, “Methodology for the subjective assessment of the quality of television pictures,” International Telecommunication Union, January 2012.
0.3 0.2
[8] J. Pan and W. J Tompkins, “A real-time QRS detection algorithm,” IEEE Trans. Biomedical Engineering, , no. 3, pp. 230–236, 1985.
0.1 0
[2] S. Scholler, S. Bosse, M. S. Treder, B. Blankertz, G. Curio, K.-R. M¨uller, and T. Wiegand, “Toward a direct measure of video quality perception using EEG,” IEEE Trans. Image Process., vol. 21, no. 5, pp. 2619–2629, 2012.
2
3
4
5
6
7
9
10 11
13 14 16
Subjects (b)
Fig. 4. (a) MCC and (b) F1-score for EEG and peripheral physiological signals for each subject.
[9] L. Oudre, J. Jakubowicz, P. Bianchi, and C. Simon, “Classification of periodic activities using the Wasserstein distance,” IEEE Trans. Biomedical Engineering, vol. 59, no. 6, pp. 1610–1619, 2012. [10] A. Kalauzi, T. Bojic, and L. Rakic, “Extracting complexity waveforms from one-dimensional signals,” Nonlinear Biomedical Physics, vol. 3, no. 8, 2009. [11] R. W. Picard, E. Vyzas, and J. Healey, “Toward machine emotional intelligence: Analysis of affective physiological state,” IEEE Trans. Pattern Anal. and Mach. Intell., vol. 23, no. 10, pp. 1175–1191, 2001. [12] K. C Bilchick and R. D Berger, “Heart rate variability,” Journal of Cardiovascular Electrophysiology, vol. 17, no. 6, pp. 691–694, 2006.
4. CONCLUSION In this paper we analysed the results of our experiments in which 2D and 3D sequences of various quality levels were presented to human subjects, while their subjective ratings on various aspects were captured, and their EEG, ECG and respiration signals were recorded. Regarding the analysis on the subjective ratings, this study revealed that actual quality level, rendering mode (i.e., 2D or 3D), and content influence sensation of reality. Moreover, it was shown that perceived overall quality and perceived depth quantity also influence sensation of reality, indicating that 3D enhances whereas sensation of reality whereas quality degradation due to compression atten-
[13] C.-C. Chang and C.-J. Lin, “LIBSVM: a library for support vector machines,” ACM Trans. Intelligent Systems and Technology, vol. 2, no. 3, pp. 27:1–27, 2011. [14] N. V. Chawla, K. W. Bowyer, L. O. Hall, and W. P. Kegelmeyer, “SMOTE: synthetic minority over-sampling technique,” Journal of Artificial Intelligence Research, vol. 16, no. 1, pp. 321–357, 2002. [15] D. M. W Powers, “Evaluation: From precision, recall and f-measure to ROC, informedness, markedness & correlation,” Journal of Machine Learning Technologies, vol. 2, no. 1, pp. 37–63, 2011.