DOI: 10.1016/j.colsurfa.2018.08.052 Download the final version for free until October 27th 2018 https://authors.elsevier.com/a/1XhNz3IywU7lZb
PREDICTING THE ADHESION STRENGTH OF THERMOPLASTIC/GLASS INTERFACES FROM WETTING MEASUREMENTS C.A. Fuentesa*, Y. Zhanga,b, H. Guoa, W. Woigkc,d, K. Masaniac,d, C. Dransfeldc, J. De Coninckb, C. Dupont-Gillaine, D. Sevenoa, A.W. Van Vuurea a
Department of Materials Engineering, KU Leuven, Leuven, Belgium Laboratory of Surface and Interfacial Physics, Université de Mons, Mons, Belgium c Institute of Polymer Engineering, FHNW University of Applied Sciences and Arts Northwestern Switzerland, Windisch, Switzerland d Complex Materials, Department of Materials, ETH Zürich, Zürich, Switzerland e Institute of Condensed Matter and Nanosciences, Université Catholique de Louvain, Louvain-laNeuve, Belgium *
[email protected] b
Abstract To evaluate compatibility between a substrate and a thermoplastic polymer, the established methodology is to estimate their surface composition in terms of surface energy components, utilizing the results of contact angle measurements of probe liquids onto substrate and polymer surfaces at room temperature. Using this methodology, polymer surfaces are studied in solid state, however, during spreading of polymers on a substrate, polymers are in molten state and at high temperature, having different surface energies and more complex polymer/substrate interactions due to polymer chain mobility. This paper presents a model study with practical relevance to predict polymer/substrate compatibility including contact angle measurements at high temperature directly performed between molten thermoplastics; polypropylene (PP), polyvinylidene fluoride (PVDF) and maleic anhydride-grafted polypropylene (MAPP), on smooth glass fibres and plates. The values of total surface energy of thermoplastics at high temperature (260°C) are down to 57% of that measured at room temperature, which has a strong influence on the wetting prediction. Surface energies of both the polymer and the substrate were found not to be the only factor controlling the wetting behaviour of molten polymers and the level of adhesion with the substrate, but also some intrinsic characteristics of the polymer melt play a role. We also observed that the wetting behaviour of molten MAPP is affected by the maleic anhydride (MA) content, demonstrating dramatically different results to room temperature measurements, which is suspected to be due to the formation of covalent bonds of MA groups with the glass surface enhancing the interface strength beyond the shear strength of MAPP.
Interface/interphase; Wettability; Surface analysis; Glass 1
DOI: 10.1016/j.colsurfa.2018.08.052 1. INTRODUCTION How an interface is formed at high temperature between molten thermoplastics and hot substrate surfaces are yet to be studied in detail. Although the mechanical behaviour of the interface depends on the properties of both the substrate and the polymer, e.g. thermal expansion coefficients, strength, degree of crystallization, to name a few [1, 2], the final adhesion strength of the substrate/polymer interface is highly dependent on their physical and chemical interactions. As the load distribution efficiency at the interface is determined by the degree of adhesion between the components [3, 4], the polymer/substrate interface becomes an important design consideration in many structures that use adhesive bonding, such as fibre reinforced composites. A strong substrate/polymer adhesion is obtained through interfacial interactions, including mechanical interlocking, chemical bonding, such as covalent bonds, and physical mechanisms of adhesion, i.e. Van der Waals interaction, dipole interactions or hydrogen bonds [5-7]. If the molten polymer is not able to fill irregularities at the substrate surface, the area of contact between the substrate and the polymer melt will be reduced, producing in turn, a reduction in adhesion. On the other hand, if the polymer melt can fully wet the rough surface, mechanical interlocking and increased contact area will lead to increased adhesion [8, 9]. Chemical adhesion also depends on the degree of wetting that provides intimate contact between both phases. Covalent bonds (further referred to as chemical bonds) can be formed across the interface when atoms at the fibre surface share electrons with polymer atoms, producing bonds with very high strength. Regularly, chemical modification of both the substrate surface and the polymer are used to promote covalent bonding at the interface by chemical reactions [10-13]. Techniques as X-ray Photoelectron Spectroscopy (XPS), Time-of-Flight Secondary Ion Mass Spectrometry (ToF-SIMS) and Fourier transform infrared spectroscopy-attenuated total reflectance (FTIR-ATR) are typically used to identify chemical groups at the substrate surface to evaluate the effects of chemical reaction [10, 14, 15]. The substrate surface is also able to interact with the matrix without undergoing covalent bonding. These interactions arise from physical forces and predominantly control the wettability and physical adhesion of the liquid polymer on the substrate surface [16]. The study of physical interactions is crucial for obtaining a better interface, since the other mechanisms of adhesion depend on a good physical interaction. Chemical bonding forces occur over very small distances of typically 0.1 to 0.2 nm so that the chemical groups present at the substrate surface and the reactive groups of the polymer need to be brought very close together. Therefore, the polymer must spread 2
DOI: 10.1016/j.colsurfa.2018.08.052 on the substrate, penetrating the surface irregularities [5, 6, 8, 9] for the intimacy of contact needed for chemical bonding. The common procedure to evaluate these physical interactions is to estimate the substrate and polymer composition in terms of surface energy components, utilizing the results of contact angle measurements of probe liquids on both the substrate and the polymer in solid state at room temperature [4, 7, 14, 17]. The direct imaging of drop profiles and the Wilhelmy balance method are currently the two principal methods used to measure contact angles [18, 19]. However, the wetting analysis with probe liquids characterizes polymer and substrate surfaces in solid state, whereas during spreading, polymers are in molten state and substrates at high temperature. Thus, both materials potentially have different surface energies than at room temperature, and more complex polymer/substrate interactions may occur. After spreading and cooling down, the surface properties, in solid state, should eventually control the interfacial mechanical properties, while surface energies of both the polymer and the substrate at high temperature should control the wetting behaviour of molten polymers. This is especially relevant for cases where physical adhesion is dominant, which is usually the case for thermoplastic polymers. In this study, contact angles of molten polyvinylidene fluoride (PVDF), polypropylene (PP) and molten maleic anhydride-grafted polypropylene (MAPP), with different maleic anhydride contents, on smooth glass fibres and smooth glass plates, were measured as a direct indication of the level of adhesion that could potentially be obtained. These values were then contrasted with the conventional analysis based on i) measuring contact angles with different reference probe liquids using the Wilhelmy technique on solid polymer films and substrates, and ii) by applying the acid-base theory for calculating the surface energy components. The thermoplastic polymers were selected as model systems for the investigation of the polymer/glass interphase, based on the difference of surface energies between PP and PVDF and the effect of chemical bonding between PP and MAPP. In this way, physical and chemical adhesion were studied independently to systematically investigate the influence of both adhesion mechanisms on the adhesion strength of a polymer/glass interface. The total surface energies of the molten thermoplastics were determined by the pendant drop method and the interface composition was analysed by FTIR spectroscopy. Finally, to correlate the real strength of the interfaces with the theoretical work of adhesion, the polymer/glass interphase bond strength was characterised by performing single fibre pull-out tests. 2. METHODOLOGY
3
DOI: 10.1016/j.colsurfa.2018.08.052 In this study, soda-lime silicate glass slides and optical glass fibres with similar surface composition were selected as substrates. Slides were used to study the wetting process of molten polymer drops on a glass flat surface, while fibres were used to estimate the practical adhesion using pull-out tests. By assuring that both substrates have a similar surface chemical composition, and by a consistent cleaning of both substrate surfaces, it could be guaranteed that the same surface chemistry was used for all the samples. 2.1 Materials Glass slides were commercial soda-lime silicate glass (Sigma-Aldrich) of typical bulk composition 73% SiO2, 14% Na2O, 9% CaO, 4% MgO and some other minor components. The glass slide was cut into 5 mm x 5 mm x 2 mm for this study. Glass fibres (diameter: 200 µm) were obtained from the core of FR200UMT Thorlabs optical fibre (the cladding layer was removed using hot sulphuric acid, see section 2.2 for more details) with a bulk composition of ≥99% SiO2 and some other minor components. The surface compositions, governing the wettability of a glass surface, were verified by XPS. The presence of OH groups on the glass surface which is related to the silicon concentration at the surface [20] was of particular interest. Polypropylene (PP) 515A with a melt flow rate of 24 g/10 min (230°C/2.16 kg), and density of 0.905 g/cm³ was obtained from Sabic (Germany). 7% maleic anhydride grafted polypropylene (MAPP) Licocene 6452 with viscosity of 1100 mPa.s (170°C), and density of 0.93 g/cm³ was supplied by Clariant (Germany). Polyvinylidene fluoride (PVDF) Solef 1008 with a melt flow rate 8 g/10 min (230°C/2.16 kg), and a density of 1.78 g/cm³ was supplied by Solvay (Belgium). All polymers were received in the form of pellets. Pellets were converted into films using a hot press. For Wilhelmy contact angle measurements, films were conserved at room conditions (50% RH, 20 °C). Test liquids with analytical grade were used for contact angle measurements: ultrapure water (18.2 Ω cm resistivity), diiodomethane (≥99%, Acros), and ethylene glycol (≥99%, Sigma–Aldrich). 2.2 Sample preparation Only the silica core of the optical glass fibres was required, and thus the cladding layer was removed by submerging the fibres in hot sulphuric acid for 30 minutes. Then the fibre was submerged in piranha solution (a mixture of concentrated sulphuric acid and hydrogen peroxide) for another 30 minutes, see [7] for more details. Glass slides were submerged in hot sulphuric acid for 30 minutes in order to obtain a clean surface. Glass fibres and slides were stored in ultrapure water (resistivity > 18MΩ.cm) to avoid environmental contamination since both receding and advancing contact angles of water on cleaned fibres vary over time when exposed to the environment
4
DOI: 10.1016/j.colsurfa.2018.08.052 [7, 21]. Although a glass surface can also interact with water [22], a previous study showed that contact angles of water on glass remained stable on samples stored in ultrapure water for 48 hours while XPS analysis confirmed the reduction of surface contamination [7]. The roughness, R a , of cleaned glass fibres and slides was measured with a WYKO NT3300 profilometer. PP and MAPP were melt-blended using a twin-screw extruder (Leistritz, Germany). MAPP concentrations of 1, 2, 5, and 10 wt% were selected to provide a broad range of maleic anhydride contents. During the extrusion, the screw speed was set to 150 rpm, and the temperatures were set to 160 - 180°C from hopper to die. 2.3 Contact angle measurements Advancing and receding contact angles of various test liquids were measured on the polymer films and glass fibres at room temperature (20 °C) and relative humidity of 50% using a Krüss K100 SF tensiometer equipped for the Wilhelmy technique [14, 23]. The 3 liquids were selected show a low condition number value corresponding to a good combination of a dispersive, an acidic and a basic liquid, which reduces the influence on the number and choice of liquids [24]. The average of the cosines of the dynamic advancing (θadv ) and dynamic receding (θrec ) angles at a low contact-line velocity were used for the glass fibres to estimate the cosine of the equilibrium angle (θequ ) so that both the low and the high surface energy components of the analysed surfaces could be considered [25]. For the direct contact angle measurement of molten thermoplastics, the polymers were melted onto a glass slide surface inside a Ramé-Hart environmental chamber with controlled argon atmosphere to avoid degradation at 200, 220, and 240 °C. The temperature of the chamber was calibrated by monitoring the melting of pure Sn. The average value of 3 measurements was 231.6 ± 0.9 °C in excellent agreement with the expected value of 231.9 °C [26]. Although the volumes of the droplets were not constant, the drop base radii were kept shorter than the capillary length of each liquid polymer at the given temperature, thus capillary effects dominated the spreading dynamics. Frame by frame images of the entire droplet spreading process were analyzed by using the G-Droplet inhouse software, which calculates the contact angle applying the Young-Laplace equation on the complete droplet profile [27]. For measuring the contact angle of a molten polymer on a fibre, the fibre was gradually introduced into the molten polymer until a meniscus was formed, and its contour shape fit with the Young-Laplace equation using GFiber software [28]. 5
DOI: 10.1016/j.colsurfa.2018.08.052 2.4 Surface energy analysis Surface energy components were calculated according to the Van Oss model and by using the SurfTen 4.3 software [29]. The work of adhesion (Wa), the spreading coefficient (S), and the interfacial energy (𝛾𝑠𝑙 ) were calculated according to the following equations: 𝑊𝑎 = 𝛾𝑠 + 𝛾𝑙 − 𝛾𝑠𝑙 = 𝛾𝑙 (1 + cos 𝜃)
(1)
𝑆 = 𝛾𝑠 − (𝛾𝑙 + 𝛾𝑠𝑙 ) = 𝛾𝑙 ( cos 𝜃 − 1)
(2)
2
𝛾𝑠𝑙 = (√𝛾𝑠𝐿𝑊 − √𝛾𝑙𝐿𝑊 ) + 2 (√𝛾𝑠+ − √𝛾𝑙+ )(√𝛾𝑠− − √𝛾𝑙− )
(3)
𝐿𝑊 Where 𝛾𝑠,𝑙 represents the surface energy (solid and liquid respectively), 𝛾𝑠,𝑙 represents the Lifshitz-van + − der Waals component, 𝛾𝑠,𝑙 represents the acidic, and 𝛾𝑠,𝑙 the basic component.
2.5 Surface tension measurement from pendant drop An elevated temperature syringe in combination with the Ramé-hart environmental chamber (see section 2.3 and [26]) with controlled argon atmosphere was used to produce stable molten polymer axisymmetric drops, which were hanging from a metal needle inside the chamber at a given temperature (200, 220, and 240 °C). The shape of the drop was fit with the theoretical profile obtained according to the Young-Laplace equation by the Pendent_Drop software [30]. 2.6 Image acquisition Samples were imaged using a Motic SMZ-171-TH microscope and a 3664x2748 pixel Moticam camera (Motic Deutschland GmbH, Wetzlar, DE) using a one second picture interval with an exposure of 700 ms. The resolution of the imaged surface was 0.213 μm/pixel for the contact angle measurements and 0.134 μm/pixel for the pendant drop method. 2.7 XPS XPS analyses were performed on a Kratos Axis Ultra spectrometer (Kratos Analytical – Manchester – UK) equipped with a monochromatized aluminium X-ray source (powered at 10 mA and 15 kV). Analyses were performed in the hybrid lens mode with the slot aperture and the iris drive position set at 0.5, the resulting analysed area was 700 μm × 300 μm. More information regarding the XPS analysis procedure can be found in a previous publication [23]. 2.8 FTIR-ATR The FTIR-ATR spectra were obtained from a Bruker IFS 55 FTIR spectrophotometer (Ettlingen, Germany) equipped with a HgCdTe (mercury cadmium telluride, MCT) detector (broad band 12000-420 cm-1, liquid N2 cooled, 24 h hold time) at a resolution of 2 cm-1 with an aperture of 3.5 mm and acquired in the double-sided, forward6
DOI: 10.1016/j.colsurfa.2018.08.052 backward mode. After the spreading experiments, FTIR-ATR analysis was employed to characterize the MAPP/glass interface of the drop to evaluate the existence of chemical reactions (The polymer/vapor interface was also analyzed for comparison). A metal blade was used to detach the glass substrate from the cooled-down polymer drops. 2.9 Pull-out test A block of polymer was put into an aluminium cylindrical container with a radius of 5 mm and heated until 200 °C. When the polymer was completely molten, the fibre was placed perpendicular to the polymer surface and pushed down to a certain depth driven by a micrometer with an accuracy of 5 µm. Afterwards, the specimen was cooled down at a rate of 4°C/min until it reached room temperature. To perform the pull-out test, the sample was attached to the load cell of an Instron 5943 mini tensile machine. A fibre free length of 5 mm was chosen for all the specimens. The evaluation of the critical interfacial shear strength, τd , and the interfacial friction, τf , was made by following the procedure developed by Zhandarov et al. [31, 32], according to the following equation: F=
πd {τd tanh[β(le β
− a)] − τT tanh[β(le − a)] tanh [
[β(le −a)] 2
] + βaτf }
(4)
Where F is the current applied force as a function of the crack length ( a ), τT is the residual stress due to thermal shrinkage, τf is the frictional stress in the already debonded region, and β is the corrected shear-lag parameter according to Nairn [33]. This procedure takes into account the influence of interfacial friction in already debonded regions and adhesion in the still adhered section, relying on measurements of the maximum force during pull-out tests over a wide range of embedded lengths, le. More detailed information about this model can be consulted in [7, 31, 32]. Due to the difference between the coefficients of thermal expansion of the fibre and the matrix, the latter accumulates residual stress during cooling from processing temperatures, affecting the interfacial strength. τT =
βrf Ef (αf 2
− αm )∆T
(5)
Where Ef is the longitudinal tensile modulus of the fibre (46.6 GPa, measured by an optical extensometer), rf is the radius of the fibre, αf and αm are the longitudinal coefficients of thermal expansion (CTE) of the fibre and the matrix respectively (5x10⁻⁶/K for glass, 70x10-6/K for PP and MAPP, and 120x10-6/K for PVDF), and ∆T is the difference between the test temperature and the stress-free temperature (100, 116 and 142 °C for MAPP, PP and PVDF respectively). More information regarding the pull-out test methodology can be found in [7]. 7
DOI: 10.1016/j.colsurfa.2018.08.052 2.10 Statistics For surface tension and contact angle measurements, 5 samples per variant were tested. A minimum of 15 pull-out test samples per matrix combination and with different embedded lengths were performed. A single factor analysis of variance (ANOVA) was used to verify the difference in the mean contact angle and surface tension values between different systems. Significance was set at p < 0.05 and error is reported as standard error of the mean value. The Tukey HSD (honestly significance difference) test was used to determine which specific groups differed from each other once a statistically significant difference was found by the one-way ANOVA test. 3 RESULTS AND DISCUSSION 3.1 Surface properties of substrates (contact angle and roughness) Table 1 shows the surface composition determined using XPS for cleaned glass slides and glass fibres after 2 days storage in ultra-pure water. Both slides and fibres have a comparable surface composition, with similar C, O, and Si content. The O/Si ratios for the slide and the fibre were 1.8 and 1.5 respectively. For a pure glass sample, the O/Si ratio should be 2 (2 oxygen for 1 silicon in SiO2), and if the surface were only constituted of SiOH bonds, the O/Si ratio should be 1. This latter ratio was not expected because XPS analyses until a depth of about 10 nm, and hence not only the last atomic layer contributes to the recorded signal. The presence of C revealed contamination of the surface due to the interaction of the surface of the substrate with organic molecules from the environment. This contamination of the surface could alter the O/Si ratio because of the presence of oxygen bound to carbon present in the contaminated surface. The surface composition of the substrates is in agreement with the surface composition of glass slides after different cleaning procedures with sulfuric acid reported by Jang et al. [34], showing the reduction of C content from 44.6% for a non-treated surface (similar value also found by [7]) to a range between 11.9-33.1 % depending on the exposure time and sulfuric acid concentration used during the cleaning procedure. The minimum C content obtained in [34] was 11.9% for a sample boiled for 30 minutes in 95 % sulfuric acid. Other procedures for cleaning glass surfaces are also reported in literature like the use of a KOH solution [35], HNO3 [36], and UV/O3 [20] for cleaning soda-lime glass. In all cases C contamination was only reduced but not eliminated. As shown in Table 1, Na content of the glass slide surface reached only 2.2% compared to the nominal 14.2% Na2O composition in agreement with Jang et al. [34] who also found free Na present in the bulk of the glass
8
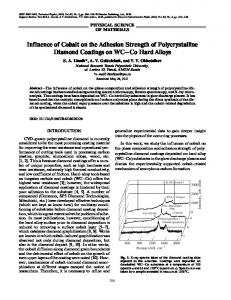
DOI: 10.1016/j.colsurfa.2018.08.052 solid, and noticed the effect of sulfuric acid which showed to be a very effective method for Na and Ca reduction at the glass surface. Although the bulk composition of the two different glass substrates is different, XPS analysis showed a similar surface composition of the two materials which guarantees the same surface chemistry for the 2 substrates used in this study. Regarding the wetting behaviour of the glass substrates, Table 2 shows the measured advancing and receding contact angles, as well as the calculated equilibrium contact angle (see section 2.3). As expected, the different contact angles obtained for water, diiodomethane, and ethylene glycol on the glass slide and fibre are similar, due to the similar surface composition as discussed before. A water droplet in contact with a perfectly cleaned glass slide should have a contact angle close to zero [36]. However, in practice, this is difficult to achieve and literature has reported water advancing contact angles values on clean glass surfaces ranging from 6.7° to 55° [7, 20, 37] with no obvious explanation. As shown in Table 2, the different contact angles of water on the glass substrates measured in this publication are between 23.1° and 39.4°. A rapid and progressive contamination related to the interaction of OH groups populating the surface of the glass substrate with organic molecules from the environment was proposed by different researchers [7, 20, 38] as an explanation of the formation of contact angles higher than zero. This is in agreement with our reported XPS data, which show C contamination on both substrates. This progressive contamination was also reported by [7] and [20], who measured small contact angles of water on glass immediately after cleaning, which gradually increased with time and finally reached much higher stable values. In this study, the substrates were stored in ultra-pure water to reduce environmental contamination. Another possible factor that could affect the wetting behaviour and adhesion of the substrates is related to surface roughness. The measured roughness (Ra) of the cleaned slide and fibre were 19.8 nm and 33.5 nm respectively, as can be seen in Figure 1. The obtained roughness values are comparable to those reported by [34] for glass slides cleaned with sulfuric acid under different conditions. The difference between the roughness values of both substrates is related to the more severe cleaning procedure used for the fibres in order to remove the cladding layer. As both values are low and comparable, the effect of roughness on the wetting behaviour of the test liquids and polymer melts as well as the effect of the mechanical interlocking mechanism when studying the interface by pull-out testing will be limited. 3.2 Contact angles and surface tension at room temperature 9
DOI: 10.1016/j.colsurfa.2018.08.052 Table 3 shows the surface energy components of all materials used in this study. These values were calculated using equilibrium angle values, which are shown in Table 2 with the advancing, and receding contact angles of water, ethylene glycol, and diiodomethane on glass substrates and polymers in solid state at room temperature. Both glass fibres and slides have the highest total surface energy due to the presence of OH-groups on the surface of clean glass, which increases the acid-base polar components. The Lifshitz-Van Der Waals (LW) components are similar for the glass and the polymers. In the case of PP, we found a small deviation in the magnitude of the polar surface energy component, which was expected to be zero since pure PP is a nonpolar polymer. This effect could be related to aging processes, or surface contamination and oxidation [39]. For the case of pure MAPP, the determined surface energy showed a slight increment of polar components possibly due to the presence of maleic anhydride groups (7 wt%), which are polar components [39]. Statistically, there was no difference between the different types of MAPP/PP blend combinations. On the contrary, PVDF showed higher acidity due to the different electronegativities of carbon, fluorine, and hydrogen [40]. In particular, the strong inductive effect of the fluorine atoms polarize the electron distribution of partially fluorinated polymers [40]. Wa and S for both glass fibres and slides as substrates were calculated for the various polymers using equations 1 and 2 respectively and are shown in Table 3. When Wa and S values obtained for glass slides and fibres are compared in each system, they are very similar and there is no statistical difference between them as expected (see section 3.1); therefore we considered the surface composition of both type of samples as nearly identical. As observed in Table 3, the calculated values of Wa and S for PP and MAPP were not statistically different. However, a slightly higher work of adhesion value is obtained for pure MAPP, again due to the polarity of maleic anhydride groups. It has to be noted that these values are only related to intermolecular physical forces and do not involve covalent bonding (which is important in the case of MAPP when making composites). All MAPP/PP blend combinations show positive and similar spreading coefficient values. A good and similar degree of wetting of the molten polymers on the glass substrates is then expected according to the evaluation of physical interactions of the solid MAPP/PP polymers and substrates at room temperature. PVDF appeared more favourable to achieve good compatibility with the two glass substrates, showing the highest work of adhesion and spreading coefficient. This strong interfacial interaction is a consequence of a 10
DOI: 10.1016/j.colsurfa.2018.08.052 relatively high surface energies of both PVDF and the glass substrates, as well as a high acid component in PVDF and a high basic component on the glass substrates. Since polar interactions are electron donor-acceptor interactions, strong interfacial interactions occur only when one phase has basic and the other has acidic sites [4, 14]. The high spreading coefficient predicts the molten polymer to spread spontaneously on both the fibre and flat glass surfaces. 3.3 Contact angles and surface tensions at elevated temperature The spreading dynamics for a typical PP drop at 220°C is shown in Figure 2. The contact angle decreases while the volume remains constant, and the drop base radius increases, confirming the contact line movement. The angle measured at equilibrium is considered as the static advancing contact angle. Contact angle relaxations of molten PP, MAPP, and PVDF at 200°C, 220°C, and 240°C, are shown in Figure 3. The initial contact angles were measured when the chamber reached the target temperature. In all the cases, higher temperature leads to lower static advancing contact angles. Since surface tension is temperature dependant for most thermoplastic polymers [41-43], surface energy decreases with increasing temperature (Figure 3), producing in turn the reduction of the static advancing contact angle. For the case of MAPP, PP and the different MAPP/PP blend combinations, it was clear that the static contact angle reduced when the MAPP content was increased at the same temperature (see Figure 3-d). This might be related to chemical reactions occurring between the MA group and the glass substrate during the spreading process as shown Grundke et al. [44]. This suggested that a chemical reaction, notably the formation of covalent bonds with the glass substrate, releases additional free energy during the interfacial reaction and might be an additional driving force for wetting. The static advancing contact angles at 200°C are shown in Table 4 for all the studied systems. On the other hand, the total surface tension for the different MAPP/PP blend combinations remains similar at 200°C (see Table 4 and Figure 3), suggesting that differences observed in the wetting behaviour of molten MAPP is mainly related to chemical interaction of MA groups at the MAPP/glass interface. It could also be possible that polar groups would turn inward at the air interface and outward at the glass interface. This is in agreement with Grundke [44] and Koberstein [45], who indicated that polar functional groups do not manifest themselves in the surface tension when end groups have a higher surface tension than the polymer backbone. To confirm the hypothesis that the surface tension plays a limited role in the wetting of different grades of MAPP/PP, it should be attempted to measure the polar and Lifshitz-van der Waals surface energy components at high temperature, but
11
DOI: 10.1016/j.colsurfa.2018.08.052 this remains a challenging task and goes beyond the scope of this study. The most obvious way for this is to work with different solid probes with known surface energy components, but in reality these probes would first need themselves to be characterised at high temperature. FTIR-ATR spectroscopy (see Figure 5) confirmed that chemical reactions took place at the interphase between MAPP and the glass substrate. No absorption peaks in the spectrum of the top MAPP/vapour interphase at ~1782 cm-1 and ~1857 cm-1 were recorded, which correspond to the presence of MA groups [46]. On the other hand, the bottom MAPP/glass interphase showed two obvious absorption peaks at ~1711 cm-1 and ~1739 cm-1 which are attributed to the presence of carboxylic acid and ester carbonyl groups respectively [46]. These groups are the result of chemical reactions through esterification between OH groups of the glass surface and MA groups. FTIR-ATR spectroscopy thus confirmed the occurrence of chemical reactions between the MA groups and the glass substrates and the absence of MA groups at the MAPP/vapour interphase which is in agreement with the null variation of surface tension with the increment of MA content discussed in the previous paragraph. Regarding the Wa values calculated for the different MAPP/PP blend combinations by directly using the observed contact angle of the melts (equation 1, second equality), the results showed no variations, notwithstanding the notable reduction of the static contact angle with the increase of MAPP content. This is due to the slight reduction of the surface tension with the increase of the MAPP content, which compensates the reduction of the static contact angle. Although the variation of Wa due to MAPP content is not significant, the spreading coefficient showed a clear indication of improvement of wetting of the melts with the increment of MAPP content, starting from -7.1 mJ/m2 for pure PP to -1.4 mJ/m2 for MAPP (7% MA). All the different MAPP/PP blend combinations showed a higher Wa if compared with pure PP polymer. For PVDF, even though predictions at room temperature indicated good compatibility between solid PVDF and the glass slide at room temperature, the static advancing contact angle obtained for the PVDF melt was the highest, showing also the lowest spreading coefficient (-13.3 mJ/m2), possibly due to the combined effect of hydrogen bonds formation and entanglements of PVDF chains which could limit spreading. At PVDF/glass interfaces, the formation of hydrogen bonds makes interfacial PVDF chains to pin strongly on the substrate and therefore restrict the movement of the bulk chains via entanglements [26]. In contrast, the bulk PP chains cannot be restricted by the weak interfacial interaction to PP, despite the existence of chain entanglements.
12
DOI: 10.1016/j.colsurfa.2018.08.052 However, due to its high surface tension, the PVDF melt still showed a value of Wa that was comparable to those obtained by the other melts (see Table 4). This in all shows some possible wetting issues at higher temperature combined with a good predicted adhesion at room temperature. The static advancing contact angle values obtained for PP, MAPP, and PVDF melts at 200°C on both slides and glass fibres were similar (see Table 4) indicating that the curvature of the fibre had no effect on the wetting power of the melt; therefore we considered the wetting process without making a difference between the substrates. In the previous sections, physical adhesions between a glass substrate and thermoplastic solids were evaluated at room temperature and the wetting properties of thermoplastic melts on the same glass substrate at high temperature were used as a direct indication of the level of adhesion that could potentially be obtained at the polymer/glass interface. When these adhesion values are compared, they show different trends. While in the solid state PVDF is clearly the best choice in terms of work of adhesion and spreading coefficient, at high temperatures, Wa is similar to the different MAPP/PP combinations and only slightly higher than pure PP, and the spreading coefficient is clearly the most negative (see Table 4). This negative spreading coefficient value implies that spontaneous wetting of the glass substrate with molten PVDF is unlikely to happen. The link between wetting parameters (Wa and S) and practical adhesion is then not straightforward. Once the polymers regain their solid state, their surface properties in solid state eventually contribute to the interfacial strength. However, surface energies of both the polymer and the substrate at processing temperature would be expected to control the wetting behaviour of molten polymers when chemical reactions are absent. 3.4 Pull-out tests By following the procedure described in Section 2.9 and [7, 31, 32, 47], the measured and the theoretical maximum force (Fmax) (calculated using equation 4) are plotted as function of the embedded length (le ) in Figure 6 for glass fibre and PP, MAPP, and PVDF systems. The R² values for all the systems were close to one, since the algorithm for fitting the curves is based on maximisation of R2, as described in [31, 32, 47]. For better analysis of mild deviations of data from the model, the residual plots are added in each image. The calculated critical interfacial shear strength, τd , and the interfacial friction, τf , are shown in Table 4. There is a good correlation between the interfacial parameters determined from the pull-out test and the Wa evaluated at room temperature for PP and PVDF glass fibre systems. As it can be seen in Table 4, the value of 13
DOI: 10.1016/j.colsurfa.2018.08.052 𝜏𝑑 for the PVDF-glass fibre system is approximately 5 times higher than the value obtained for the PP-glass fibre system. The latter clearly indicates a higher interfacial adhesion and greater surface energy components compatibility of PVDF on glass fibres if compared with the PP system. At high temperature, however, Wa values are very similar between both systems due to the low capacity of PVDF to spread on the fibre leading to a high static advancing contact angle (68.3°), contrary to the predictions obtained at room temperature. If the two glass fibre systems are analysed together, τf for PVDF is lower than for PP (see Table 4). For short embedded lengths (< 2 mm), Fmax for the PVDF system is higher due to its high τd ; but as the embedded length increases also the influence of friction does, reducing the force needed to pull out the fibre when compared to PP (due to lower friction of the debonded region), as it can be seen in Figure 6-d, where the theoretical curves are analysed. If friction is not taken into account, the performance of the PVDF-glass system was always the highest. Even though the roughness of the fibres was the same for the two thermoplastics, the effect of friction is lower in PVDF than in the PP system (τf values of 1.4 MPa and 2.9 MPa respectively). Again, this may be related to the difficulty of PVDF to spread on the glass surface due to its high negative spreading coefficient at high temperature (see Table 4), reducing the amount of area in contact with the glass surface and also reducing the mechanical interlocking, as the penetration depth into the surface roughness is much lower for the PVDF compared to PP. Although the Wa of MAPP was similar to the PP system at room temperature and slightly higher at high temperature, the obtained τd was considerably higher than for PP. This was because chemical bonds are formed between the MA groups from the polymer and the hydroxyl groups from the glass surface, as discussed in the previous section. The practical adhesion at the interface of MAPP improved compared to PP through chemical bonding (higher τd ). However, PVDF showed a higher τd than MAPP, although only physical interactions are involved. This result could be explained when taking the strength values of the polymer matrices into account since the strength of solid MAPP is lower than the strength of solid PP and solid PVDF (30 MPa, 55 MPa, and 78 MPa respectively). Therefore, with a stronger interface, the failure occurs in the polymer matrix. The latter can be observed in the SEM images of already pulled-out fibres, where fragments of MAPP remain on the fibre surface (see Figure 7-top). Even though MAPP is chemically bonded to the glass fibre, the measured adhesion strength is not better than the one of the PVDF system due to polymer failure. This effect can also be observed during cooling of the polymer drops down to room temperature on the flat glass slides (see Figure 7-bottom), when the large 14
DOI: 10.1016/j.colsurfa.2018.08.052 difference between the coefficients of thermal expansion of the polymers and the glass substrate (5, 70, 60, and 120 ×10-6/K, for glass, PP, MAPP, and PVDF respectively), induces the failure of the polymer/glass interface due to shrinkage of the polymers. The PP drop was completely debonded without applying any external force, while in the case of PVDF and MAPP the core of the interface remained adhered to the glass surface and only the edges failed. In the latter case, it is also possible to observe fragments of the MAPP that are still adhered to the glass surface, in contrast to the clean surface for PVDF (Figure 7-bottom). 4 CONCLUSIONS When chemical bonding is excluded and only physical interactions are evaluated (PP and PVDF systems), a good correlation between practical adhesion (critical interfacial shear strength,𝜏𝑑 ) and the theoretical work of adhesion, Wa, at room temperature is found. However, the analysis of the spreading of molten polymers on glass substrates at high temperatures as a direct indication of the level of adhesion at the solid polymer/glass interfaces marginally corresponded with practical adhesion values obtained from pull-out tests. This might be explained by the large difference of surface energy values between solid and molten polymers. However, wetting analysis at high temperature gave an indication of the behaviour of the polymer at room temperature, showing correspondence of spreading coefficients with the frictional stress, τf . The explanation for this is that a low spreading coefficient would hinder the wetting of surface asperities, which would lead to a low pull-out friction. A direct correlation of the degree of wettability and the maleic anhydride (MA) content in molten MAPP/PP blends was observed, which appears to be mainly related to chemical reactions occurring between the MA groups and the glass surface, according to FTIR results. This was not observed by a variation in surface energy, since the total surface energy remained relatively stable for the different MAPP/PP blend combinations, but evidenced by the critical interfacial shear strength, τd , of MAPP/glass being higher than in PP/glass due to covalent chemical bonding. However, the interfacial strength in the PVDF/glass system was stronger than in MAPP/glass, although the direct contact angle measurement showed smaller contact angles for MAPP systems, and despite the formation of chemical bonds between MAPP and glass. This effect is explained by the high room temperature surface energy of PVDF and by the fact that the MAPP/glass system fails in the polymer matrix. In this case, the interfacial shear strength is limited by the shear strength of MAPP, which is relatively low. ACKNOWLEDGEMENTS We acknowledge the support from Emmanuel Gosselin, Université de Mons, and Alex Bian, University of Applied Sciences and Arts Northwestern Switzerland, for their work on FTIR-ATR analysis and melt-blending of PP/MAPP respectively. Swiss partners were supported by the Swiss Competence Center for Energy Research (SCCER), unit 15
DOI: 10.1016/j.colsurfa.2018.08.052 Efficient Technologies and Systems for Mobility, funded by the Commission for Technology and Innovation (CTI), project grant 15091.1 PFIW-IW. Our thanks to Pierre Eloy and Michel Genet, Université Catholique de Louvain, for help with XPS measurements and analysis.
REFERENCES [1] J.A. Nairn, A variational mechanics analysis of the stresses around breaks in embedded fibers, Mechanics of Materials, 13 (1992) 131-154. [2] S.-L. Gao, E. Mäder, Characterisation of interphase nanoscale property variations in glass fibre reinforced polypropylene and epoxy resin composites, Composites Part A: Applied Science and Manufacturing, 33 (2002) 559-576. [3] F. Jones, A review of interphase formation and design in fibre-reinforced composites, Journal of Adhesion Science and Technology, 24 (2010) 171-202. [4] M. Connor, J.E. Bidaux, J.A.E. Manson, A criterion for optimum adhesion applied to fibre reinforced composites, Journal of materials science, 32 (1997) 5059-5067. [5] A. Kinloch, The science of adhesion, Journal of materials science, 15 (1980) 2141-2166. [6] M. Larsson, M. Ahmad, Improved polymer–glass adhesion through micro-mechanical interlocking, Journal of Micromechanics and Microengineering, 16 (2006) S161. [7] C.A. Fuentes, G. Brughmans, L. Tran, C. Dupont-Gillain, I. Verpoest, A. Van Vuure, Mechanical behaviour and practical adhesion at a bamboo composite interface: Physical adhesion and mechanical interlocking, Composites Science and Technology, 109 (2015) 40-47. [8] J. Comyn, Polymer permeability, Springer Science & Business Media2012. [9] W.-S. Kim, I.-H. Yun, J.-J. Lee, H.-T. Jung, Evaluation of mechanical interlock effect on adhesion strength of polymer–metal interfaces using micro-patterned surface topography, International Journal of Adhesion and Adhesives, 30 (2010) 408-417. [10] Z. Dai, F. Shi, B. Zhang, M. Li, Z. Zhang, Effect of sizing on carbon fiber surface properties and fibers/epoxy interfacial adhesion, Applied Surface Science, 257 (2011) 6980-6985. [11] C. Joly, M. Kofman, R. Gauthier, Polypropylene/Cellulosic Fiber Composites Chemical Treatment of the Cellulose Assuming Compatibilization Between the Two Materials, Journal of Macromolecular Science, Part A, 33 (1996) 1981-1996. [12] J.M. Felix, P. Gatenholm, The nature of adhesion in composites of modified cellulose fibers and polypropylene, Journal of Applied Polymer Science, 42 (1991) 609-620. [13] A. Arbelaiz, B. Fernández, G. Cantero, R. Llano-Ponte, A. Valea, I. Mondragon, Mechanical properties of flax fibre/polypropylene composites. Influence of fibre/matrix modification and glass fibre hybridization, Composites Part A: Applied Science and Manufacturing, 36 (2005) 1637-1644. [14] C.A. Fuentes, L.Q.N. Tran, M. Van Hellemont, V. Janssens, C. Dupont-Gillain, A.W. Van Vuure, I. Verpoest, Effect of physical adhesion on mechanical behaviour of bamboo fibre reinforced thermoplastic composites, Colloids and Surfaces A: Physicochemical and Engineering Aspects, 418 (2012) 7-15. [15] F. Awaja, P.J. Pigram, Surface molecular characterisation of different epoxy resin composites subjected to UV accelerated degradation using XPS and ToF-SIMS, Polymer Degradation and Stability, 94 (2009) 651-658. [16] J.-K. Kim, Y.-W. Mai, Engineered interfaces in fiber reinforced composites, Elsevier Science, Oxford, UK, 1998. [17] J. Comyn, Adhesion science, Royal Society of Chemistry1997. [18] Y. Yuan, T.R. Lee, Contact angle and wetting properties, Surface science techniques, Springer2013, pp. 3-34. [19] S. Qiu, C.A. Fuentes, D. Zhang, A.W. Van Vuure, D. Seveno, Wettability of a single carbon fiber, Langmuir, 32 (2016) 9697-9705. [20] S. Takeda, K. Yamamoto, Y. Hayasaka, K. Matsumoto, Surface OH group governing wettability of commercial glasses, Journal of non-crystalline solids, 249 (1999) 41-46. [21] A. Sharma, H. Jain, A. Miller, Surface modification of a silicate glass during XPS experiments, Surface and interface analysis, 31 (2001) 369-374. 16
DOI: 10.1016/j.colsurfa.2018.08.052 [22] A.H. E. Rädlein U. Brokmann, Common features of glass surface degradation, Glass Performance Days 2009Finland, 2009. [23] C.A. Fuentes, L.Q.N. Tran, C. Dupont-Gillain, W. Vanderlinden, S. De Feyter, A.W. Van Vuure, I. Verpoest, Wetting behaviour and surface properties of technical bamboo fibres, Colloids and Surfaces A: Physicochemical and Engineering Aspects, 380 (2011) 89-99. [24] C. Della Volpe, D. Maniglio, S. Siboni, M. Morra, Recent theoretical and experimental advancements in the application of van Oss-Chaudury-Good acid-base theory to the analysis of polymer surfaces I. General aspects, Journal of adhesion science and technology, 17 (2003) 1477-1505. [25] C. Andrieu, C. Sykes, F. Brochard, Average spreading parameter on heterogeneous surfaces, Langmuir, 10 (1994) 2077-2080. [26] Y. Zhang, C.A. Fuentes, R. Koekoekx, C. Clasen, A.W. van Vuure, J. De Coninck, D. Seveno, Spreading Dynamics of Molten Polymer Drops on Glass Substrates, Langmuir, (2017). [27] D. Duvivier, D. Seveno, R. Rioboo, T.D. Blake, J. De Coninck, Experimental evidence of the role of viscosity in the molecular-kinetic theory of dynamic wetting, Langmuir, 27 (2011) 13015-13021. [28] M. Vega, C. Gouttiere, D. Seveno, T. Blake, M. Voue, J. De Coninck, A. Clarke, Experimental investigation of the link between static and dynamic wetting by forced wetting of nylon filament, Langmuir, 23 (2007) 10628-10634. [29] C. Della Volpe, M. Brugnara, D. Maniglio, S. Siboni, T. Wangdu, About the possibility of experimentally measuring an equilibrium contact angle and its theoretical and practical consequences, Contact angle, wettability and adhesion, 4 (2006) 79. [30] A. Daerr, A. Mogne, Pendent_Drop: An ImageJ Plugin to Measure the Surface Tension from an Image of a Pendent Drop, Journal of Open Research Software, 4 (2016). [31] S. Zhandarov, E. Pisanova, B. Lauke, Is there any contradiction between the stress and energy failure criteria in micromechanical tests? Part I. Crack initiation: stress-controlled or energycontrolled?, Composite Interfaces, 5 (1997) 387-404. [32] S.F. Zhandarov, E. Mäder, O.R. Yurkevich, Indirect estimation of fiber/polymer bond strength and interfacial friction from maximum load values recorded in the microbond and pull-out tests. Part I: local bond strength, Journal of Adhesion Science and Technology, 16 (2002) 1171-1200. [33] J. Nairn, Generalized shear-lag analysis including imperfect interfaces, Advanced Composites Letters, 13 (2004) 263 - 274. [34] H. Jang, Y. Chung, S. Whangbo, Y. Lee, I. Lyo, C. Whang, S. Lee, G. Kim, Effects of chemical etching with sulfuric acid on glass surface, Journal of Vacuum Science & Technology A: Vacuum, Surfaces, and Films, 18 (2000) 401-404. [35] S.H. North, E.H. Lock, T.R. King, J.B. Franek, S.G. Walton, C.R. Taitt, Effect of physicochemical anomalies of soda-lime silicate slides on biomolecule immobilization, Analytical chemistry, 82 (2009) 406-412. [36] A. Menawat, H. Joseph, R. Siriwardane, Control of surface energy of glass by surface reactions: Contact angle and stability, Journal of colloid and interface science, 101 (1984) 110-119. [37] M. Wei, R.S. Bowman, J.L. Wilson, N.R. Morrow, Wetting Properties and Stability of Silane-Treated Glass Exposed to Water, Air, and Oil, Journal of Colloid and Interface Science, 157 (1993) 154-159. [38] S. Iglauer, A. Salamah, M. Sarmadivaleh, K. Liu, C. Phan, Contamination of silica surfaces: Impact on water–CO2–quartz and glass contact angle measurements, International Journal of Greenhouse Gas Control, 22 (2014) 325-328. [39] I. Aranberri-Askargorta, T. Lampke, A. Bismarck, Wetting behavior of flax fibers as reinforcement for polypropylene, Journal of colloid and interface science, 263 (2003) 580-589. [40] S. Lee, J.S. Park, T.R. Lee, The Wettability of Fluoropolymer Surfaces: Influence of Surface Dipoles, Langmuir, 24 (2008) 4817-4826. [41] N.R. Demarquette, J.C. Moreira, R.N. Shimizu, M. Samara, M.R. Kamal, Influence of temperature, molecular weight, and molecular weight dispersity on the surface tension of polystyrene, polypropylene, and polyethylene. II. Theoretical, Journal of applied polymer science, 83 (2002) 22012212. [42] D. Kwok, L. Cheung, C. Park, A. Neumann, Study on the surface tensions of polymer melts using axisymmetric drop shape analysis, Polymer Engineering & Science, 38 (1998) 757-764. 17
DOI: 10.1016/j.colsurfa.2018.08.052 [43] Z. Funke, C. Schwinger, R. Adhikari, J. Kressler, Surface tension in polymer blends of isotactic poly (propylene) and atactic polystyrene, Macromolecular Materials and Engineering, 286 (2001) 744-751. [44] K. Grundke, S. Michel, K.J. Eichhorn, D. Beyerlein, T. Bayer, Influence of chemical interactions on the macroscopic spreading of a maleic anhydride copolymer melt, Macromolecular Chemistry and Physics, 203 (2002) 937-946. [45] J.T. Koberstein, Molecular design of functional polymer surfaces, Journal of Polymer Science Part B: Polymer Physics, 42 (2004) 2942-2956. [46] H.-S. Kim, B.-H. Lee, S.-W. Choi, S. Kim, H.-J. Kim, The effect of types of maleic anhydride-grafted polypropylene (MAPP) on the interfacial adhesion properties of bio-flour-filled polypropylene composites, Composites Part A: Applied Science and Manufacturing, 38 (2007) 1473-1482. [47] S. Zhandarov, E. Mäder, Characterization of fiber/matrix interface strength: applicability of different tests, approaches and parameters, Composites Science and Technology, 65 (2005) 149-160.
Table 1. Surface composition (molar fractions and molar ratios) determined using XPS for cleaned glass slides and glass fibres stored in ultra-pure water.
60
μm
50 40 30 20 10 0 0
20
40
60
90 nm 70 80 60 70 50 60 40 50 30 40 20 30 10 20 0 10 -10 0 100 80 μm
60
μm
50 40 30 20 10 0 0
20
40
60
90nm 70 80 60 70 50 60 40 50 30 40 20 30 10 20 0 10 -10 0 80 100 μm
Figure 1. 2D profile of a typical slide (left) and fibre (right) surface by optical profilometer.
18
DOI: 10.1016/j.colsurfa.2018.08.052
WT
DM
EG
liquid
adv
rec
equ
adv
rec
equ
adv
rec
equ
Glass Slide Glass Fibre
39.4 ±0.8
29.3 ±1.2
34.7 ±0.9
58.4 ±1.9
47.7 ±1.5
53.2 ±1.7
39.4 ±1.3
19.1 ±2.1
30.8 ±2.1
36.5 ±1.4
23.1 ±0.5
30.5 ±1.0
61.8 ±1.7
54.2 ±1.5
58.1 ±1.6
41.3 ±2.0
20.2 ±2.6
32.2 ±2.1
PP
102.4 ±2.0
76.0 ±2.4
89.2 ±2.1
71.0 ±2.5
39.2 ±1.9
56.6 ±2.1
78.2 ±1.7
53.4 ±4.7
66.4 ±2.9
1% MAPP 2% MAPP 5% MAPP 10% MAPP
100.6 ±1.8
78.6 ±2.6
89.6 ±2.2
69.5 ±3.5
43.9 ±2.6
57.6 ±3.0
80.3 ±1.1
54.0 ±1.3
67.8 ±1.2
102.2 ±1.8
75.0 ±1.8
88.6 ±1.7
69.7 ±2.8
46.2 ±2.0
58.7 ±2.4
82.7 ±2.8
53.2 ±2.0
68.7 ±2.3
102.4 ±2.5
74.9 ±3.8
88.7 ±3.0
71.3 ±2.1
45.6 ±4.1
59.3 ±2.8
81.4 ±1.5
53.0 ±3.1
67.9 ±2.1
102.2 ±3.5
74.9 ±3.9
88.6 ±3.6
70.3 ±3.9
41.6 ±3.8
57.1 ±3.7
81.1 ±1.6
52.4 ±3.8
67.5 ±2.5
MAPP
100.0 ±2.5
69.5 ±1.9
84.9 ±2.1
68.9 ±2.1
36.1 ±2.2
54.3 ±2.0
80.4 ±1.8
42.5 ±6.9
63.1 ±3.6
PVDF
85.5 ±0.9
68.9 ±1.2
77.3 ±1.0
63.6 ±0.4
46.5 ±1.8
55.5 ±0.8
54.1 ±1.2
32.1 ±1.6
44.2 ±0.9
Table 2. Advancing, receding and equilibrium contact angles of probe liquids on glass and thermoplastic surfaces: water (WT), ethylene glycol (EG), diiodomethane (DIO).
Material
γLW (mJ/m2)
γ(mJ/m2)
γ+ (mJ/m2)
γtot (mJ/m2)
𝑾𝒂 * (mJ/m2)
𝑾𝒂 ** (mJ/m2)
𝑺* (mJ/m2)
𝑺 ** (mJ/m2)
Glass Slide
32.5±1.0
23.9±0.7
0.8±0.2
41.5±1.3
--
--
--
--
Glass Fibre
29.7±0.9
27.3±0.7
1.1±0.2
40.5±1.4
--
--
--
--
PP
30.5±1.2
1.5±0.5
0.0±0.0
30.6±1.3
65.5±2.3
63.1±2.4
4.3±2.3
1.8±2.3
1% MAPP
30.0±1.7
1.5±0.6
0.0±0.0
30.0±1.8
64.7±2.6
62.2±2.2
4.8±2.6
2.3±2.2
2% MAPP
29.3±1.4
1.9±0.5
0.0±0.0
29.4±1.5
64.5±2.0
62.1±2.0
5.7±2.0
3.3±2.0
5% MAPP
29.0±1.6
1.9±0.8
0.0±0.0
29.1±1.7
64.3±2.9
62.0±3.1
6.1±2.9
3.7±3.0
10% MAPP
30.2±2.1
1.7±1.0
0.0±0.0
30.3±2.2
65.2±2.7
62.7±2.8
4.6±2.7
2.1±2.3
MAPP
31.8±1.1
2.3±0.7
0.0±0.0
32.1±1.3
67.8±2.8
65.3±2.8
3.7±2.7
1.2±2.6
PVDF
31.2±0.6
3.3±0.4
0.9±0.1
34.7±0.7
76.4±1.7
74.6±1.7
7.1±1.7
5.3±1.7
Table 3. Surface energy components, Wa, and S of glass and thermoplastic films. * glass slide ** glass fibre.
19
DOI: 10.1016/j.colsurfa.2018.08.052
0 sec
30 sec
60 sec
90 sec
120 sec
150 sec
180 sec
360 sec
1 mm
Figure 2. Snapshots illustrating the spreading of a PP drop on a glass slide at 220°C (Left) and the corresponding contact angle, volume, and radius variations versus time (Right) .
(a)
(c)
PP
PVDF
(b)
(d)
MAPP
PP/MAPP
Figure 3. Contact angle relaxation versus time for PP (a), MAPP (b), and PVDF (c) at 200°C, 220°C, and 240°C. Contact angle relaxation versus time for different MAPP/PP blend combinations at 200°C.
20
DOI: 10.1016/j.colsurfa.2018.08.052
Figure 4. Temperature dependence of surface tension for PVDF, PP and two MAPP/PP blend combinations. The surface tension measurement at 20 °C was performed by immersing polymer films in test liquids, following the Wilhelmy approach (see section 2.4). The other values were obtained by using the pendant drop method (see section 2.5).
Bottom Interface
Top Interface
Figure 5. FTIR-ATR spectra of MAPP/glass top and bottom interfaces. The inset shows the location of both interfaces.
21
DOI: 10.1016/j.colsurfa.2018.08.052
τd
τf
(mJ/m2)
γtot
C.A. * (°)
C.A. ** (°)
𝑾𝒂 * (mJ/m2)
𝑺* (mJ/m2)
(MPa)
(MPa)
PP
20.2±0.8
49.9±2.0
45.2±1.8
33.2±1.9
-7.1±1.8
7.9
2.9
1% MAPP
21.2±1.2
43.8±2.6
--
36.5±2.7
-5.9±0.3
--
--
2% MAPP
19.5±1.1
35.2±4.9
--
35.4±3.0
-3.6±0.8
--
--
5% MAPP
19.4±1.3
34.0±2.8
--
35.5±2.9
-3.3±0.3
--
--
10% MAPP
18.9±0.9
29.5±2.3
--
35.3±2.1
-2.5±0.3
--
--
MAPP
19.1±0.8
22.1±4.3
20.3±1.2
36.8±2.1
-1.4±0.5
14.4
2.0
PVDF
26.2±1.3
70.6±1.2
68.3±1.9
34.8±2.2
-13.3±1.3
37.0
1.4
Material
Table 4. Contact angles (C.A.) of molten polymers, interfacial (τd, τf ) and wetting parameters (γtot, Wa, S) for glass at 200°C. *slide, ** fibre.
(a)
(c)
PP R2=0.99 9
(b)
MAPP R2=0.99 9
PVDF R2=0.98 5
(d)
PP MAPP PVDF
Figure 6. Experimental plot of the Fmax (blue points) versus the embedded length of PP (a), MAPP (b), and PVDF (c) for glass fibre as substrate, and their theoretical fits (red dotted lines). Comparison of the theoretical fits of PP, MAPP and PVDF (d). The inserts show the residual plots for better analysing mild deviations of data from the model.
22
DOI: 10.1016/j.colsurfa.2018.08.052
Figure 7. Pulled-out fibres (top) with PP (left), MAPP (centre), and PVDF (right) as matrices. Polymer drops (bottom) after cooling down to room temperature for MAPP (left), where fragments on the glass surface of the fractured polymer matrix can be observed (red arrows), and PVDF (right), displaying a clean fracture surface. A PP drop could not be imaged because drops detached from the glass substrate during vacuum-pumping.
23