reason to think that it will be increasingly true for the social sci- ences. The development of the Human Relations Area Files. (HRAF) Collection of Ethnography ...
Cross-Cultural 10.1177/1069397103260510 Peregrine et al. Studies / AN EXERCISE / MONTHINYEAR ARCHAEOMANCY
Predicting the Future State of the World Using Archaeological Data: An Exercise in Archaeomancy
Peter N. Peregrine Lawrence University
Melvin Ember Carol R. Ember Human Relations Area Files
The authors used data coded on all 289 cases in the Outline of Archaeological Traditions, a sampling universe developed by the Human Relations Area Files for comparative archaeological research, to predict future values of political integration. The authors found that political integration has increased during the past 12,000 years following a quadratic curve. Although there are potential methodological and theoretical problems with the analyses, the authors suggest that using the quadratic model to predict future values of political integration is reasonable. The authors conclude that a world state is likely to have appeared by AD 5000. Keywords:
cross-cultural research; forecasting; political evolution; political integration; quadratic model; world government
Authors’ Note: An earlier version of this article was presented at the first meeting of the Society for Anthropological Sciences, held at the Drury Inn Cross-Cultural Research, Vol. 37 No. X, Month 2003 1DOI: 10.1177/1069397103260510 © 2003 Sage Publications
1
2
Cross-Cultural Studies / MONTH YEAR
Philosophers of science with perspectives as diverse as Karl Popper (1934 OR 1959?), Thomas Kuhn (1962), and Bruno Latour (1987) have generally agreed that the development of new measuring instruments and techniques provides science with new insights into the structure of the world (cf. Lyotard, 1984). This has been true of the physical and biological sciences, and there is every reason to think that it will be increasingly true for the social sciences. The development of the Human Relations Area Files (HRAF) Collection of Ethnography (see M. Ember, 1997; Murdock, 1940) and its related tools led to the discovery of hundreds of relationships that help to explain an enormous amount of the cultural variation represented in the ethnographic record (C. R. Ember & Levinson, 1991; Levinson & Malone, 1980). Now, the development of the eHRAF Collection of Archaeology (see M. Ember, 1997) and the related Encyclopedia of Prehistory (Peregrine & Ember, 20012002) enables us to discern some facts and principles of cultural evolution from the archaeological record. This ARTICLE describes preliminary results that apply to the evolution of political hierarchy.
THE HRAF COLLECTION OF ARCHAEOLOGY E
The eHRAF Collection of Archaeology is a Web-based, full-text database with information on the prehistory of the world. This database, modeled after the HRAF Collection of Ethnography, includes full texts that have been numerically subject indexed according to the latest version of HRAF’s Outline of Cultural Materials (see Murdock et al., 2000). The Outline of Cultural Materials indexing system extends search capability well beyond keyword searching, allowing for precise subject retrieval even in foreign language texts. The eHRAF Collection of Archaeology currently includes more than 50,000 pages covering 41 major archaeological traditions and many more subtraditions and sites. Each tradition file consists of a general summary and full-text sources—books, and Suites in New Orleans on November 22-23, 2002. We wish to thank Robert Graber and Dwight Read for their comments and suggestions on earlier versions of this article. Correspondence concerning this article should be addressed to Peter N. Peregrine, Department of Anthropology, 515 E. College Ave, Appleton, WI 54911; e-mail: peter.n.peregrine@ lawrence.edu.
Peregrine et al. / AN EXERCISE IN ARCHAEOMANCY
3
journal articles, dissertations, and manuscripts. This unique archaeological database provides researchers and students with easy access to archaeological materials for comparative studies within and across regions and time periods. Cases included in the eHRAF Collection of Archaeology are initially selected by random sampling from the Outline of Archaeological Traditions (Peregrine, 2001a). (Selected archaeological sequences are also included.) The Outline of Archaeological Traditions is an attempt to catalogue and classify into comparable units of analysis all archaeologically known cultures, covering the entire globe and the entire prehistory of humankind. The Outline is organized around major archaeological traditions, each defined as a group of populations sharing similar subsistence practices, technology, and forms of sociopolitical organization, which are spatially contiguous over a relatively large area and which endure temporally for a relatively long period. Archaeological traditions are not quite like cultures in an ethnological sense because in addition to sociocultural defining characteristics, they generally also have a more extended temporal dimension. Language, ideology, and kinship ties play little or no part in their definition because these cultural features are virtually unrecoverable from archaeological contexts. In contrast, language, ideology, and kinship ties are central to defining ethnological cultures. There are 289 traditions identified in the current edition of the Outline of Archaeological Traditions. These traditions can be thought of as encompassing the sampling universe from which cases can be chosen for either synchronic or diachronic analysis of the archaeologically known past—an activity we refer to as archaeoethnology. The eHRAF Collection of Archaeology contains a simple random sample of the traditions covered in the Outline of Archaeological Traditions (new entries are selected each year using a table of random numbers; see http://www.yale.edu/hraf/ collections.htm for a list of the traditions), and its utility as a tool for archaeoethnology has already been demonstrated (Peregrine, 2001b; Peregrine, Ember, & Ember, 2000). In this article, we employ a related tool for archaeoethnology, the Encyclopedia of Prehistory (Peregrine & Ember, 2001-2002). This nine-volume work provides basic information on environment, settlement, economy, sociopolitical organization, and religious and expressive practices for each of the 289 traditions identified in the Outline of Archaeological Traditions. Thus, the Encyclopedia of Prehistory provides a source for basic information
4
Cross-Cultural Studies / MONTH YEAR
to be used in sampling, exploratory research, and, as is the case here, the initial testing of models or hypotheses before proceeding to the more detailed information provided in the eHRAF Collection of Archaeology. Here, we use the Encyclopedia of Prehistory to test whether there are trends in the evolution of political hierarchy that might be used to predict future values and, perhaps, a future world state.
THE EVOLUTION OF POLITICAL HIERARCHY To explore trends in the evolution of political hierarchy, all the cases identified in the Outline of Archaeological Traditions were coded on a 3-point scale of political hierarchy that was adapted from Murdock and Provost (1973). The Political Hierarchy Scale is as follows. 1 = autonomous communities 2 = one or two levels of hierarchy above the local community 3 = three or more levels of hierarchy above the local community
Scale Score 3 is essentially a proxy measure for the presence of a state, as defined according to the Wright and Johnson (1975) definition. These authors define states as polities having a specialized decision-making structure in which “the highest level involves making decisions about other, lower-order decisions” (Wright & Johnson, 1975, p. 267). They go on to explain that “any society with three or more levels of decision-making hierarchy must necessarily involve such specialization” (Wright & Johnson, 1975, p. 267) and hence, according to their definition, must be a state. It is important to note that there are many other definitions of states, ranging from highly specific ones to the simple statement that “if you can argue whether a society is a state or isn’t, then it isn’t” (Yoffee, 1993, p. 69). But Wright and Johnson’s definition of states is one that archaeologists have found particularly useful because it provides a means of identifying states through regional settlement data. We find it useful for the same reason. Coding was based on information provided in the Encyclopedia of Prehistory (Peregrine & Ember, 2001-2002) entries and was done by the first author in haphazard order as entries for the encyclopedia were received for review and editing prior to publication. The coded data are available in electronic format from the journal World Cultures (Peregrine, 2003); we invite other scholars to use
Peregrine et al. / AN EXERCISE IN ARCHAEOMANCY
5
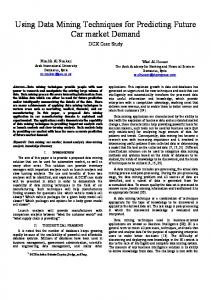
these published data to replicate the results we report here or to evaluate our conclusions using other analytical techniques. Unless otherwise noted, all statistics and graphics presented here were produced using the SPSS software package. We must note that neither values for the present day, which might be obtained from Murdock and Provost’s (1973) coded data, nor values for 1,000 years ago are included in these analyses. The reason for this is twofold. First, Peregrine (2003) found that the standard cross-cultural sample cases, for which Murdock and Provost coded their data, cannot be equated with Outline of Archaeological Traditions cases as the two sets of data are drawn from separate universes and are based on very different units of analysis. Second, Peregrine (2003) also found that the cases in the 1,000years-ago time period scored unexpectedly low on political integration and other cultural-complexity variables because many of the more politically integrated and complex cultures existing 1,000 years ago had developed written records and were dropped (for that reason) from the Outline of Archaeological Traditions sample. Thus, the 1,000-years-ago time period is biased toward less complex cases. Figure 1 displays means of political integration at 1,000-year s intervals for the past 12,000 years. The zero on the x-axis is today, and the 12 is 12,000 years ago. Averages for political integration shown on the y-axis were calculated using all cases with time ranges falling anywhere within each 1,000-year period. Thus, an archaeological tradition that begins at 3,000 years ago and ends at 1,500 years ago would be included in two calculations: one for 3,000 years ago and another for 2,000 years ago. The line is a best-fit regression line and has an R-squared value of 0.945. Clearly, there has been a strong trend toward increased political integration during the past 12,000 years. But the means in Figure 1 are not independent statistically because, as just explained, some traditions have been used in calculating more than one mean. If, however, we include each tradition in only one temporal period, either including it either only for the middle point of its temporal span or only for the end point, we get a similar, statistically significant fit (Rsquared of 0.92 and 0.93, respectively), apparently confirming the trend previously found. (See, however, the following caveat.) There is an interesting statistical problem in exploring political e v o l u t i o n i n t h i s way — s e r i a l a u t o c o r r e l a t i o n . Se r i a l autocorrelation occurs when two cases are not statistically independent because changes in an earlier case cause changes in a
6
Cross-Cultural Studies / MONTH YEAR
3.5
3.0
2.5
2.0
Political Integration
1.5
1.0
.5 Rsq = 0.9453
0.0 -6
-4
-2
0
2
4
6
8
10
12
14
Thousands of Years Ago Figure 1: Increase in Political Integration During the Past 12,000 Year
later one. Cultural evolution in general can be thought of as a serial-autocorrelation process. Change in an ancestral culture will generally lead to those changes being transmitted to descendant cultures; thus, the values of a variable reflecting that change will be serially autocorrelated when viewed over time. For example, if members of an archaeological tradition develop metal casting, it is likely that their descendants will also cast metals. A variable examining metal working technology (and using casting as an indicator of change) will thus present serial autocorrelation between the ancestral archaeological tradition and its descendants, as the development of metal casting in the ancestral tradition is causally linked to the descendant tradition having metalcasting technology. Autocorrelation is generally regarded as a problem in statistical analyses because it tends to artificially inflate correlation and regression coefficients (Ostrom, 1990). Thus, because of autocorrelation, the R-squared values of .94 reported earlier
Peregrine et al. / AN EXERCISE IN ARCHAEOMANCY
7
areas? likely inflated. One way to estimate whether such a value is inflated due to autocorrelation is through the Durbian-Watson statistic, which evaluates residuals to determine whether they are randomly distributed (randomly distributed residuals would suggest no autocorrelation; see Ostrom, 1990). The Durbian-Watson statistic for the political integration variable is .52, which, not surprisingly, suggests that autocorrelation is present. (A standard table for the Durbian-Watson statistic can be used to determine the significance level given the number of time periods and variables being used.) Another method of evaluating autocorrelation effects is to model the regression as an autocorrelational process. We did this using the Eviews econometrics software package, using a firstorder autoregressive function as our model and a generalized least squares method of estimation. We found that the R-squared value increased to .98. In sum, the Durban-Watson statistic increased to 1.94. Thus, it seems clear that there is strong serial autocorrelation underlying the evolution of political hierarchy. In typical regression analyses, strong serial autocorrelation such as that identified here would be cause for concern. The fact that cultural evolution is a serial autocorrelation process makes us question whether, indeed, serial autocorrelation is a problem we need to address when examining cultural evolution rather than an expectation that we need only concern ourselves with in its absence or when it is violated. Take, for example, an ordinary bank account. We deposit $100 and each month, interest accrues. If we chart the amount of money in the account each month, we find serial autocorrelation—the amount in the account each month is strongly correlated with the previous and future months’ amounts and with the specific value equivalent to the interest rate. The increase is expected, and perhaps uninformative, but it is real and should not be considered a problem. We argue that the same is true for cultural evolution: Serial autocorrelation is part of the process and thus needs to be included as part of the analysis. Going forward with the analysis then, a close examination of Figure 1 suggests that the relationship between average political integration and time is not a simple linear one but rather is curvilinear. Indeed, this is not surprising, because hierarchical polities tend to expand over time both through conquest of neighboring polities (e.g., Carneiro, 1970) and through peer-polity interaction (Renfrew & Cherry, 1986; also see Johnson, 2004 [this issue]), which tends to spread political innovations across the landscape of
8
Cross-Cultural Studies / MONTH YEAR
Political Integration 2.0 1.8 1.6 1.4 1.2 Observed
1.0
Logarithmic .8
Quadratic
.6
Exponential 0
2
4
6
8
10
12
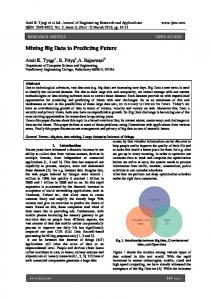
Sequence (12,000 kya -> 2000 kya) Figure 2: Regression Curves for Political Integration During the Past 12,000 Years
interacting polities. Hierarchical polities also tend to have higher rates of population growth than do those that are nonhierarchical (Johnson & Earle, 1987). Thus, we might expect political integration to show some form of a growth curve. Figure 2 shows three different growth curves fitted to the archaeological data. The upper curve is logarithmic and represents what would be expected if the growth of political hierarchy was due mainly to diffusion. Such a process might occur through population growth, expansion, and peer-polity interaction. Because the fit of the logarithmic curve is not very good, we can conclude that simple diffusion does not account for the increase in political hierarchy over time. The middle curve in Figure 2 represents exponential growth and illustrates what would be expected if the increase in political hierarchy were due to polities actively reproducing themselves, that is, conquering or incorporating other polities and establishing new, daughter polities. However, this curve fits the data well.
Peregrine et al. / AN EXERCISE IN ARCHAEOMANCY
9
Political Integration Differenced
.3
.2
.1
0.0 0
2
4
6
8
10
12
Thousands of Years Ago Figure 3: “Differenced” Regression Line Showing 95% Confidence Intervals
The exponential curve, however, tends to overestimate the initial growth of political hierarchy and underestimate later growth. There seems to be a lag between about 10,000 years ago and 4,000 years ago in the growth of political hierarchy and then a rapid increase after about 4,000 years ago. This may be due to initial resistance to hierarchy and the ability of people living largely as hunters and gatherers and simple agriculturalists to “vote with their feet.” Such conditions may have changed when enough hierarchical polities had developed to make resistance or movement increasingly difficult. We can see this effect more strongly in Figure 3, which eliminates the long-term growth trend in political hierarchy and autocorrelation effects through “differencing,” that is, through subtracting the value of each time period from its direct predecessor. In Figure 3, we see that although the evolution of political integration retains a linear growth trend despite the differencing,
10
Cross-Cultural Studies / MONTH YEAR
3.5
3.0
2.5
2.0
Political Integration
1.5
1.0
.5 Rsq = 0.9969
0.0 -6
-4
-2
0
2
4
6
8
10
12
14
Thousands of Years Ago
Figure 4: Best-Fit Curve Estimation (quadratic) for Increase in Political Integration During the Past 12,000 Years
there have been marked peaks and valleys. There is a high outlier at 8,000 years ago and a low outlier at 6,000 years ago. This may suggest that political integration took off rapidly around 8,000 years ago and then, during the course of 2,000 years, slowed markedly before resuming a generally linear upward trend. Again, we interpret this as reflecting initial resistance to political hierarchy and the subsequent expansion of hierarchical polities. Whatever the reasons for these deviations from a simple exponential growth curve, a quadratic curve appears to fit the data best. The best-fit quadratic curve is shown in Figure 4 and represents a near-perfect correlation. We tested the quadratic model by using Eviews to automatically fit a curve to the data. Eviews also identified a quadratic curve as the best-fit model, with a mean error of 1.4% and a mean squared deviation of only .00082. Thus, we are confident that the mean value of political integration has increased during the past 12,000 years in a manner that closely
Peregrine et al. / AN EXERCISE IN ARCHAEOMANCY
11
3.5
3.0
2.5
2.0
Political Integration
1.5
1.0
.5 0.0
Rsq = 0.9969
-6
-4
-2
0
2
4
6
8
10
12
14
Thousands of Years Ago
Figure 5: Quadratic Prediction Line and 95% Confidence Interval Illustrating When All Polities Will Be States (ca. 5000 AD)
approximates a quadratic curve. With that information, we should be able to forecast future mean values of political integration.
ARCHAEOMANCY: USING THE PAST TO PREDICT THE FUTURE Using basic techniques of forecasting, one should be able to use the curvilinear trend established with data from the past 12,000 years to predict future values of a given variable (Gordon, 1992). However, such extrapolation—using the past to predict the future—smacks of augury to us, and we therefore have coined the term archaeomancy to describe it (rather than forecasting or prediction). This term archaeomancy reflects our uncertainty as to the legitimacy of using the prehistoric past to predict the future. First, the nature of the prehistoric past does not lend itself to the kinds of
12
Cross-Cultural Studies / MONTH YEAR
analyses typically undertaken in forecasting. Not only are the data scarce and often based on highly inferential methods of operationalization, but they are also necessarily biased in unpredictable ways (through recovery, preservation, and the like). Second, too many variables might interfere with long-term forecasts, and too many unforeseen circumstances might alter future values—the primary unknown of which is human nature itself, which seems to us far too mutable to guarantee that forecasting our futures with any certainty is possible. As the Underground Man bluntly stated more than a century ago, One’s own free, untrammeled desires, one’s own whim, no matter how extravagant, one’s own fancy, be it wrought up at times to the point of madness—all of this is precisely that most advantageous of advantages which is omitted, which fits into no classification, and which is constantly knocking all systems and theories to hell. (Dostoevsky, 1864/1974, p. 28)
With these caveats in mind, here are our results. Figure 5 shows the best-fit quadratic curve projected out 6,000 years into the future, with a 95% confidence interval. The line suggests that in about 3,000 years, around the year AD 5000, all societies would be coded 3 on the Political Hierarchy Scale (because the line represents the mean for all cases and 3 is the highest possible value, when the mean is 3, then all cases must be coded 3). We interpret this result as suggesting either (a) that every polity, no matter how small or localized, will have a state form by that time or (b) that all peoples will be incorporated into a single world state by that time. Both interpretations are reasonable, although the former is perhaps the most representative of the coding itself. FIGURE 5 ABOUT HERE The primary reason we might opt for the latter interpretation is that it matches remarkably well with the extrapolation of Louis Marano (1973). Marano (1973) also used archaeological data to chart the size of states over time. He argued that the geographical size of states was increasing and used logarithmic regression to predict that the entire land area of the world would be encompassed by a single state “no later than 4850 A.D.” (Marano, 1973, p. 38). Because Marano’s date corresponds so closely to our own, it may be reasonable to suggest that both he and we have charted the same phenomenon, namely, the emergence of a world state.
Peregrine et al. / AN EXERCISE IN ARCHAEOMANCY
13
References Carneiiero, R. (1970). A theory of the origin of the state. Science, 169, 733738. Dostoevsky, F. (1974). Notes from underground (Mirra Ginburg, Trans.). New York: Bantam. (Original work published 1864) Ember, C. R., & Levinson, D. (1991). The substantive contributions of worldwide cross-cultural studies using secondary data. Behavior Science Research, 25, 79-140. Ember, M. (1997). Evolution of the Human Relations Area Files. CrossCultural Research, 3, 3-15. Gordon, T. J. (1992). The methods of futures research. Annals of the American Academy of Political and Social Science, 522, 25-35. Johnson, A. L. (2004). Why not to expect a “world state.” Cross-Cultural Research, XXX, XXX-XXX. Johnson, A. L., & Earle, T. (1987). The evolution of human societies. Stanford: Stanford University Press. Kuhn, T. (1962). The structure of scientific revolutions. Chicago: University of Chicago Press. Latour, B. (1987). Science in action. Cambridge, MA: Harvard University Press. Levinson, D., & Malone, M. (1980). Towards explaining human culture: A critical review of the findings of worldwide cross-cultural research. New Haven, CT: HRAF. Lyotard, J.-C. (1984). The postmodern condition: A report on knowledge. Minneapolis: University of Minnesota Press. Marano, L. (1973). A macrohistoric trend toward world government. Behavior Science Notes, 1, 35-39. Murdock, G. P. (1940). The cross-cultural survey. American Sociological Review, 5, 361-370. Murdock, G. P., Ford, C. S., Hudson, A. E., Kennedy, R., Simmons, L. W., & Whiting, J. W. M. (2000). Outline of cultural cultural materials (5th ed. with revisions). New Haven, CT: Human Relations Area Files. Murdock, G. P., & Provost, C. (1973). The measurement of cultural complexity. Ethnology, 12, 379-392. Ostrom, C. W. (1990). Time series analysis: Regression techniques (2nd ed.). Thousand Oaks, CA: Sage. Peregrine, P. N. (2001a). Outline of archaeological traditions. New Haven, CT: Human Relations Area Files. Peregrine, P. N. (2001b). Cross-cultural comparative approaches in archaeology. Annual Review of Anthropology, 30, 1-18. Peregrine, P. N. (2003). Atlas of cultural evolution. World Cultures, 14(1), PP. NOS?. Peregrine, P. N., Ember, C. R., & Ember, M. (2000, April). Comparative analyses of cultural evolution using eHRAF. Paper presented at the annual 2000 meeting of the Society for American Archaeology, Philadelphia, PA. Peregrine, P. N., & Ember, M. (Eds.). (2001-2002). Encyclopedia of prehistory (Vols. 1-9). New York: Plenum.
14
Cross-Cultural Studies / MONTH YEAR
Popper, K. (1959). The logic of scientific discovery. London: Huchinson. Renfrew, C., & Cherry, J. (Eds.). (1986). Peer polity interaction and sociopolitical change. Cambridge, UK: Cambridge University Press. Wright, H. T., & Johnson, G. A. (1975). Population, exchange, and early state formation in Southwestern Iran. American Anthropologist, 77, 267-289. Yoffee, N. 1993). Too many chiefs (or safe texts for the 90s). In N. Yoffee & A. Sherratt (Eds.), Archaeological theory: Who sets the agenda (pp. 60-78). Cambridge, UK: Cambridge University Press. Peter N. Peregrine is an associate professor in and the chair of the Department of Anthropology at Lawrence University Melvin Ember is the president of the Human Relations Area Files of Yale University Carol R. Ember is the executive director of the Human Relations Area Files at Yale University.