Unlike classical software design, ERP projects customize a pre-existing ... Traditional models for predicting software implementation effort tie measures of code size and ...... Systems Inc.: Implementing ERP (Harvard Business. School, Boston ...
RO
GE ro
yl Ta
Predicting the implementation effort of ERP projects: empirical evidence on SAP/R3
or
up
·
·
Journal of Information Technology (2001) 16, 33–48
T E U L D
& Fr nc is G a
CH IAR A FRANCA LANCI Dipartimento di Elettronica e Informazione, Politecnico di Milano, Piazza Leonardo Da Vinci, 32, 20133, Milano, Italy
This paper investigates the impact of the technical size and organizational complexity of SAP/R3 projects on implementation effort. Traditional models for predicting software implementation effort tie measures of code size and programming complexity to development time. ERP projects shift a signi cant proportion of the implementation effort from code development to the parameterization of a pre-existing software package. At the same time, they move complexity from technical to organizational factors since they force companies to adapt to prede ned work processes embedded in the software. This paper rede nes the concepts of size and complexity for ERP projects and empirically veri es their impact on implementation effort. Speci cally, project size is measured in terms of the number of SAP modules and submodules that are implemented, while complexity is de ned as the organizational scope of the project in terms of users involved and overall company size. Hypotheses are tested on 43 SAP/R3 projects conducted in a cross-section of manufacturing companies. The ndings show that both the technical size and organizational complexity of projects are relevant drivers of implementation effort. The results indicate that implementation effort not only grows with the number of modules and submodules that are selected for implementation, but that SAP is found to require increasing resources to be implemented in larger companies and for a higher number of users, thus indicating that, while there is a technical component of effort that is independent of the organizational breadth of the project, each user adds an organizational component of costs.
Introduction A common experience among companies that have undertaken ERP projects is incurring high expenditures, which frequently outgrow their initial budgets by signi cant percentage values (cf. Saunders, 1999; Scheer and Habermann, 2000). In some cases, ERPs seem to have failed the cost-reduction promises that encouraged companies to embark on extensive replacements of their basic information technology (IT) applications (cf. Wagle, 1998; Stedman, 1999; Scheer and Habermann, 2000). However, the costs of licences charged by ERP providers seem to be decreasing and, furthermore, they represent only a fraction of the overall cost of ERP projects, which has been estimated at less than 10% over a 5-year period (cf. King, 1998; Mateyaschuk, 1999). ERP packages generally have high requirements for computing capacity, but hardware expenses, even including management costs, have been reported not to have increased signi cantly over the past few years (cf. Saunders, 1999). A larger and less predictable category of costs is related to implementation activities, which have generally proved more cumbersome and slower than originally forecasted (cf. Wagle, 1998; Cliffe, 1999; Davenport, 2000).
Traditional models for predicting and controlling software implementation costs are predominantly based on empirical analyses of the code-development activity, which used to constitute the most timeconsuming and less predictable phase of a project (cf. Putnam, 1978; Krishnakumar and Sukumaran, 1997). Unlike classical software design, ERP projects customize a pre-existing application package, thus causing a considerable reduction in code-development activities. The main prediction variables in traditional models of software implementation costs represent measures of the size and complexity of the project (cf. Putnam, 1978; Betteridge, 1992; Nesi and Querci, 1998). Size is typically measured either in terms of lines of code or functionalities to be developed, while complexity is a more qualitative and subjective evaluation of the programming dif culty of each functionality. Both variables need to be rede ned for ERP projects since, at least in principle, most codes do not need to be developed from scratch. Empirical models supporting the resource allocation process should change accordingly. However, the information systems (IS) literature provides little support for cost prediction and control activities for ERP projects and there is still a lack of scienti c studies identifying the determinants
Journal of Information Technology ISSN 0268–3962 print/ISSN 1466–4437 online © 2001 The Association for Information Technology Trust http://www.tandf.co.uk/journals DOI: 10.1080/02683960010035943
34 of implementation effort and empirically testing their actual relationship with costs. The objective of this paper is theoretical discussion and empirical testing of a model for predicting ERP implementation costs. The model draws on the traditional literature on software costs in that prediction variables are de ned along the size and complexity dimensions of a project. However, prediction variables account for changes in the implementation process brought about by the replacement of code development with customization. In particular, they address organizational aspects of project size and complexity, which become more relevant as organizational processes need to change and adapt to packaged software, as opposed to being matched by ad hoc code. The model is conceptually general, but it has been operationalized and tested for SAP/R3 as a mainstream ERP package. As discussed in the paper, focusing on one package has allowed a more precise operating de nition of the prediction variables, the accurate measurement of which requires an understanding of the technical and organizational features of the speci c ERP. In the remainder of this paper, the literature on software cost prediction is considered rst. Next, the paper presents its theoretical model and discusses research hypotheses for empirical testing. The subsequent section provides the operating de nition of variables and then the research methodology is detailed and results are presented. Finally, the management and research implications of the ndings are discussed.
Predicting software costs: from code to ERPs Traditional methods of predicting software costs make a distinction between two assessment activities, i.e. estimation of the implementation resources and their subsequent economic appraisal (cf. Putnam, 1978; Krishnakumar and Sukumaran, 1997). The latter needs values of unit costs for different resources, which can usually be calculated from data on previous projects and do not involve a priori estimates. Research efforts within software engineering economics have instead focused on estimation of the implementation resources, which entails more dif cult assumptions about the future requirements of a new project (Bohem, 1981; Fenton, 1991). Of the different resources expended by a software project, human time has been consistently documented as the most challenging to estimate reliably (cf. Fenton 1991). In this respect, ERP projects have proved similar to traditional software development. The professional IS literature has reported that human resources for ERP
Francalanci implementation activities show the highest variance across projects and are considered responsible for the main discrepancies between estimated and actual costs (cf. Gill, 1999; Scheer and Habermann, 2000). Methods predicting human resources for software development can be classi ed as parametric or analogical, providing general prediction laws and speci c reference cases, respectively (Walkerden and Jeffery 1997). Analogical models are based on a database of previous software projects, from which they obtain an estimate of the human resources needed for a new project as an average across a subset of similar initiatives. The selection of similar projects is usually supported by quantitative techniques that calculate and weigh various similarity factors based on project descriptions in the database (see, for example, the ESTOR technique (Software Engineering Laboratory Series, 1993) and the ANGEL tool (Shepperd et al., 1996)). The primary limitation of analogical methods is that they require a signi cantly large database in order for quantitative techniques to deliver a subset of projects that are reliably similar to the new initiative. In practice, only large organizations can populate a proprietary database of projects and assume its high maintenance costs (cf. Darrel, 1988). By extracting general laws from previous experience, parametric methods can be more readily applied to new initiatives and transferred to different organizational contexts, despite their lower degree of precision in evaluating the qualitative aspects of projects (cf. Briand et al., 1992; Srinivasan and Fisher, 1995). Early parametric methods used to predict implementation effort by tying a measure of the size of a software system to the human resources needed to implement it (cf. Walston and Felix, 1977; Putnam, 1978; Bailey and Basily, 1981; COCOMO Basic in Bohem, 1981). Size was rst measured in terms of lines of code (LOC), the estimation of which was translated into man months by a mathematical function which usually had the following exponential form: man – months = a ´ LOCb = e . Size was considered easier to estimate ex ante than effort, particularly since human time had been found to grow more than linearly with the scale of the project and, in most cases, beyond initial predictions (cf. Bohem, 1981). However, lines of code have been widely criticized as a measure of software size, both because they are tied to a speci c programming language and because their operating measure is subject to considerable uctuations depending on how individual programmers distribute their code into lines. Function points have been proposed as an alternative measure of software size as these are conceptually more general and comparable across projects or codedevelopment standards (cf. Albrecht, 1979). Function
Implementation effort of ERP projects points represent an estimate of the number and variety of functionalities in a software system and are traditionally measured as a weighed sum of the number of inputs, outputs, queries, archives and interfaces of the system to be implemented. Implementation effort has been demonstrated to be accurately predicted from an estimate of function points by a linear function, which, from a theoretical standpoint, indicates that the number and variety of functionalities are directly responsible for the human time required to design a new software system (cf. Betteridge, 1992). With ERPs the traditional measures of system size in terms of lines of code and function points are not necessarily related to implementation effort since software does not need to be developed from scratch. For example, an ERP with a high number of lines of code and functionalities can require a limited effort in being implemented in a speci c company if it happens to meet organizational requirements as it is. However, packages are still associated with an intuitive assessment of their size, which is typically not provided a precise operating de nition but seems to represent a fundamental driver of choice for companies analysing the ERP market at a feasibility stage (cf. Mayer, 1997). Companies have been reported as choosing smallersize packages from among over 50 suppliers worldwide, particularly when their turnover is not large and they need to tally with limited budgets (cf. Eskow, 1998). There is also evidence from the numerous case studies that have been published on ERPs that implementing only part of the full-size package is considered as a means of reducing or delaying costs (cf. Soh et al., 2000; Sprott, 2000). System size is still held as a driver of implementation effort, but it has undergone a conceptual change and needs to be provided a new operating de nition. New contextual factors also need to be accounted for in order to explain the variance in implementation effort across projects of a similar size (cf. Cliffe, 1999; Scheer and Habermann, 2000). Traditionally, contextual factors were selected from among the drivers of complexity for code development for taking domaindependent variations in the dif culty of programming tasks into account (cf. Putnam, 1978; Betteridge, 1992; Nesi and Querci, 1998). Multiple dimensions of complexity have been considered, including the required level of performance, the choice between distributed and centralized processing and the inherent algorithmic dif culty of the application domain. Once again, these contextual factors do not directly apply to ERP projects due to the partial replacement of codedevelopment activities with the parameterization of a pre-existing software package. The adoption of packages causes a shift of implementation complexity from technical to organizational factors since it relieves
35 programmers from part of the code-development effort while inevitably forcing companies to adapt to prede ned procedures embedded in the software (cf. Lassila and Brancheau, 1999; Soh et al., 2000). Accordingly, models predicting implementation effort in ERP projects need to incorporate new drivers of complexity that account for the factors that in uence the ease of organizational change and that may favour the deployment of new software procedures. The IS literature documents numerous case studies that exemplify organizational change in ERP projects and testify to its impact on overall implementation effort (cf. Welti, 1999; Soh et al., 2000). However, prediction models generalizing case knowledge are mostly commercial and have not undergone the process of scienti c scrutiny. They typically do not focus on a speci c project phase, such as implementation, while they provide comprehensive estimates of costs, including maintenance and infrastructural expenses (cf. Gibbons Paul, 1998). For example, Strategy Partners International promotes one of the most publicized tools for predicting and controlling the costs of an SAP system, applying the total cost of ownership method (Gümbel and Klagges, 1999). From public sources of information, this tool seems to provide a set of cases illustrating the different classes of cost in an SAP system and the plug-in functions that help attribute operating expenses to different organizational units based on their actual usage of SAP’s functionalities. Overall, professional methods seem to focus on traditional technical expenses and not to account for the organizational costs involved in ERP deployment initiatives, which still need empirical veri cation.
Research hypotheses Size and complexity can be considered as general drivers of the implementation effort that conceptually apply to both traditional and ERP software projects. However, their operating de nition should conform to the changes in the implementation process and in the nature of its tasks, which differentiate ERP projects from software development. The sequence of design phases for ERP implementation does not differ from the standard software development process, but the objectives and the nature of work involved in each phase have been signi cantly rede ned. Table 1 gives a de nition of ERP implementation phases that is consistent with the reference manuals of most commercial packages and contrasts it against traditional de nitions for software development (cf. Sommerville, 2000). ERP implementation phases precede software development in delivering their output since parameterization is automatically translated into code by tools
Francalanci
36 Table 1
ERP implementation phases and objectives
Implementation phase
De nition for ERPs
De nition for traditional software development
Phase 1: requirements analysis and speci cation
It analyses organizational processes and compares them with the procedures embedded in the ERP package in order to distinguish between modules that can be parameterized and modules that need reprogramming. Functional and data requirements are speci ed for modules that need reprogramming
It de nes users’ functional and data requirements in a non-technical language
Phase 2: conceptual
It parameterizes modules that do not need reprogramming and produces a technical speci cation of the functional and data require ments for modules that need reprogramming
It produces a speci cation of the functional and data requirements in a technical, unambiguous language as a reference for code development
Phase 3: code development and veri cation
It develops and veri es software code for modules that need reprogramming
It develops and veri es software code according to requirements speci cations
Phase 4: testing and installation
It tests all modules against requirements as well as quality parameters
It tests code against requirements as well as quality parameters
design
assisting ERP design and is not followed by codedevelopment activities. Code is only developed for a subset of modules that need reprogramming. However, in order for parameterization and reprogramming to be independent and concurrent activities, an ERP system must comply with the principles of modularity (cf. Sommerville, 2000). A module is a part of a software system that exchanges information and services with other modules, but is not affected by their change as long as their interfaces are not modi ed. Reprogramming tends to propagate its effects on multiple software modules in non-modular systems, which, as a consequence, cannot be modi ed independently. The practical relevance of modularity is witnessed in a variety of case studies, either for a whole ERP package or for particular subsets of its functionalities (cf. Sprott, 2000). On the other hand, ERP suppliers emphasize modularity as one of their chief quality goals, which enables their clients to implement a package incrementally by plugging and playing with different modules. By assuming that ERPs are modular, as they are supposed to be, it is correct to consider parameterization and reprogramming as independent design phases and to regard modules as separate parts of a system which can be implemented and modi ed in isolation. Under this assumption, the implementation effort can be hypothesized to grow with the number of modules of an ERP system that are implemented within a speci c project. Note that, from a theoretical standpoint, the number of modules represents a measure of project size, which is also conceptually similar to traditional function points since it is related
to the number and variety of functionalities required by an organization. However, it accounts for the practical changes in the implementation process by grouping into modules functionalities that must de facto be implemented as one. This leads to the rst research hypothesis. H1: There exists a positive correlation between the size of an ERP project measured as the number of modules that are implemented and the implementation effort measured as the human time devoted to implementation activities. The concept of a module can be de ned at different levels of detail by providing a hierarchical partitioning of modules into submodules, which corresponds to the actual logical structure of ERPs. Clearly, the greater the detail, the more precise the estimate of implementation effort. Organizations may require the implementation of a different number of submodules for each module, with a consequently varying implementation effort. The maximum detail that can be attained is determined by the modularity of the speci c ERP and, in principle, it can reach varying levels in different packages. However, a correlation between the number of modules and implementation effort should exist and be veri ed at all levels. H2: There exists a positive correlation between the effort of implementing a module of an ERP system measured as the human time devoted to implementation activities and the size of the module measured as the number of submodules that are implemented.
Implementation effort of ERP projects Note that H2 does not imply H1. Even if the implementation effort for a module is found to be positively correlated with the number of implemented submodules, correlation may not be veri ed at a more aggregate level when one or a few modules involve the implementation of other modules and absorb most of the effort. If modularity is instead veri ed at all levels, as it should be, size can be hypothesized to be a predictor of the implementation effort irrespective of the detail in the de nition of modules. The implementation effort for an ERP package does not depend solely on the number of modules and submodules, as is unquestionably clear from the variance of costs across projects and organizations documented in the literature (cf. Cliffe, 1999; Scheer and Habermann, 2000). Contextual factors can affect the complexity of implementation activities and related effort. It should be observed how parameterization and code-development tasks are signi cantly different from each other in this respect. Parameterization consists of a sequence of standard, predetermined activities that need to be ful lled for each module and is barely in uenced by contingent drivers of complexity. Examples of parameterization tasks are the de nition of cost and pro t centres, the identi cation of currency and time standards, the selection of names for prede ned entities, the speci cation of priorities and control rules for different work procedures. The extent of reprogramming is instead a contingent decision that hinges on the degree to which organizations can accept the procedures embedded in the ERP package. Reprogramming is a more cumbersome activity than parameterization and involves an additional effort. The fact that reprogramming increases the implementation effort is related to the very reason why ERP packages have been so broadly adopted in organizations, that is to replace obsolete legacies rapidly and cost-effectively (cf. Gill, 1999). The discrepancies between organizational processes and ERPs’ functionalities decrease with the extent of reprogramming, but so do cost reductions. Half of the overall budget for ERP projects has been reported to be due to reprogramming, which has been held as a primary cause for delays and extra expenses (cf. Cotteleer et al., 1998; Gill, 1999; Scheer and Habermann, 2000). It could be argued that a reprogramming effort can be estimated from lines of code or function points when the degree of organizational acceptance of ERP’s functionalities is determined. A rst criticism of this viewpoint is that this estimate can only be obtained after requirements analysis at the end of phase 1 (see Table 1) and, hence, it cannot help managers in a preliminary comparison between different packages. Companies often resort to more aggregate assessments of the extent to which a package satis es their
37 requirements by using high-level procedural descriptions of software functionalities, which are usually provided by ERP suppliers (cf. Wagle, 1998; Soh et al., 2000). Besides being prone to inaccuracies, these functional analyses require a qualitative research approach, which represents a complement rather than a replacement for the quantitative results of parametric models. As a last observation, reprogramming activities modify existing software as opposed to developing new functionalities from scratch and it may be empirically dif cult to disentangle reprogramming from parameterization activities occurring on the same module. Without procedural knowledge of the package and the organization, measurable drivers of a reprogramming effort can be selected from among contextual variables that in uence the ease of organizational change, which a priori would reduce the need for modifying the package. The literature provides consolidated knowledge on the factors affecting the ease of organizational change and on their operating measures (cf. Salancik and Pfeffer, 1978; Zalesny and Ford, 1990). The ease of change has been theorized to be driven by factors related to the organizational attitude towards change and to the actual resistance that a speci c organization can exert against it (cf. Scott, 1992). A fundamental driver of the attitude towards change is organizational size. Size has been found to be associated with higher bureaucratization, lower exibility and slower change processes (cf. Nohria and Eccles, 1992; Brynjolfsson et al., 1994; Malone, 1998). Over the past 10 years, the re-engineering literature has also indicated that larger organizations tend to incur higher costs, which has built consensus on the need for change and developed an of cial path for transformation (cf. Davidson, 1993). Hence, it is expected that larger organizations can exert greater resistance against the changes imposed by the adoption of a package and require more extensive reprogramming with a consequently greater implementation effort. H3: There is a positive correlation between organizational size and implementation effort measured as the human time devoted to implementation activities for individual modules and for the whole ERP system. The scope of change is generally considered the primary driver of the actual resistance that is prompted by organizations (cf. Davidson, 1993; Davenport and Stoddard, 1994). A straightforward and consequential measure of scope is the breadth of change, that is the size of the organizational units affected by change (cf. Davenport and Stoddard, 1994). Accordingly, hypothesis 4 posits that the number of nal users of the ERP package and of each of its modules is positively correlated with the corresponding implementation effort as
Francalanci
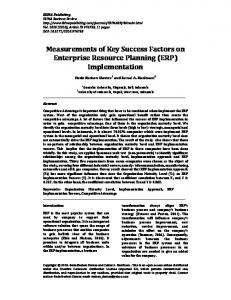
38 it increases resistance and, in turn, the extent of reprogramming required for mitigating organizational change. Note that measures of scope related to the depth of change, which are also emphasized in the literature, would be related to qualitative aspects of the discrepancies between ERP’s functionalities and organizational processes and are less suitable for quantitative assessments. H4: There is a positive correlation between the number of nal users and the implementation effort measured as the human time devoted to implementation activities for individual modules and for the whole ERP system. Cost reductions obtained during implementation by limiting the extent of reprogramming may be partly counterbalanced by greater expenses in subsequent project phases when organizational change is enacted and users are called to adapt to new work processes. These expenses can be signi cant, as indicated by the existence of an ERP project phase entirely devoted to user training, which starts during implementation and continues at length thereafter (cf. Welti, 1999). However, the project team is formally dismissed at the end of the implementation phase and subsequent activities are accomplished by members of the organization with limited support by technicians (cf. Welti, 1999). Hence, the source of these expenses is mainly organizational and will require reconsideration of its theoretical drivers and operating measures. Given the focus of this paper on implementation effort, the costs of organizational change following the nal testing and installation of a system is left as the subject for future research. Figure 1 summarizes the variables that have been hypothesized to be positively correlated with implementation effort. Overall, testing hypotheses H1–H4 helps make a distinction between technical and organizational drivers of the implementation effort for ERPs. The impact of the size of ERPs provides an assessment of the theoretical implementation effort and resulting costs predicted from a technical perspective, while
Contextual factors Organizational size Total number of users Per-module number of users Size Total number of modules Implementation effort Per-module number of Human resources submodules
Implementation process
Figure 1 Drivers of the implementation effort of an ERP project: size of the software product and contextual drivers of organizational requirements for customization
contextual factors help explain the variance in costs due to the organizational complexity of the project.
Variable de nition and operationalization The operating de nition of variables and subsequent testing of research hypotheses have been referred to the implementation of SAP/R3 because it is a mainstream ERP package. Limiting empirical veri cations to one package allowed a more speci c de nition of variables based on an in-depth preliminary analysis of SAP’s implementation process. The knowledge that has been acquired with this rst investigation could serve as a basis for future generalizations, although separate testing for individual packages would also be useful for providing benchmarks and comparing implementation costs across different ERPs. The beginning and end times of the implementation phase have to be operationalized rst in order for all variables to be measured within the same time-frame. An ERP is usually implemented as a joint effort between a client and a consulting company that provides the technical knowledge about the package. Accordingly, the beginning of the implementation phase has been de ned as the time when the consulting company starts providing services that will be compensated for according to an explicit contractual agreement. Note that feasibility analyses preceding implementation are usually conducted by the client company either autonomously or with the aid of a third-party consulting rm. The end of the implementation phase has been de ned as the time when the client company has acquired suf cient knowledge for managing the ERP package, which in SAP projects corresponds to the of cial start of post-installation services (cf. Welti, 1999). Both times can be univocally and easily derived from the contract between the client and consulting companies. The implementation effort, the size of the ERP package and the contextual variables have been provided an operating de nition within this time-frame. Implementation effort The human resources involved in the implementation process of an SAP system include personnel from both the client and consulting companies. The former are referred to as key users and their role is to provide knowledge on organizational processes and acquire the know-how needed to manage the system after its implementation. These human resources are divided into two functional units with programming and system management competencies, respectively and multiple operating teams, each of which is responsible for the
Implementation effort of ERP projects
39
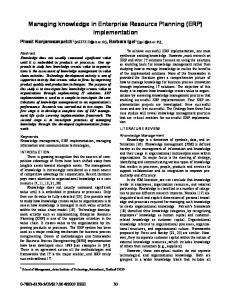
implementation of an SAP module. Programmers and system managers are dynamically selected from functional units and assigned to operating teams as required. The project is co-managed by a client and a consulting executive, unlike traditional software development, the management of which was considered a technical responsibility. Figure 2 shows the typical structure chart of an SAP project. The implementation effort for the whole project is operationalized as the total man months for the project management, operating teams and functional units. The implementation effort for each module includes the man months for the corresponding operating team, the man months of programmers and systems managers who have been assigned to the operating team and a share of the total project management time proportional to the man months of the operating team. In order to improve the accuracy of effort as a proxy of costs, the differences in salary across project participants have been accounted for by multiplying the value of each person’s man months by the ratio between individual and average salaries. Note that the project’s organizational structure is formally instituted at the beginning of the implementation phase and is usually dismissed at its end. The objectives and accomplishments of different teams and functional units as well as individual tasks are recorded over time within the project’s documentation. Unlike traditional software projects, the explicit inclusion of users within the structure in Figure 2 reduces the approximation that may result from excluding the additional effort caused by the interactions between the project team and the rest of the organization. Size of the ERP package An operating de nition of modules and submodules was obtained through preliminary interviews with managers taking part in this research, usually project
Project manager from the consulting company + Project manager from the client company
Pool of ABAP programmers
Steering committee
Functional Specifications Teams for module implementation
Pool of ABAP programmers
Pool of system managers
Consultants + key users
ABAP programmer s + key users
System managers from consulting and client company
Figure 2 project
Organization breakdown structure of an SAP
managers from consulting companies. A recurrent statement was that SAP is unquestionably composed of independent modules and submodules from which a company may select any subset for implementation. However, when asked to list and de ne modules and corresponding submodules, the managers provided different answers. Only approximately one-third of modules and submodules were cited by all managers and provided equivalent de nitions. An agreement was reached with a second cycle of interviews where the managers had been submitted a list of modules and submodules for veri cation which had been obtained by selecting the most detailed de nitions from their initial answers. Five modules and 59 submodules were identi ed with, on average, 12 submodules for each module. The modules and corresponding submodules are de ned in Appendix 1. Note that the managers providing these de nitions were also responsible for subsequent data collection, which bene ted from a common language. Also note that SAP’s manuals include standard de nitions of nine modules, which are consistently reported in both technical and promotional documents. However, not all of the standard modules were recognized by the project managers as modular software components that can be implemented in isolation. The size of a module is operationalized as the number of submodules that are implemented in a particular project. The overall size of the package is de ned as the summation of module sizes. Contextual variables Organizational size is provided by two operating measures, i.e. total revenue and total number of employees. This is recommended in order to obtain a more accurate testing of the research hypotheses, since total revenue re ects the market size of a company while the number of employees facilitates crossindustry comparisons when companies operating in separate sectors have signi cantly different revenues with a similar number of employees (cf. Brynjolfsson et al., 1994). The hypotheses will be separately tested with both indicators of size and the results compared against their different conceptual implications. The number of users of the whole system is operationalized as the total number of licences included in the operating expenses for the SAP system. The number of per-module users can be derived from a description of the licences in contractual agreements. Licences are grouped according to the modules that they grant access to and their cost is calculated accordingly. Hence, the number of users for a module can be operationalized as the number of licences that grant access to that module.
Francalanci
40 Methodology and results Ten consulting companies were asked to participate in the study, eight of which actually provided data on a total of 43 SAP implementation projects. These companies did not exclusively implement SAP’s ERP package, but explicitly indicated SAP as their preferred case for this study. The entry point in each company was a partner supervising ERP initiatives and our contacts for operating research activities were ERP project leaders. In addition to preliminary interviews, which were carried out in order to de ne the scope of the project and operationalizations of the variables cooperatively (see the previous section), data were collected by means of frequent and personal interactions with the consulting companies. The companies that provided data were invited to a colloquium where the research results were presented and discussed. A questionnaire was prepared for collecting both quantitative data on SAP projects and qualitative descriptions for helping in interpretation of the ndings. The questionnaire was discussed with project leaders and answers were interactively cross-checked for consistency after a rst data gathering. In order to increase the consistency of the data, the following constraints were imposed on sample projects: they had to be formally completed before data collection, they had to be managed by a single consulting company during the entire implementation period, thus excluding co-managed initiatives and costly replacements of the consulting company and they had to be large projects aimed at the deployment of multiple modules from the outset. Projects were conducted during the period 1996– 2000 and lasted 18 months on average. The client companies were mostly European (95%) with an average revenue of $200 million and belonged to a cross-section of manufacturing industries, including chemicals, textiles and electronics. The average implementation cost of the projects was $1.7 million, which the consulting companies rated as medium to high for the European market. The project leaders estimated the implementation costs within this sample as representing approximately 60% of the total cost of the projects, including licences and maintenance for a 5-year period. On average, ve SAP modules and 30 submodules were implemented in each project with 18 per-module users. Statistical approach and methodology Hypotheses H1–H4 were tested by measuring the independent effects of size and the contextual variables on implementation effort using multivariate linear regression (cf. Draper and Smith, 1981). The generalized
estimating extension of the generalized linear model random estimator (Liang and Zeger, 1986) was chosen for the analyses as an advanced regression technique for correcting for heteroscedasticity. Data in the form of industry cross-sections were pooled in order to increase the ef ciency of the estimation (cf. Ostrom, 1990). The pooled sample was then corrected in order to deal with potential heteroscedasticity by applying the Huber–White sandwich estimator of variance in place of the traditional variance calculation (cf. Huber, 1967; White, 1982). This alternative estimator produces consistent standard errors even if the residuals across groups are not identically distributed. Independent variables were standardized in order to be able to compare the magnitude of their corresponding coef cients and evaluate their weight in explaining the implementation effort. Tables 2–7 report the results with both standardized and nonstandardized variables, as the latter can be useful as prediction benchmarks. Fitted regression models Models M1 and M2 tested the correlation between implementation effort and the independent variables for the whole ERP package, as hypothesized in H1, H3 and H4. Models M3 and M4 veri ed the correlation for individual modules, as hypothesized in H2, H3 and H4 and, hence, were tested for different modules. Testing was performed with two indicators of company size, total revenue (M1 and M3) and number of employees (M2 and M4). M1: M2: M3: M4:
IE IE IE IE
= = = =
c11 c11 c11 c11
+ + + +
c12SP + c13TR + c14TNU c12SP + c13NE + c14TNU c12SM + c13TR + c14MNU c12SM + c13NE + c14MNU
IE is the implementation effort, SP is the size of package, SM is the size of module, TR is the total revenue, NE is the number of employees, TNU is the total number of users and MNU is the per-module number of users. Tables 2–7 report the results of the linear regressions for models M1–M4 above. The models are given as columns and the coef cients for the variables included in each model are given as rows. Each row is identi ed by the name of the corresponding variable. Tables 2–7 report the absolute values of the coef cients and the standardized values and corresponding errors are given in parentheses. Note that the absolute and standardized variables have the same level of significance, which is reported in Tables 2–7 (cf. A and Clark, 1990). Also note that revenue is measured in millions of dollar and the absolute value of the implementation effort is estimated in person days.
Implementation effort of ERP projects Empirical testing was also performed by controlling for two critical variables that were consistently emphasized by the managers as being main drivers of cost variance across different SAP projects. The rst is related to the high turnover of personnel within consulting companies, which can cause major changes of key individuals in a project and consequent relearning costs. The second driver of cost variance is related to a technical feature of legacy systems, that is the existence of an integrated relational database, which can greatly simplify the parameterization of data and their migration to the SAP system. Both variables were consistently found to be non-signi cant when included in models M1–M4 and are not reported in Tables 2–7.
Discussion Overall, the models were statistically signi cant, thus indicating that the technical size and organizational complexity of projects are relevant drivers of implementation effort, as hypothesized in H1–H4. From a statistical perspective, models that include both technical and organizational drivers of effort provide more accurate estimates than software engineering prediction models, which traditionally take an exclusively technical perspective. Findings The model variables were generally more signi cant for individual modules (Tables 3–7) than for the whole package (Table 2). Conceptually, this result is not surprising, since it indicates a bene cial effect of greater modelling detail on the accuracy of predictions. However, the signi cance of the aggregate prediction model was a necessary condition for H1 to be veri ed, as a signi cant correlation between effort and technical size for individual modules does not imply a corresponding correlation at a package level. A nonsigni cant aggregate model would suggest that modularity is not veri ed at a package level, although it may be veri ed at a module level (see the section on the research hypotheses). The signi cance of the size of package and size of module veri ed the modularity of SAP/R3 at both a package and module level. Each submodule was estimated to add between 12 and 32 person days to the implementation effort of the corresponding module (Tables 3–7) and, on average, 19 person days to the overall implementation effort (see Table 2), according to the values of the non-standardized coef cients. A signi cant negative intercept for the nancial module (see Table 3) was related to four
41 mandatory submodules that were necessarily implemented in all projects, namely general ledger, accounts receivable, accounts payable and asset accounting (see Appendix 1). Mandatory submodules are technically modular and can be independently modi ed, thereby not affecting the signi cance of prediction models negatively. However, they provide core functionalities that always accompany the implementation of the nancial module. A non-signi cant intercept for other modules and for the whole package would indicate that companies can choose to implement any number of submodules and, more broadly, would suggest that they do not incur xed costs that are not explained by independent variables. The standard values of the coef cients had the same order of magnitude at both a module and package level. Furthermore, at a package level, the independent variables also had similar values to the standardized coef cients (see Table 2). At a module level, the number of users showed a higher standardized coef cient than the total revenue and number of employees for modules providing functionalities to line organizational units, that is procurement (Table 5) and sales and distribution (Table 7). Conversely, the total revenue and number of employees had a greater weight for modules designed for non-line units, that is nancial (Table 3) and production management (Table 6). Users in line units are more likely to be able to exert an individual resistance to change, since their work is mission critical and their rejection of new software procedures would have immediate negative effects. As a consequence, the number of users is a primary driver of the reprogramming effort. Non-line units play a lateral role instead and, as a consequence, the overall size of the organization that they serve is the main driver of their capability for resisting change. Note that each additional user was estimated to add between 1.5 and 6 person days to the implementation effort of the corresponding module (Tables 3–7) and, on average, 3 person days to the overall implementation effort (Table 2), according to the values of the nonstandardized coef cients. The implementation effort for the controlling module showed a signi cant correlation with the number of submodules and total number of users, while total revenue and number of employees were found to be non-signi cant (see Table 4). A likely reason for this lack of correlation is that the structure of the controlling module was a consequence of previous parameterization and reprogramming choices that were de ned during the implementation of other modules. Controlling variables are modelled within the nancial and sales and distribution modules, while cost objects and reporting procedures are de ned within the materials management and production planning
Francalanci
42
Table 2 Parameter estimates, p-values and goodness-of- t statistics (Pearson x2-statistic) for a taxonomy of tted regression models including the independent effects of size and contextual factors on the implementation effort of a SAP project Model M1a Intercept
–131.367 (122.160 19.368 (3.765 0.978 (0.085 – – 3.259 (0.348 1427.22
Size of package Total revenue Number of employees Total number of users c
2
(38)
a
Model t (p > x2) = 0.0001.
M2a
*
p < 0.05,
and and and and and and
–0.061 0.057) 0.324** 0.063) 0.455** 0.040)
and 0.411*** and 0.044)
**
p < 0.01,
***
–177.531 (80.023 18.412 (2.638 – – 0.486 (0.019 4.331 (0.165 2131.37
and and and and
–0.083* 0.037) 0.308*** 0.044)
and and and and
0.520** 0.021) 0.546*** 0.021)
p < 0.001.
Table 3 Parameter estimates, p-values and goodness-of- t statistics (Pearson x2-statistic) for a taxonomy of tted regression models including the independent effects of size and contextual factors on the implementation effort of SAP’s nancial module Model M3a Intercept
–114.480 (23.482 31.143 (3.749 0.132 (0.018 – – 1.619 (0.484 4772.47
Size of module Total revenue Number of employees Per-module number of users c
2
(36)
a
Model t (p > x2) = 0.0001.
M4a
*
p < 0.05,
and and and and and and
–0.358*** 0.073) 0.973*** 0.1117) 0.411*** 0.055)
and 0.253*** and 0.076)
**
p < 0.01,
***
–122.215 (26.857 31.625 (3.934 – – 0.070 (0.013 1.865 (0.632 6307.65
and and and and
–0.382*** 0.084) 0.988*** 0.123)
and 0.507*** 0.094) and 0.291** and 0.099)
p < 0.001.
Table 4 Parameter estimates, p-values and goodness-of- t statistics (Pearson x2-statistic) for a taxonomy of tted regression models including the independent effects of size and contextual factors on the implementation effort of SAP’s controlling module Model M3a Intercept
0.054 (1.243 19.583 (0.211 –0.001 (0.002 – – 5.724 (0.155 15.51
Size of module Total revenue Number of employees Per-module number of users c
2 a
(37)
Model t (p > x2) = 0.0001.
M4a
*
p < 0.05,
**
and and and and and and
0.001* 0.007) 0.812*** 0.008) –0.001 0.007)
and 0.350*** and 0.007)
p < 0.01,
***
p < 0.001.
0.113 (1.168 19.576 (0.177 – – –0.001 (0.001 5.767 (0.159 14.32
and and and and
–0.002 0.006) 0.812*** 0.006)
and and and and
–0.007 0.007) 0.353*** 0.008)
Implementation effort of ERP projects
43
Table 5 Parameter estimates, p-values and goodness-of- t statistics (Pearson x2-statistic) for a taxonomy of tted regression models including the independent effects of size and contextual factors on the implementation effort of SAP’s procurement module Model M3a Intercept
–0.795 (4.129 12.360 (0.490 0.262 (0.007 – – 3.923 (0.090 533.06
Size of module Total revenue Number of employees Per-module number of users c
2
(37)
a
Model t (p > x2) = 0.0001.
M4a
*
p < 0.05,
and and and and and and
0.001 0.006) 0.182*** 0.008) 0.313*** 0.007)
and 0.541*** and 0.010)
**
***
p < 0.01,
–11.877 (18.503 12.434 (2.095 – – 0.130 (0.017 4.577 (0.328 1629.00
and and and and
–0.011 0.022) 0.181*** 0.031)
and and and and
0.356*** 0.043) 0.632*** 0.044)
p < 0.001.
Table 6 Parameter estimates, p-values and goodness-of- t statistics (Pearson x2-statistic) for a taxonomy of tted regression models including the independent effects of size and contextual factors on the implementation effort of SAP’s production management module Model M3a Intercept
–12.412 (13.050 16.445 (1.240 0.540 (0.023 – – 1.950 (0.244 2807.51
Size of module Total revenue Number of employees Per-module number of users c
2
(38)
a
Model t (p > x2) = 0.0001.
M4a
*
p < 0.05,
and and and and and and
–0.016 0.015) 0.309*** 0.022) 0.685*** 0.027)
and0.283*** and 0.032)
**
p < 0.01,
***
2.880 (38.420 14.221 (2.877 – – 0.260 (0.019 3.364 (0.249 2548.10
and and and and
0.025 0.043) 0.247*** 0.053)
and and and and
0.745*** 0.049) 0.489*** 0.033)
p < 0.001.
Table 7 Parameter estimates, p-values and goodness-of- t statistics (Pearson x2-statistic) for a taxonomy of tted regression models including the independent effects of size and contextual factors on the implementation effort of SAP’s sales and distribution module Model M3a Intercept
7.647 (4.566 15.146 (0.606 0.066 (0.006 – – 3.906 (0.062 280.36
Size of module Total revenue Number of employees Per-module number of users c
2 a
(35)
Model t (p > x2) = 0.0001.
M4a
*
p < 0.05,
**
and and and and and and
0.014 0.008) 0.229*** 0.009) 0.126*** 0.011)
and 0.739*** and 0.011)
p < 0.01,
***
p < 0.001.
–1.123 (4.269 16.024 (0.620 – – 0.038 (0.003 3.923 (0.048 190.63
and –0.002 and 0.008) and 0.242*** and 0.009)
and and and and
0.164*** 0.013) 0.742*** 0.009)
Francalanci
44 modules. As a consequence, the organizational component of the controlling module’s implementation effort was partly enclosed in earlier implementation activities and the controlling module’s measurable effort was primarily related to the number of submodules that were required, which showed the highest value of the standardized coef cient. Limitations The technical and organizational complexities of projects represent conceptually general drivers of implementation effort. However, their operating de nition in this research was speci c to SAP/R3 and, hence, the quantitative results cannot be applied in the prediction of implementation efforts for other ERP packages. A fundamental issue in the generalization of operating de nitions is to identify a classi cation of modules and corresponding submodules that applies to different packages. Technical manuals of ERP packages typically include a high-level classi cation of modules, which could easily be generalized, but they do not document submodules systematically. Although complex, a classi cation of modules and submodules is necessary in order to replicate this study for different packages and obtain benchmarks of their implementation costs that can be cross-compared. It should be noted that a general de nition of submodules would also provide managers with basic qualitative knowledge of ERP functionalities and actual modularity, which could considerably simplify comparison of different packages. However, such a general de nition is currently unavailable (cf. Ragowsky and Adams, 1998). Residuals, that is discrepancies between actual and predicted implementation effort, have been found to have a non-signi cant correlation with the total person months of projects. This indicates that the projects in the study sample showed no evidence of scale economies and, from a statistical perspective, supports the use of a linear prediction model. However, additional testing for a broader range of total person months could be helpful in uncovering possible scale effects and re ning prediction models accordingly. This study has focused on implementation costs and included organizational drivers of cost. However, the organizational complexity of projects has an impact not only on implementation effort, but also on the cost of organizational changes subsequent to the deployment of the package. Measuring these costs would represent an important complement of the results of this study because of the documented relevance of organizational costs (cf. Fan et al., 2000) and their trade-offs with implementation costs. A greater implementation effort due to more extensive reprogramming can reduce subsequent organizational changes by increasing the t
between the package and a company’s processes while, vice versa, a less expensive implementation process may delay as opposed to eliminating costs. Quantitative assessments of organizational costs, together with qualitative analyses of the relationship between organizational requirements and ERP’s functionalities, would represent a valuable extension of this study.
Conclusions and implications The results of this study demonstrate that the technical size of software is not suf cient for predicting the implementation effort of an ERP system accurately, while organizational measures of project complexity are also critical drivers of effort. The positive correlation between effort and organizational size and number of users indicates that a package requires increasing resources in order to be implemented in larger companies. This is consistent with previous IS research, which has indicated that size is responsible for a more cumbersome effort in creating consensus on new work processes, a more dif cult elicitation of requirements and, overall, greater resistance to the organizational change that typically accompanies IS initiatives (cf. Nohria and Eccles, 1992; Scott, 1992). In ERP projects, these factors translate into a lower acceptance of the work processes embedded in the package and more extensive and resource-consuming reprogramming. It is important to note that size is likely to be only one of several organizational variables that contribute to resistance to change and consequent additional effort. In the practice of business, managers make decisions on software in conjunction with decisions on other organizational variables, which could also be related to the overall implementation effort of an ERP package. However, in this study, size was found to explain a signi cant percentage of the variance in implementation effort and the inclusion of more speci c variables should be guided by a strong theoretical basis that ensures coherent, cumulative results (Bakos and Kemerer, 1992). Usually, companies implement a package or a module for the majority or all of their potential users. This large organizational breadth of projects may be related to the conviction that parameterization involves xed costs independent of the number of users and subject to economies of scale. This belief is supported by the professional literature (cf. Gill, 1999; Scheer and Habermann, 2000) and has been reported as a recurring orientation of managers in several case studies (cf. Welti, 1999). The results show a positive correlation between implementation effort and the total number of users, thus indicating that, while there is a technical component of effort that is independent of
Implementation effort of ERP projects the organizational breadth of the project, each user adds an organizational component of costs. The magnitude of the variable organizational costs reduces returns from economies of scale and suggests that prototyping ERPs for a subset of their users may yield economic bene ts. The advantages of this organizational prototyping are uncommon in software projects and should be inspected by future research more accurately. It may be found that, in order to delay expenses, companies should consider the organizational prototyping of packages as an alternative to reducing the technical scope of projects. On the contrary, a primary concern of managers during budgeting is de ning the scope of ERP projects in terms of the modules to be implemented (cf. Cliffe, 1999; Sprott, 2000). Findings have shown that the effort for a module varies with the number of submodules that are selected for implementation. This supports the de nition of scope for an ERP project as being the number of implemented submodules, contrary to the recommendations of ERP suppliers who advertise higher level modules as the unit for project scope and incremental deployment. As observed by Sprott (2000), a dearth of qualitative, public-domain knowledge about ERP packages is in fact responsible for the lack of detail in the choices of managers, who usually view ERP packages as black boxes that offer a certain set of functionalities and ignore how these functionalities have been technically organized into modules and submodules. Findings have proved that this lack of detail is likely to affect managers’ ability to formulate accurate budgets and control related expenses. Furthermore, the signi cance and explanatory power of both technical and organizational independent variables vary across modules. This suggests that predicting the implementation effort for individual modules separately is advisable in order to select the most appropriate set of predictors and obtain more reliable estimates. The modular architecture publicized for most commercial packages seems to indicate that this approach to cost prediction is conceptually general and applicable to different ERPs (cf. Welti, 1999). However, it also suggests that the logical structure of a package is a critical determinant of the overall implementation effort, as it can affect the actual degree of modularity, as well as the signi cance of the prediction variables for different modules. Technical and organizational drivers of costs show a similar magnitude, both for individual modules and for the whole package. According to these results, excluding organizational drivers of implementation costs can cause a budgeting error greater than 50%. Although this percentage is objectively high, the magnitude of technical and organizational drivers controverts
45 professional studies, which often regard organizational costs as predominant (cf. Gibbons Paul, 1998) and attests to the relevance of technical costs. It should be observed that the literature documents a wide variation in implementation costs for different ERPs, which is held as a critical factor in the choice of a package, particularly for small companies (cf. Mayer, 1997). The results support this view by reinforcing the idea that a signi cant percentage of implementation costs are related to the technical as opposed to the organizational size of projects. Research hypotheses have been formulated by making a distinction between parameterization and reprogramming efforts and assuming that the former is proportional to the technical size of the project, while the latter is a consequence of the organizational resistance to change. From this perspective, the ndings indicate that, on average, parameterization and reprogramming involve a similar effort during implementation. If this study were to be replicated for different ERPs, quantitative results could be used as benchmarks for supporting managers while choosing a package and comparing implementation budgets. The signi cance of coef cients weighing the average contribution of each module to the overall implementation effort would help verify the actual modularity of different packages. A lower signi cance of these coef cients might indicate that one or multiple modules are not independent of the rest of the package and that part of their implementation has to be executed even if their functionalities are not required. Should this occur, reducing the technical scope of projects might not help in delaying implementation costs. The magnitude of these coef cients should then be interpreted according to the speci c structure of the modules and submodules of each package. In this respect, replicating this study could provide managers with qualitative knowledge on how functionalities are grouped into modules in different ERPs and help them identify the package with the functional structure that minimizes the number of submodules to be implemented. The coef cients of the organizational drivers of implementation effort would be directly comparable across packages. Their magnitude contrasted against that of the technical drivers of implementation effort would help smaller companies evaluate the economic bene ts of their reduced number of users for different packages. Similarly it would provide a quantitative basis on which larger companies could de ne the organizational boundaries of their ERP projects. The ndings from this study indicate that, as technology evolves and new modules of SAP are implemented, organizational expenses are likely to remain a heavy component of the total implementation costs. Companies should realize that assessing the magnitude
46 of organizational costs from the beginning is critical in building a strategy for ERP deployment that does not consistently exceed initial budgets.
Acknowledgements The author wish to thank Cap Gemini, Deloitte, KPMG, Origin, Plaut, SAP Consulting and Siemens Enterprise Consulting for their cooperation in this study.
References A , A.A. and Clark, B. (1990) Computer-aided Multivariate Analysis (Chapman & Hall, New York). Albrecht, A.J. (1979) Measuring application development productivity. In Proceedings of the Joint SHARE/GUIDE/ IBM Application Development Symposium, pp. 83–92. Bailey, J.W. and Basili, V.R. (1981) A meta-model for software development resource expenditures. In Proceedings of the Fifth International Conference on Software Engineering, pp. 107–16. Bakos, J.Y. and Kemerer, C.F. (1992) Recent applications of economic theory in information technology research. Decision Support Systems, 8, 365–86. Banker, R.D., Chang, H. and Kemerer, C.F. (1994) Evidence of economies of scale in software development. Information and Software Technology, 36(5), 275–82. Betteridge, R. (1992) Successful experience of using function points to estimate project costs early in the life-cycle. Information and Software Technology, 34(10), 655–9. Boehm, B.W. (1981) Software Engineering Economics (Prentice Hall, Englewood Cliffs, NJ). Boehm, B.W., Clark, B., Horowitz, E., Westland, C., Madachy, R. and Selby, R. (1994) Cost models for future software life cycle processes: COCOMO 2.0. In Annals of Software Engineering Special Volume on Software Process and Product Measurement, Arthur, J.D. and Henry, S.M. (eds) (Science Publishers, Amsterdam). Bowen, D.E. and Lawler, E.E. (1992) The empowerment of service workers: what, why, how and when. Sloan Management Review, 33(3), 31–9. Bowen, D.E. and Lawler, E.E. (1995) Empowering service employees. Sloan Management Review, 36(4), 73–84. Briand, L., Basili, V. and Thomas, W. (1992) A pattern recognition approach for software engineering data analysis. IEEE Transactions on Software Engineering, 18(11), 931–42. Brynjolfsson, E., Malone, T.W., Gurbaxani, V. and Kambil, A. (1994) Does information technology lead to smaller rms? Management Science, 40(12), 1628–45. Cliffe, S. (1999) ERP implementation. Harvard Business Review, 77(1), 16–17. Cotteleer, M., Austin, R.D. and Nolan, R.L. (1998) Cisco Systems Inc.: Implementing ERP (Harvard Business School, Boston, MA).
Francalanci Darrel, I. (1988) Project costing: intelligent guesses. Systems International, 16(4), 83–5. Davenport, T.H. (2000) In search of ERP paybacks. Computerworld, 34(8), 42–3. Davenport, T.H. and Stoddard, D.B. (1994) Reengineering: business change of mythic proportions? MIS Quarterly, 18(2), 121–35. Davidson, W.H. (1993) Beyond re-engineering: the three phases of business transformation. IBM Systems Journal, 32(1), 65–74. Draper, N.R. and Smith, H. (1981) Applied Regression Analysis (Wiley, New York). Eskow, D. (1998) ERP: ugly name belies healthy market. Upside, 10(12), 46–50. Fan, M., Stallaert, J. and Whinston, A.B. (2000) The adoption and design methodologies of component-based enterprise systems. European Journal of Information Systems, 9(1), 25–35. Fenton, N.E. (1991) Software Metrics: A Rigorous Approach (Chapman & Hall, London). Gibbons Paul, L. (1998) What price ownership? Datamation, December–January, 88–96. Gill, P.J. (1999) ERP: keep it simple. InformationWeek, 747, 87–92. Hammer, M. (1990) Reengineering work: don’t automate, obliterate. Harvard Business Review, 68(4), 104–12. Huber, P.J. (1967) The behavior of maximum likelihood estimates under non-standard conditions. In Proceedings of the Fifth Berkeley Symposium in Mathematical Statistics and Probability, Vol. 1 (University of California Press, Berkeley, CA) pp. 221–33. King, J. (1998) ERP rentals lure users. Computerworld, 32(36), 97–8. Krishnakumar, P. and Sukumaran, N.V. (1997) A model for software development effort and cost estimation. IEEE Transactions on Software Engineering, 23(8), 485–97. Lassila, K.S. and Brancheau, J.C. (1999) Adoption and utilization of commercial software packages: exploring utilization equilibria, transitions, triggers, and tracks. Journal of Management Information Systems, 16(2), 63–90. Liang, K.Y. and Zeger, S.L. (1986) Longitudinal data analysis using generalized linear models. Biometrika, 73, 13–22. Malone, T.W. (1997) Is empowerment just a fad? Control, decision making and IT. Sloan Management Review, 38(2), 23–35. Malone, T.W. (1998) The dawn of the E-lance economy. Harvard Business Review, 76(5), 144–52. Mateyaschuk, J. (1999) ASP helps small companies afford ERP applications. InformationWeek, 761, 201. Mayer, J.H. (1997) Good things come in smaller packages. Software Magazine, 17(6), 80–5. Nesi, P. and Querci, T. (1998) Effort estimation and prediction of object-oriented systems. The Journal of Systems and Software, 42(1), 89–102. Nohria, N. and Eccles, R.G. (eds) (1992) Networks and Organizations: Structure, Form, and Action (HBS Press, Boston, MA). Ostrom, C.W. (1990) Time Series Analysis Regression Techniques (Sage).
Implementation effort of ERP projects Putnam, L.H. (1978) A general empirical solution to the macro software sizing and estimating problem. IEEE Transactions on Software Engineering, SE4(4), 345–57. Ragowsky, A. and Adams, D.A. (1998) An investigation of interindustry IT innovation. Production and Inventory Management Journal, 39(3), 12–19. Salancik, G. and Pfeffer, J. (1978) A social information processing approach to job attitudes and task design. Administrative Science Quarterly, 23, 224–53. Saunders, J. (1999) Beware of costs lurking in ERP. Computing Canada, 25(10), 19–21. Scheer, A.W. and Habermann, F. (2000) Making ERP a success. Communications of the ACM, 43(4), 57–61. Schleifer, A. and Bell, D. (1995) Data Analysis, Regression and Forecasting. (International Thompson Publishing). Shepperd, M.J., Scho eld, C. and Kitchenham, B. (1996) Effort estimation using analogy. In Proceedings of the 18th International Conference on Software Engineering, Berlin. Software Engineering Laboratory Series (1993) Cost and Schedule Estimation Study Report. Soh, C., Kien, S.S. and Tay-Yap, J. (2000) Cultural ts and mis ts: is ERP a universal solution? Communications of the ACM, 43(4), 47–51. Sommerville, I. (2000) Software Engineering, 6th edn (Addison Wesley Publishing Co., New York). Sprott, D. (2000) Componentizing the enterprise application packages. Communications of the ACM, 43(4), 63–9. Srinivasan, K. and Fisher, D. (1995) Machine learning approaches to estimating software development effort. IEEE Transactions on Software Engineering, 21(2), 126–37. Stedman, C. (1999) Survey: ERP costs more than measurable ROI. Computerworld, 33(14), 6. Wagle, D. (1998) Making the case for an ERP system. Corporate Finance, December, 6–8.
47 Walkerden, F. and Jefferey, R. (1997) Advances in Computers (Academic Press, San Diego, CA). Walston, C.E. and Felix, C.P. (1977) A method of programming measurement and estimation. IBM Systems Journal, 16(1). Welti, N. (1999) Successful SAP R/3 Implementation: Practical Management of ERP Projects (Addison-Wesley Publishing Co., New York). White, H. (1982) Maximum likelihood estimation of misspeci ed models. Econometrica, 50, 1–25. Zalesny, M.D. and Ford, J.K. (1990) Extending the social information processing perspective: new links to attitudes, behaviors, and perceptions. Organizational Behavior and Human Decision Processes, 47, 205–46.
Biographical note Chiara Francalanci is an assistant professor of information systems at the Politecnico di Milano. She has a master’s degree in electronic engineering from the Politecnico di Milano, where she also completed her PhD in computer science. She worked for 2 years at the Harvard Business School as a visiting researcher as part of her postdoctoral studies. She has authored articles on the economics of IT, consulted in the nancial and manufacturing industries, both in Europe and the USA and published numerous case studies on the impact of IT on performance. Address for correspondence: Chiara Francalanci, Dipartimento di Elettronica e Informazione, Politecnico di Milano, Piazza Leonardo Da Vinci, 32, 20133, Milano, Italy.
Appendix 1 Table A1
De nition of modules and submodules for SAP/R3
Modules and submodules Financial General ledger Master data Accounts receivable Accounts payable Asset accounting Legal consolidation Special ledger Treasury Amortizations Financial investments Controlling Cost centre accounting Pro t centre accounting Pro tability analysis
De nition Basic functionalities for general ledger management Management of integrated accounting data Creation, storage and consistency control of accounts receivable Creation, storage and consistency control of accounts payable Accounting functionalities related to managing physical organizational assets for both production and investment purposes Integration of accounting data into the balance sheet and consistency control against different accounting sources and law regulations Specialized ledger functionalities (e.g. accounting on acquisitions) Treasury management for different organizational units Management of amortizations for physical assets and related reporting functionalities Investment management functionalities Accounting functionalities for organizational units managed as cost centres Accounting functionalities for organizational units managed as pro t centres General analyses of pro tability for revenue-creating organizational processes
Francalanci
48 Table A1
continued
Modules and submodules Activity-based costing General costs Product costing Project accounting Management consolidation Procurement Purchasing Inventory management Inventory control Warehouse management Invoice veri cation Information system
De nition Cost tracking for elementary work activities and aggregation along different dimensions (function, process, product, etc.) Recording, analysis and allocation of general costs Analysis of unit costs for different products Budgeting, reporting and pro tability analyses for individual projects Reporting functionalities for top management on the pro tability of investments and processes as well as related cost structure
Management of purchases (orders, clearance for payment, etc.) Inventory management functionalities Cyclical inventory control against input–output records of different items Warehouse management functionalities Consistency control of invoices against orders and inventory Accessory functionalities integrating data from other modules as well as information on suppliers and alternative suppliers Electronic data interchange (EDI) Basic EDI functionalities with suppliers Planning tools General functionalities for order planning Consumption-based planning Order-planning functionalities based on historical resource consumption data Quality inspection In-depth inspection of quality against prede ned standards Quality control Routine quality control activities Quality certi cation Quality certi cation functionalities Quality noti cation Quality warnings and reporting functionalities Production management Basic data Management of integrated production data Information system Accessory functionalities integrating data from other modules Sales order planning Forecasting sales according to historical and market data Master planning Strategic planning of production activities according to the company’s predicted sales Material requirements planning Planning of production resources according to sales plans Capacity requirement planning Planning of production capacity according to sales plans Production orders Detailed production planning for individual plants and machines Kanban/Just in time Kanban and just in time production management functionalities Repetitive manufacturing Support for the operating management of manufacturing activities Assembly to orders Management of nal production phases according to assembly to orders procedures Product costing Analysis of resource consumption levels by production activities and product costing Plant data collection Collection of job allocation, failure and personnel data on production plants Logistics Planning and control of logistics Preventive maintenance Management of preventive maintenance activities (noti cation, data collection, etc.) Technical asset management Operating management, routine control and minor maintenance of technical assets Work order management Allocation, execution and supervision of work orders Maintenance projects Management of extensive maintenance projects. Service maintenance Management of maintenance services (personnel recording, cost data collection, etc.) Sales and distribution Master data Management of integrated sales and distribution data Basic functions Basic functionalities for sales and distribution management Information system Accessory functionalities integrating data from other modules Billing Creation, storage and consistency control of bills Customer assistance Support for customer assistance, including basic post-sale services (inquiries, requests for maintenance, collection of feedback information, etc.) Foreign trading Support for foreign customer management (particularly accounting for legal differences) Shipping Operating management of outsourced shipping functions Transportation Operating management of in-house shipping functions Sales Creation, storage and consistency control of contractual agreements with customers EDI Basic EDI functionalities with customers