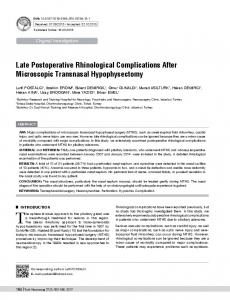
Predicting the initial postoperative flow after AVF
Recommend Documents
wounds and so require a transfusion, or will the patient excrete excess intraoperative ... day after surgery may assist in avoiding severe postoperative anaemia.
AIDS-related multicentric Castleman's disease who has also enjoyed a long-lasting complete clinical and pathological remis- sion following the use of HAART ...
Mar 14, 2013 - presented with confusion and psychomotor agitation, sharpened reflexes and the Babinski reflex was present. Her postoperative test results ...
American Board of Endodontics reported having at least ... reduce postoperative pain during endodontic treatment. ... was failure to achieve apical patency.
May 16, 2016 - presence of nasal septal perforations, nasal synechiae, purulent secretion into the nasal cavity, perinasal loss of sense, deflection of the nasal ...
To estimate the duration of postoperative headache after surgery for acoustic neuroma and the effects of ..... of vestibular schwannoma via the retrosigmoid.
Apr 4, 2013 - total ethmoidectomy, and sphenoidotomy. Evalua- tion of the sphenoid sinus failed to show extravasa- tion of fluorescein from the roof or lateral ...
Methods: We reviewed the charts of .... left side (35%), 15 bilobectomies (4.3%), 32 sleeve lobec- ... We used the Overholt technique both after lobectomy/bilo-.
most common immobilization device was an abduction pillow sling with the arm in neutral or ... home-based exercise programs versus facility-based rehabili-.
endocrine and metabolic complications. The preferred drugs for postoperative pain management are opioids. Pethidine is not a common opioid chosen for pain.
frequently reported injured knee ligament that requires surgical ... and rotational stability of the knee. ... Posterolateral (PL) bundle consists of fascicles attached.
related Castleman's disease following the administration of highly active antiretroviral therapy. (HAART). The use of highly active antiretroviral therapy (HAART) ...
Pre-excitation syndromes such as WPW are generally believed to be due to the pres- ence of accessory functioning pathways between the atria and ventricles.
Jul 31, 2009 - The equivalence of quasi-static load test and low-velocity impact ... named the âComposite Structure Impact Performance Assessment Program ...
Dysphagia, Postoperative symptoms. INTRODUCTION. A popular option for the surgical management of gastro- esophageal reflux disease is minimally invasive ...
Kyeong-Mee Park6, Moon-Kyu Chung5*. 1Department of Advanced ..... na count in order to evaluate the modeling and remodeling rate. A recently developed ..... Friedrich RE, Todorovic M, Heiland M, Scheuer HA, Krüll. A. Scattering effects of ...
Feb 12, 2013 - Case Report. Postoperative Complications Leading to Death after .... Figure 1: X-ray of abdomen, performed on 05 December 2008, revealed ...
Oct 23, 2014 - School of Dentistry, University of São Paulo, São Paulo, SP, Brazil. A. C. R. T. Horliana ... All patients underwent with standardized surgical tech- ..... Bauer HC, Duarte FL, Horliana AC, Tortamano IP, Perez FE, Simone.
Summary. In this prospective, randomized study, we com- pared 42 patients undergoing laparoscopic cholecystectomy and 40 undergoing open chole-.
tation: airways complications, vascular complications, pleural complications, surgical wound complications, and ..... monary adhesions or pachypleuritis are present in posterior ... are more common in right-side colon, particularly in cecum,.
by using an EEA stapler (25 mm; Covidien, Mansfield, MA, USA). Fifty centimeters below the esophagojejunostomy site, a jejuno- jejunostomy was constructed ...
May 20, 2017 - microcirculation. By monitoring sublingual microcirculation using Sidesteam dark-field imaging (SDF), microcirculatory function.
Predicting the initial postoperative flow after AVF
Predicting the initial postoperative flow after AVF creation for hemodia- lysis: two modeling approaches. W. Huberts, E. M. H. Bosboom, J. H. M. Tordoir, F. N. van ...
Cardiovascular biomechanics
Predicting the initial postoperative flow after AVF creation for hemodialysis: two modeling approaches W. Huberts, E. M. H. Bosboom, J. H. M. Tordoir, F. N. van de Vosse
Introduction
Results and discussion
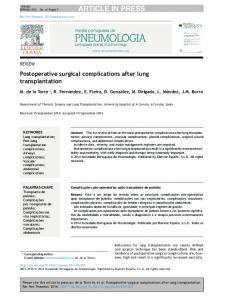
Functioning of hemodialysis arteriovenous fistula (AVF) immediately after surgical creation is mainly hampered by nonmaturation, which is characterized by insufficient flow increase and insufficient vessel remodeling. Despite available preoperative diagnostics 20-50 of all newly created AVFs fail [1, 4]. The initial postoperative flow (pFV) increase is generally accepted to be indicative for proper maturation [4].
Both modeling approaches were able to describe the acute hemodynamical effects associated with AVF creation and give similar results (Fig. 2,3). In both models the flow increases dramatically after RCAVF creation in accordance with duplex measurements.
Objective The aim of this study is to compare a lumped parameter model with a 1D-wave propagation model in their ability to predict the postoperative flow increase after AVF creation.
Methods Vascular hemodynamics is simulated with two different modeling approaches, lumped parameter modeling [3, 5] and 1Dwave propagation modeling [2]. For both models the human vascular tree is divided into segments representing local blood and vessel wall properties (Fig.1). All models are adapted to patient-specific conditions and results are compared with clinical measurements.
Fig. 2 Example of the pressure contours before and after RCAVF creation for the 0D- (black) and the 1D-model (red).
Fig. 3 Example of the flow contours before and after RCAVF creation for the 0D- (black) and the 1D-model (red).
The 0D-model is easier to adapt to patientspecific conditions, while it is more difficult to incorporate nonlinear terms (e.g. viscoelasticity). In addition, vessel tapering within a segment is neglected in the 0D-model. Model improvements are necessary to improve the patient-specific predictions. Fig. 1 The vascular tree divided in segments.
0D-lumped parameter model [3, 5]: Pressure is represented by electrical potential and flow by electrical current. A resistor and an inductor are used to model the viscous and inertial blood properties. Vessel compliance is modeled with a condensator.
Future work • • • •
Improve the modeling of the veins and anastomosis Perform a parameter study Obtain more accurate input data: MR and US (n=60) Determine the models predictive value
1D-wave propagation model [2]: Flow in a vessel is divided in an inertia dominated core and a friction dominated boundary References: layer.By assuming equilibrium between inertia and viscous forces [1] Allon M. et al. : Kidney Int, 62: 1109-1124, 2002 at the transition from core to boundary layer, a velocity profile [2] Bessems D. et al. : J Fluid Mech 580:145-168, 2007 as function of the flow and the pressure gradient is derived that [3] Huberts W. et al. : MSc thesis TU/e, 2006 [4] Tordoir J. et al. : Nephrol Dial Transplant 18: 378- 383, 2003 is used to solve the 1D momentum equation. [5] Westerhof N. et al. : J Biomech 2: 121-143, 1969