Predicting the Upper Bound of Web Traffic Volume Using a Multiple Time Scale Approach Weibin Zhao Department of Computer Science Columbia University New York, NY 10027
[email protected] Henning Schulzrinne Department of Computer Science Columbia University New York, NY 10027
[email protected]
Abstract This paper presents a prediction algorithm for estimating the upper bound of future Web traffic volume. Unlike traditional traffic predictions that are performed at a single time scale using curve fitting, we employ a multiple time scale approach and utilize traffic statistical properties to do forecasting. We have applied our prediction algorithm to the 1998 World Cup data set. Experiments show that it is effective for short term traffic bound predictions, applicable to bursty traffic, and useful for Web server overload prevention.
Keywords Traffic prediction, upper bound, multiple time scale approach, self-similar, overload prevention.
1 Introduction To provide expected quality of services, a Web site needs to predict its future traffic volume: long term predictions (e.g., in months or years) are useful for capacity planning, while short term predictions (e.g., in seconds or minutes) are useful for overload prevention. As Web has a large number of potential users, a Web site may receive highly bursty requests and get overwhelmed, which is known as the flash crowd phenomenon. When a Web server becomes overloaded, its service quality will be seriously degraded: its users will perceive longer delays or even lose services. To prevent overload, capacity planning is not sufficient since the real traffic volume may exceed the planned capacity. Moreover, provisioning according to the peak traffic volume or even over-provisioning is not cost effective since Web traffic has a large variance. To better handle overload, dynamic load shedding and migration are needed, such as the Hotspot Rescue Service [2]. Short term traffic predictions are important for a server to take needed actions in advance when it anticipates an approaching peak load which is likely to exceed its capacity or a preset threshold.
Note that for overload prevention, we only need to predict an upper bound of the future traffic volume. More precisely, whether the future traffic volume will exceed the server’s capacity or a preset threshold. As long as the future traffic volume is below the predicted bound, the exact volume does not matter much here. Also note that for overload prevention, over-prediction has a less penalty than under-prediction because a false alarm only incurs unnecessary overheads, but a miss prediction of an excess traffic can cause the server being overloaded. In this paper, we describe a prediction algorithm for estimating the upper bound of future Web traffic volume. We employ a multiple time scale approach by using traffic information at a smaller time scale to forecast traffic volume at a larger time scale. Furthermore, we utilize traffic statistical properties other than curve fitting to do forecasting. The rest of this paper is organized as follows: we give the motivation in Section 2, describe our prediction algorithm in Section 3, discuss the parameter selection in Section 4, present experiment results in Section 5, and conclude in Section 6.
2 Motivation Traditionally, traffic predictions are carried at a single time scale using curve fitting. A difficult issue here is to choose the right number (denoted as Nh ) of history intervals used for predictions: if Nh is too large, then predictions are based upon less relevant information in history, whereas if Nh is too small, then predictions are made from incomplete information; both cases lead to poor predictions. Usually better predictions can be achieved by varying Nh dynamically, but it is hard to derive the correct Nh . To avoid the trouble of choosing Nh , we seek a new approach to traffic predictions by only using traffic information in current interval. More specifically, we try to correlate how traffic changes within current interval at a smaller time scale (e.g., one tenth of current time scale) with that at current time scale. Previous work on self similarity [3] has shown that statistical correlations exist for Web traffic at different time scales. From a first look, it seems that self similarity is not useful for traffic predictions since it is a property for stationary processes, whereas predictions are more useful when traffic volume changes quickly and dramatically. A careful re-consideration reveals that no matter how quickly a traffic changes, at sufficiently small time scales, the change between adjacent intervals will be small. Equivalently, we can regard the mean of traffic volume in adjacent intervals as unchanged and the real change as variability. Note that for three consecutive intervals: I1 , I2 , and I3 , we can view that I1 and I2 have the same mean µ1,2 , and I2 and I3 have the same mean µ2,3 ; but µ1,2 and µ2,3 can be unequal (i.e., I1 and I3 can have different means). In this way, we can perform predictions by utilizing self similarity within two adjacent intervals at sufficiently small time scales. A good fit here is that self similarity is measured in terms of statistical correlations between two different time scales, which are just what we need to predict the upper bound of future traffic volume.
3 Prediction Algorithm We formulate our prediction problem as follows: given a time scale T (such as 100 seconds), we want to predict the upper bound of traffic volume in next interval based on traffic information in current interval. Note that the length of each interval is T . Let vc and vc+1 denote the traffic volume in current interval (Ic ) and next interval (Ic+1 ), respectively, and dc denote the difference between vc+1 and vc (i.e., vc+1 = vc + dc ). If we can find an upper bound (denoted as bc ) of dc , then we can estimate that vc+1 < vc + bc . In other words, predicting an upper bound for vc+1 is equivalent to estimating bc . Next we show using statistical properties and self similarity to estimate bc . Let random variable D(T ) denote the difference of traffic volume between adjacent intervals at time scale T , and µ(T ) and σ(T ) denote the mean and standard deviation of D(T ), respectively. If assuming that D(T ) follows normal distribution, we can estimate the bound of D(T ) using µ(T ) and σ(T ). For example, since about 95% samples of D(T ) fall into the range of [µ(T ) − 2 ∗ σ(T ), µ(T ) + 2 ∗ σ(T )], we can say that a sample of D(T ) will be less than µ(T ) + 2 ∗ σ(T ) with more than 95% probability. In order to derive bc , we divide Ic into n equal sub-intervals with length of T 0 = T /n, and look at D(T 0 ) in these n intervals. With a sufficient number of samples (e.g., n ≥ 10), we can have an estimation for µ(T 0 ) and σ(T 0 ). If assuming that the traffic is self-similar with Hurst parameter H within the period of Ic and Ic+1 , then we have µ(T ) = nH ∗ µ(T 0 ), and σ(T ) = nH ∗ σ(T 0 ). With µ(T ) and σ(T ), we can estimate bc as µ(T ) + 2 ∗ σ(T ). Note that here we choose µ(T ) + 2 ∗ σ(T ) rather than µ(T ) + 3 ∗ σ(T ) mainly because we want to have a closer upper bound estimation to avoid unnecessary false alarms. Also note that since our prediction is based on statistical properties, the predicted upper bound is correct only with a high
probability.
4 Parameter Selection Several parameters affect the prediction performance. The first one is the prediction interval T . As we use self similarity to derive statistical correlations between two different time scales, the mean of traffic volume should be roughly unchanged within the period of 2 ∗ T . Usually T should not exceed 100 seconds. The second parameter is the scaling factor n between the two different time scales T and T 0 . As this parameter decides the number of samples in time scale T 0 used for deriving statistical properties, n should be no less than 10. The third one is the Hurst parameter H. Since we do not know the correct H in advance, and using a larger H tends to over estimate whereas using a smaller H tends to under estimate, the general guidances are as follows: (1) the burstier the traffic, the larger H [4]; (2) a right H will result in roughly the same prediction performance when n changes; and (3) use a little bit larger H if not sure, usually in the range of [0.8, 0.9].
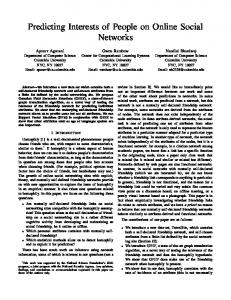
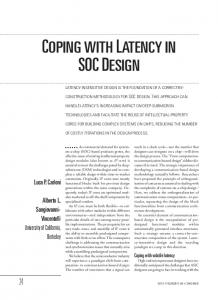
5 Experiment Results To evaluate our prediction algorithm, we apply it to the 1998 World Cup data set [1], which includes 1.35 billion requests made to 30 servers at four different regions during a period of 92 days. We run our prediction algorithm for three servers on three days. The three chosen servers are server5, server41 and server64, which are selected from three different regions since servers in the same region have very similar traffic curves. The three chosen days are June 29 (day65), July 7 (day73) and July 8 (day74), which are among the busiest days in the data set. In each day, we choose a period of three hours that includes a dramatic traffic spike. We carry experiments in three steps. For preparation, we calculate the number of requests at the following time scales (in second): 1, 2, 5, 10, 12, 15, 18, 20, 30, 40, 50, 60, 100, 120, 150, 180, 200, 300, 400, 600. In different experiments, we vary T , n and H to evaluate their effects on predictions. After each experiment, we calculate the percentage of prediction intervals in which the real traffic volume fall below the predicted upper bound. In the first experiment, we fix n = 10 and H = 0.85, but vary T from 10 to 600 seconds. We get consistent prediction performance across all nine different server-day combinations. For clarity, we only show the results for the three servers on day74 in Figure 1. As we anticipate, prediction performance changes as T increases: around 95% when T ≤ 100 seconds, slowly degraded to around 90% when T ∈ (100, 200) seconds, and down quickly when T ≥ 200 seconds. We show the detailed prediction results for server41 on day65 in Figure 2. Since the finest time scale in the data set is 1 second, and a good prediction interval T ≤ 100 seconds, we have n ∈ [10, 100]. In the second experiment, we fix H = 0.85 and T = 100, but vary n. We predict using n = 10, 20, 50, 100, respectively, and get roughly the same results. For example, for server41 on day65, the three predictions using n = 10, 50, 100 all have a 97.2% performance, while the prediction using n = 20 has a 96.3% performance with just one more miss prediction. This validates that with a right H, predictions using different n (within a certain range) are roughly equivalent, and that H = 0.85 appears to be the right value for this data set. In the last experiment, we fix T = 100, but vary n and H. This is to determine a right H based on the following property: increasing n will raise the prediction performance if we are using a larger H, but lower the prediction performance if we are using a smaller H.
6 Conclusion In this paper, we described a prediction algorithm for estimating the upper bound of future Web traffic volume, in which we employ a multiple time scale approach and utilize traffic statistical properties to do forecasting. We evaluated three algorithm parameters and showed that our algorithm is simple, effective for short term traffic bound predictions, applicable to bursty traffic, and useful for Web server overload prevention.
100
Below the Predicted Upper Bound (%)
90
80
70
60
50 server5 server41 server64 40
0
100
200
300 Prediction Interval
400
500
600
100
120
Figure 1: Prediction performance for day74
4
3
x 10
Real traffic volume Predicted upper bound of increase Real changes 2.5
Number of requests
2
1.5
1
0.5
0
−0.5
0
20
40
60 80 Interval of size 100 seconds
Figure 2: Detailed prediction results for server41 on day65
Acknowledgements The work described in this paper was supported in part by the National Science Foundation under Grant No. ANI-0117738. Any opinions, findings, and conclusions or recommendations expressed in this paper are those of the authors and do not necessarily reflect the views of the National Science Foundation.
References [1] Martin Arlitt and Tai Jin. Workload characterization of the 1998 world cup web site. Technical Report HPL-1999-35R1, HP Labs., 1999. [2] E. Coffman, P. Jelenkovic, J. Nieh, and D. Rubenstein. The columbia hotspot rescue service. Technical Report, Columbia University, February 2001. [3] Mark E. Crovella and Azer Bestavros. Self-similarity in world wide web traffic: Evidence and possible causes. IEEE/ACM Transactions on Networking, 5(6):835–846, December 1997. [4] Will E. Leland, Murad S. Taqqu, Walter Willinger, and Daniel V. Wilson. On the self-similar nature of ethernet traffic (extended version). IEEE/ACM Transactions on Networking, 2(1):1–15, February 1994.