1
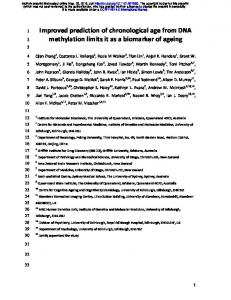
Prediction and visualization of DNA structural properties from sequence Kristian VLAHOVICEK, László KAJÁN Sándor PONGOR International Centre for Genetic Engineering and Biotechnology (ICGEB), Area Science Park, Padriciano 99, 34012 Trieste, Italy Correspondence: S. Pongor, Tel.: +39-040-3757300; Fax: +39-040-226555; E-mail:
[email protected]
Abstract. Visualisation of local DNA conformation is a useful tool in interpreting and designing experiments at the molecular level. There are a number of methods whereby local curvature as well as other conformational parameters can be predicted. Calculation of these parameters on a genomic scale may help to clarify the role of these elements in genomic architecture.
Introduction Simple methods that can guide experimenters to find conspicuous regions in DNA are of considerable interest in view of the genomic sequence generated. Structural properties, such as flexibility or intrinsic curvature that are not consequences of explicit sequence motifs are of particular interest since these cannot be identified from sequence similarity searches. Over the past years our group has been developing and testing simple mechanic models that can describe the local behaviour of DNA in such short segments, in a sequence dependent fashion [1-9]. These methods have been extended to the calculation and visualization of various parameters other than curvature [10], and included into WWWbased server programs located on the ICGEB web site. Parametric visualization of DNA characteristics consists in mapping of numerical data to visually presentable models. The simplest form of parametric visualization is the sequence plot i.e. a graph in which numeric values are assigned to positions along the DNA sequence. The advantage of comparing sequence plots rather than primary sequences originates from the simple fact that plots, unlike primary sequences, can be subjected to arithmetic operations (averaging, subtraction, etc.) and their similarities can be characterized in quantitative terms such as correlation coefficients and standard deviations. This is essentially a parametric approach of sequence comparison which makes it possible, e.g., to compare groups of sequences, to carry out a semi-quantitative comparison (ranking) of sequences in structural terms, etc. using simple programs. The parametric visualization of DNA sequences uses the same properties on a qualitative basis, and the conspicuous segments can be identified by 1D, 2D or 3D plots of various parameters. In this chapter we first describe DNA curvature as the paradigmatic concept, followed by a short description of the server algorithms. The last part of this chapter gives examples of applications.
1
2
Roll (? )
Twist (? )
Tilt (?)
Figure 1 A. The molecular parameters describing DNA curvature are assigned to the relative orientation of two successive dinucleotides: roll angle (? ), tilt angle (?) and twist (? ). In the ideal, Watson-Crick model, ? =?=0 and ? =36o (10 basepairs per helical turn), B DNA in solution has a twist angle ? =34.3o (10.5 basepairs per helical turn); for a detailed description of these and other parameters see [54]. B . Macroscopic curvature of an elastic rod is characterized by a deflection angle ? , in the case of DNA this is sometimes expressed in degrees per helical turn. C. The experimentally determined conformation of DNA can be characterized by local roll, tilt and twist angles, and these values can be used to reconstruct the trajectory of the Z-axis.
1. Calculation of DNA curvature The thinking of biologists has been profoundly influenced by the idea of local structural polymorphism in DNA. DNA is no longer considered as a featureless polymer but rather as a series of individual domains differing in flexibility and curvature. Unlike in the case of helical polymorphism (e.g. B, A or Z structures), here we often deal with a localised micropolymorphism in which the original B-DNA structure is only distorted but is not extensively modified [9]. The deviations from ideal, straight DNA are usually expressed as angles of deflection between adjacent base pairs (Figure 1A). The terms “curved DNA” or “DNA curvature” are used in various contexts. For instance, asymmetrical binding of proteins can induce both kinks and smooth bends in the DNA trajectory. In this review we attempt to summarize another phenomenon, an inherent structural micro-heterogeneity of DNA that occurs in the absence of bound proteins, and 2
3
depends only on the DNA sequence. In contrast to alternative DNA conformations (such as A and Z-DNA), curvature can be viewed as a slight distortion of the B-DNA geometry that is manifested in the bending of the DNA-trajectory. Such a curvature can be quantitatively described using an analogy of a smoothly bent rod, and in the case of a DNA model, it can be expressed in terms of degree per base pair, or degree per helical turn. In the latter case, the repeat of the helical turn has to be specified. (Figure 1B).
Figure 2. DNA curvature as asymmetric bendability. The diagram is a top-view of the DNA helix with the Z-axis perpendicular to the plain of the paper. DNA bendability of subsequent trinucleotides is represented as an arrow perpendicular to the Z-axis. In curved segments, such as the one in the figure, the distribution of the bendability vectors is asymmetrical and the vector-sum (red arrow) is non-zero. In most parts of the genomes the vector sum is small [5].
The discovery of DNA curvature was a slow process. The first evidence that there is an influence of base composition on the average twist between adjacent base pairs came from DNA X-ray fiber diagrams, 20 years after the double- helix paper of Watson and Crick [11]. Subsequent studies by gel-electrophoresis [12], nucleotide/digestions [13] and finally the first X-ray structure of DNA [14] confirmed this view. In 1980, Trifonov and Sussman suggested a correlation between the helical repeat of the DNA and spacing of certain dinucleotides (especially AA and TT) along the sequence which indicated that a substantial part of eukaryotic DNA may in fact be curved [15]. Subsequent experimental data by Marini et al. [16] indicated that periodic A-tracts repeating in phase with the helical repeats cause curvature, which was confirmed both by electron microscopy [17] and by enzymatic circularisation experiments [18]. By the mid nineties, the concept of DNA curvature became generally accepted, and even the apparent controversy between X-ray crystallography and solution experiments could be reconciled by the discovery that divalent cations induce a sequence dependent curvature in DNA [3]. A “curvature model” is a way to derive sequence-dependent DNA geometry parameters from experimental data. The models are different both in terms of the experimental data and the method of calculation. For example, it is common to fix some of the base-pair parameters at the values corresponding to straight B-DNA while letting others vary in a sequence-dependent fashion. In addition, the angles can be assigned to dinucleotides or to trinucleotides; these datasets are referred to as dinucleotide or trinucleotide scales. (All the models described here refer to double-stranded DNA molecules with “classic” phosphate orientations.)
3
4
1.1 The Wedge Model The wedge model is called a “nearest neighbour model” since the geometry of a stack of two base pairs is considered to be defined by the two constituent nucleotides, and the influence of more distant neighbours is ignored [19]. The model is based on gelelectrophoresis data, described in terms of dinucleotide parameters, roll and tilt angles.
1.2 The Junction Model The junction model was proposed based on gel- mobility experiments using oligonucleotides with “phased” (suitably spaced) adenine tracts [20, 21]. According to this model, curvature is caused by a deflection at each junction between the axes of the normal B-DNA and the B'-DNA of the poly dA, poly dT. The model assumes that the deflection at junction is a result of negative base-pair inclination in adenine tracts and zero inclination in the intervening B-DNA segments, and that this difference generates the bend [21]. According to Haran et al. [22] the wedge and the junction models are not necessarily incompatible. It appears, however, that there are events of curvature that neither the junction model nor the wedge model can sufficiently explain. For example, some GC-rich motifs, such as GGGCCC and CCCGGG have been showed opposite direction of bending [3] to those predicted from both models.
1.3 The Elastic Rod Model The elastic rod model is based on DNAseI digestion data [1]. This enzyme bends the substrate towards the major grove, so the resulting model allows only one direction of bending, towards the roll angle. The original method described DNA bending in terms of a dimensionless parameter, “relative bending propensity” determined for trinucleotides [1, 4]. Subsequently, a physical model of sequence-dependent anisotropic-bendability (SDAB) was developed [9]. SDAB considers DNA to be an elastic rod, in which the flexibility of each segment (di- or trinucleotide) is anisotropic, namely, greater towards the major groove than it is in other directions. As DNAseI cannot distinguish between a priori bent and dynamically “bendable” sites, curvature according to this model is both static as well as dynamic in nature and can be recognized by the phased distribution of bent/bendable sites along the sequences. This can be visualized as a vectorial property along the sequence (Figure 2) which is conceptually analogous to the hydrophobic moment calculations in protein sequences. There are a number of computer programs that can predict curvature from sequence. One of the first algorithms available for curvature calculations was BEND written by Goodsell and Dickerson [23]. The algorithm can handle both dinucleotide and trinucleotide descriptions, and uses a simplified procedure wherein the successive deflection angles (roll, tilt) are summed up as vectors. This is a well- known approximation that is acceptable however only for low angle values. The BEND algorithm calculates curvature for segments of 11 nucleotides, and outputs a plot of curvature versus sequence position. The algorithm was incorporated into the EMBOSS suite of sequence analysis programs [24] under the name BANANA (which is a reference to curved B-DNA of A and non-A tracts), and is also available on- line [25]. The Haifa University server [26] for DNA structure calculation is built around the program Curvature [27]. The DIAMOD program was written by Mensur Dlakic for PC [28] and handles most curvature models. Finally, several precomputed
4
5
parametric genome maps are available in the Genome Atlas of the Technical University of Denmark [29, 30].
ATGACGTAATAATGC... (SEQUENCE)
plot.it bend.it model.it
AAA 0.1 AAC 1.6 ... (PARAMETER SET)
Figure 3.: Data flow of the bend.it, plot.it and model.it servers. Each overlapping triplet (or dinucleotide) in a DNA sequence is assigned a corresponding parameter value in a “sliding window” fashion. The resulting numerical vector can then be averaged within a given window (default value is 31bp or approximately three helical turns) and displayed either as a 1C parameter vs. sequence plot, or as a 2D correlation plot from two different parameter sets. (Three-dimensional DNA trajectories are built from basepair geometry parameters without averaging).
Figure 4. Output examples of the plot.it server. A three-dimensional correlation plot of the Anadara trapezia (ark clam) beta globin gene (complete cds. genbank:L16978). The vertical Z-axis denotes the number of actual segments represented by data on the XY plane. This type of correlation plot is useful in situations where analysis is performed on a long DNA sequence
5
6
Curved
Rigid
Flexible
Figure 5. Output examples of the bend.it server. A. profile plots of bendability (blue) and curvature (red) along the 350bp L. tarantolae kinetoplast sequence. Profile plots provide a visual aid to locate “interesting” regions along a DNA sequence. B. correlation (2D) plot of curvature vs. bendability of the same sequence.
2. Prediction of DNA properties other than curvature From the computational point of view curvature is a local property of DNA that can be represented by numeric values assigned to each position of a DNA sequence. The same philosophy can be extended to a large number of other DNA properties that can be assigned to a short segment of DNA. There are a few common approximations underlying many parametric descriptions: a) The property is local, i.e. a given n- mer in DNA will have the same property irrespective of its sequence environment ("context"). This may be true for molecular properties depending only on the nucleobases, but is a very rough approximation for complex, statistically derived properties like conformational preferences since, for instance, even dinucleotides are known to adopt a few different conformations depending on their neighbours. b) Segments within DNA (nucleotides, dinucleotides) contribute independently to a given property. This makes it possible to use simple linear or log/linear models to experimental data. As an example, bending propens ity parameters for trinucleotides were deduced from DNAseI digestibility vs. sequence data based on the following principles [1]. (i) Locality: DNase I interacts with the window of 6 nucleotides around the cleaved bond and its cutting efficiency depends only on this window. (ii) This window is represented as four 6
7
overlapping trinucleotides, and one single structural parameter p(a) of the trinucleotides, constituting the enzyme-DNA contact surface, will influence the cutting rate (this is an obvious simplification, since local effects, such as specific residue contacts between the enzyme and the DNA molecule, are not considered); (iii) the bending propensity p(a) of each trinucleotide contributes independently to the probability of DNase I cutting, PW . The model thus assumes that the contribution of one element (trinucleotide) does not depend on any other element being present or absent in the window around the cut. So PW for the 6 nt window can be written as the product of the n different and assumedly independent p(a) probabilities: 4
Pw ? ? p (a ) i (1) 1 ?? Equating PW with the experimentally determined frequencies of cleavage, FW , leads to a linear system of equations Fw ?
4
?
ln p( a ) i
(2)
1
Similar approaches have been used to extract numeric parameters from a wide variety of different experimental data. As an extreme case, DNAseI digestibility data can be obtained on large, continuous DNA fragments, other parameters, such as stability etc. were derived from measurements on short oligonucleotides. Regarding the origins of the data, parameters can be obtained either from measurement or from database statistics, such as evaluation of 3D structures or sequence data. From the computational point of view, the parameters are represented either as tabulated values, or they are computed “on the fly”, based on the sequence information itself.
A
B
C
7
Figure 6. Output examples of the model.it server [35]. A. three-dimensional trajectory model of a ~400bp L. tarantolae kinetoplast, visualized using SwissPDB Viewer. B. Predicted conformation of 14 Zea mays promoter regions from EPD database ORF is shown in yellow. C. Superposition reveals three conformation groups
8
A
B
Figure 7 : Region of 74 kb around the switching point of chromosome 21 of L. major. L7171 and L3640 are two cosmids containing the overlapping fragments of chromosome 21. The two strands and the encoded genes are represented in different colors. The curvature analysis of the 40 kb around the switch region is shown in the lower window.
3. The DNA-analysis tools developed at ICGEB The plot.it server produces parametric plots using various statistical physicochemical parameters [31]. A query sequence is divided into overlapping n- mers, and the average value of a given parameter is calculated using tabulated values. The server uses 45 structural parameters (a full list of references is available at the site), the general scheme of calculations is shown in Figure 3. The results appear either as simple sequence plots or as 2-D plots in which two parameters are plotted against each other. Examples are shown in Figure 4. The bend.it server calculates the curvature of DNA molecules as predicted from the DNA sequences. The calculation is based on values tabulated for dinucleotides and trinucleotides, and the curvature (degree per helical turn) is calculated using standard algorithms [9]. This calculation was originally based on DNA bendability parameters derived from DNAseI digestion that characterize the (static or dynamic) bending of trinucleotides towards the major groove [2]. Today a number of other dinucleotide [32-34] and trinucleotide models [2, 4] are included, and the results can be visualized as 1D or 2D plots on the screen. Both the bend.it and the plot.it servers are based on C programs provided with GnuPlot graphic routines. Their output appears on the screen and is optionally sent by e- mail to the user (Figure 5). The model.it server was designed to provide 3D models of DNA in response to DNA sequence queries [35]. The results are presented as a standard PDB file that can be viewed directly using any of the widely available molecule manipulation programs such as Swiss-PDBviewer [36] or Rasmol [37]. In addition to straight A and B DNA models, the server is capable of building curved DNA models using the parameter sets mentioned 8
9
above. The server program was written using "NAB" - a high level molecule manipulation language [38]. Coordinates of the sugar-phosphate backbone are optionally optimised with constrained molecular dynamics using energy parameters from the AMBER package [39]. At present, the server can produce models of 700 bp in length, but models longer than 50 bp will not be optimised. Modelling of canonical, straight B or A DNA structures proceeds in a similar way, but without the need for backbone geometry optimisation (Figure 6). The IS introns server was designed to provide statistical overviews on intron groups [40]. Simple questions, like comparison of introns between various taxonomic groups in terms of intron phases or size-distributions as well as the analysis of splice sites, requires a carefully selected dataset as well as meticulous work that has to be repeated as new data become available. The goal of the introns server was to establish an automatically updated intron resource that allows the evaluation of experimentally validated and statistically balanced intron datasets, as well as a flexible comparison of groups according to various criteria. In addit ion to sequence retrieval and BLAST similarity search, there are options to compare taxonomic groups based on the NCBI Taxonomy Database, and to perform on the fly statistics. The analysis capabilities of the IS server include statistical evaluation (minimum, maximum, average, standard deviation, etc.) of intron and exon length, of the number of introns per gene, base composition, intron phases, as well as a graphic comparison of two or more groups in terms of the above variables. In addition, the analysis of splice sites and testing of the exon shuffling hypothesis [41, 42] are explicitly included (Figure 7). All the servers are provided with help files that describe the detailed instructions, the theory, the literature citations as well as the instructions for installing the accessory programs such as Swiss-PDBviewer [36] or Rasmol [37].
Bendability distribution
Curvature distribution
25
14 B. subtilis
B. subtilis
C. elegans
C. elegans
E. coli
E. coli
12
H. influenzae
20
H. influenzae
M. genitalium
M. genitalium
M. janaschii
M. janaschii
10
M. pneumoniae
M. pneumoniae
S. cerevisiae
S. cerevisiae
Synechocistis sp.
15
Synechocistis sp.
%DNA
%DNA
8
6
10
4
5 2
0
0
0
1
2
3
4
5
6
Bendability (a.u.)
7
8
9
10
0
2
4
6
8
10
12
14
16
Curvature (degree/helical turn)
Figure 8. Distribution of bendability and curvature in various prokaryotic genomes
9
18
20
10
6
Curvature deg/helical turn
5
4
3
2 1
101
201
301
401
501
Figure 9. Distribution of curvature around open reading frames in yeast chromosome III. Curvature profiles of all fragments 200 bp outside and 50 bp inside the open reading frame were averaged and the result is displayed in terms of a positional preference for curved regions with respect to start and stop codons. The black line represents the average curvature of yeast chromosome III.
Application examples One of the obvious applications is to compare the distribution of curvature and other parameters in genomic sequences. Figure 7 shows that bendability has a smooth, symmetrical distribution in genomic DNA, similar to a bell shape. The distribution of curvature is apparently non-symmetrical reminiscent of a gamma function which is often found with randomly distributed variables whose value cannot be negative - curvature is actually such a case. Another possibility is to analyse curved segments along the entire genome. A circular plot is a convenient way to show such distributions even though the graphic resolution is often a limiting factor. Another possibility is to analyse the vicinity of annotated features in genomes, as shown in Figure 9. A comprehensive analysis of the curvature of the B. subtilis genomic DNA revealed the percentage of curved motifs within the genome and how many ORFs contain curved segments [43]. As reported in Figure 10, less than 1% of the B. subtilis genome contains curved motifs with values above 14° per helical turn. Using this as a cut-off, the majority of the curved DNA is found within the ORFs while using 16°, 64% of the curved segments are within the intergenic regions (Figure 10, inset), a tendency that continues as the cut-off is raised. In other words, the majority of the most curved segments are concentrated in the intergenic regions.Figure 10 shows the number of ORFs with at least one curved motif. Only 6.2% of all the ORFs in B. subtilis shows a curvature with a cut-off value of 14°. These ORFs with at least one curved motif, encode functionally unrelated proteins since their percentage distribution is consistent with the distribution of the known proteins among the different classes, following the standard functional classification reported by SubtiList (cellular processes and cell envelope, intermediary metabolism, information pathways, other functions, [44]). Therefore, only a small percentage of all curved motifs fall inside the coding regions, leading to the hypothesis that a straight DNA is more efficiently transcribed. On the other hand, it could be that intergenic regions have been selected with an intrinsic high curvature to act as genomic signals. Indeed, it is known that, at least in lower eukaryotes such as Saccharomyces cerevisiae and Leishmania major, promoters and terminators are constituted by flexible DNA stretches [45]. Several coding strand switching points are present within the chromosomes of L. major [46]. For example in a region of 74 kb of 10
11
A
B
Figure 10. Distribution of the curved segments within the B. subtilis genome. The distribution of the curved motifs inside Open Reading Frames (ORFs) or inside InterGenic Regions (IGR) obtained with different cut-off degree values is represented in the inset. The graphic representation of the curved motifs is reported at the bottom.
11
12
Chromosome 21 (74674
= 1 kb
bp) L364 0
L717 1
17 18
19
20
21 22 23 24 25 26 27 28
29 30
31
C 1
2
3
4
5
6 7
8
9 10
11
12 1314 1516
Figure 11. Region of 74 kb around the switching point of chromosome 21 of L. major. L7171 and L3640 are two cosmids containing the overlapping fragments of chromosome 21. The two strands and the encoded genes are represented in different colors. The curvature analysis of the 40 kb around the switch region is shown in the lower window.
chromosome 21, the first 16 ORFs are encoded on the Crick strand, while the rest of them are localised on the Watson strand (Figure 12). Between the two coding regions there are 1,602 nt, which are part of the so-called switching region, that do not contain neither predicted CDS nor DNA with potential to form hairpin structures. Moreover, this region shows a high DNA curvature with a maximum value of GC skew, as detected by the Bendit program [46, 47]. The physical features described for the switching point of chromosome 21 characterise also the switching points of other chromosomes of the parasite (chr. 1, 3, 4, 19), suggesting that these regions can be involved in promotion of DNA transcription or can indicate the presence of an origin of replication. In support of the first hypothesis, very recently it was shown, by transfectional studies, that the switching point region seems to drive the expression of the entire chr1 in Leishmania major Friedlin [48]. DNA isolated from normal eukaryotic cells by standard methods exhibit particular fragility resulting in ~50 kb fragments. Breakage at hypersensitive/fragile sites is thought to be due to nucleolytic cleavage and/or localized, non-random release of torsional stress [4952]. The sequence of several breakpoints of human DNA was recently determined and by multiple alignment, sequence similarities were found among the various breakpoints, both in short and longer stretches of the DNA [53]. An analysis with the plot.it server showed peculiar conformational characteristics (sharp transition or with a centre of symmetry) located exactly at the experimentally determined breakpoints (Figure 13A) [53]. These, 12
13
however, did not exactly coincide with the position of the short consensus motives. A number of short consensus motives appear to have a curved conformation as predicted by the model.it server (Figure 13B). These instances of correlation between computed and biochemical behaviour imply that the predicted conformations may be useful in the analysis situations where breakage and rearrangements are implicated in pathological scenarios. 5. Summary The WWW servers at ICGEB [10] have been created for the analysis of user-submitted DNA sequences in structural terms. bend.it calculates DNA curvature according to various methods, plot.it creates parametric plots of 45 physicochemical as well as statistical parameters. Both programs provide 1D as well as 2D plots that allow localisation of peculiar segments within the query. model.it creates 3D models of canonical or bent DNA starting from sequence data and presents the results in the form of a standard PDB file, directly viewable on the user's PC using any molecule manipulation program. The introns server allows statistical evaluation of introns in various taxonomic groups and the comparison of taxonomic groups in terms of length, base composition, intron type etc. The options include the analysis of splice sites and a probability test for exon-shuffling. The application examples cited here show that in some cases, genomic segments identified by parametric analysis show interesting correlations even in the absence of sequence similarity. However the correlation is generally weak, so careful analysis and human experts are necessary for the evaluation of the results. On the other hand, parametric plots can be excellent subjects for machine learning studies that might in turn reveal correlations that currently escape the human eye.
References [1] [2] [3] [4] [5] [6] [7] [8] [9] [10] [11] [12] [13] [14] [15]
13
Brukner, I., et al., Sequence-dependent bending propensity of DNA as revealed by DNase I: parameters for trinucleotides. Embo J, 1995. 14(8): p. 1812-8. Brukner, I., et al., Trinucleotide models for DNA bending propensity: comparison of models based on DNaseI digestion and nucleosome packaging data. J Biomol Struct Dyn, 1995. 13(2): p. 309-17. Brukner, I., et al., Physiological concentration of magnesium ions induces a strong macroscopic c urvature in GGGCCC-containing DNA. J Mol Biol, 1994. 236(1): p. 26-32. Gabrielian, A. and S. Pongor, Correlation of intrinsic DNA curvature with DNA property periodicity. Febs Lett, 1996. 393(1): p. 65-8. Gabrielian, A., A. Simoncsits, and S. Pongor, Distribution of bending propensity in DNA sequences. Febs Lett, 1996. 393(1): p. 124-30. Gabrielian, A., K. Vlahovicek, and S. Pongor, Distribution of sequence-dependent curvature in genomic DNA sequences. FEBS Letters, 1997. 406(1-2): p. 69-74. Gromiha, M.M., et al., Anisotropic elastic bending models of DNA. J. Biol. Phys., 1996. 22: p. 227243. Gromiha, M.M., et al., The role of DNA bending in Cro protein-DNA interactions. Biophys Chem, 1997. 69(2-3): p. 153-60. Munteanu, M.G., et al., Rod models of DNA: sequence-dependent anisotropic elastic modelling of local bending phenomena. Trends Biochem Sci, 1998. 23(9): p. 341-7. www.icgeb.org/dna. Bram, S., Variation of type-B DNA x-ray fiber diagrams with base composition. Proc Natl Acad Sci U S A, 1973. 70(7): p. 2167-70. Wang, J.C., Helical repeat of DNA in solution. Proc Natl Acad Sci U S A, 1979. 76(1): p. 200-3. Dickerson, R.E. and H.R. Drew, Kinematic model for B-DNA. Proc Natl Acad Sci U S A, 1981. 78(12): p. 7318-22. Dickerson, R.E. and H.R. Drew, Structure of a B-DNA dodecamer. II. Influence of base sequence on helix structure. J Mol Biol, 1981. 149(4): p. 761-86. Trifonov, E.N. and J.L. Sussman, The pitch of chromatin DNA is reflected in its nucleotide sequence. Proc Natl Acad Sci U S A, 1980. 77(7): p. 3816-20.
14
A
C
[16]
B
Figure 13: Analysis of breakpoint sequences in human chromosomal DNA A: Flexibility of DNA obtained from conformational energy calculations, expressed as dinucleotide twist, roll and tilt angles. Thick arrow: breakpoint. (plot.it server) B. Twist angles in a sequence 40 bp, determined from NMR data (empty circles), and as predicted based on conformational energy calculations. Thick arrow: breakpoint. (plot.it server) C. Predicted 3-D model of the short breakpoint motif CCAGCCTGG, built by the model.it server using the consensus scalel of DNA curvature, and the raw models being refined by simulated annealing (model.it server).
Marini, J.C., et al., A bent helix in kinetoplast DNA. Cold Spring Harb Symp Quant Biol, 1983. 47 Pt 1: p. 279-83. [17] Griffith, J., et al., Visualization of the bent helix in kinetoplast DNA by electron microscopy. Cell, 1986. 46(5): p. 717-24. [18] Ulanovsky, L., et al., Curved DNA: design, synthesis, and circularization. Proc Natl Acad Sci U S A, 1986. 83(4): p. 862-6. [19] Ulanovsky, L.E. and E.N. Trifonov, Estimation of wedge components in curved DNA. Nature, 1987. 326(6114): p. 720-2. [20] Diekmann, S., Sequence specificity of curved DNA. Febs Lett, 1986. 195(1-2): p. 53-6. [21] Koo, H.S. and D.M. Crothers, Calibration of DNA curvature and a unified description of sequencedirected bending. Proc Natl Acad Sci U S A, 1988. 85(6): p. 1763-7. [22] Haran, T.E., J.D. Kahn, and D.M. Crothers, Sequence elements responsible for DNA curvature. J Mol Biol, 1994. 244(2): p. 135-43. [23] Goodsell, D.S. and R.E. Dickerson, Bending and curvature calculations in B-DNA. Nucleic Acids Res, 1994. 22(24): p. 5497-503. [24] http://www.hgmp.mrc.ac.uk/Software/EMBOSS/. [25] http://www.hgmp.mrc.ac.uk/Software/EMBOSS/interfaces.html. [26] http://esti.haifa.ac.il/~leon/cgi-bin/curvatur/. [27] Shpigelman, E.S., E.N. Trifonov, and A. Bolshoy, CURVATURE: software for the analysis of curved DNA. Comput Appl Biosci, 1993. 9(4): p. 435-40. [28] http://www-personal.umich.edu/~mensur/software.html . [29] Pedersen, A.G., et al., A DNA structural atlas for Escherichia coli. J Mol Biol, 2000. 299(4): p. 907-30. [30] Jensen, L.J., C. Friis, and D.W. Ussery, Three views of microbial genomes. Res Microbiol, 1999. 150(9-10): p. 773-7. [31] Vlahovicek, K., A. Gabrielian, and S. Pongor, Prediction of bendability and curvature in genomic DNA. J. Mathematical Modelling and Scientific Computing, 1998. 9 : p. 53-57. [32] Ulyanov, N.B. and T.L. James, Statistical analysis of DNA duplex structural features. Methods Enzymol, 1995. 261(120): p. 90-120. [33] Bolshoy, A., et al., Curved DNA without A-A: experimental estimation of all 16 DNA wedge angles. Proc Natl Acad Sci U S A, 1991. 88(6): p. 2312-6.
14
15
[34] [35] [36] [37] [38]
[39] [40] [41] [42] [43] [44] [45] [46] [47] [48] [49] [50] [51] [52] [53] [54] [55] [56]
15
Olson, W.K., et al., Influence of fluctuations on DNA curvature. A comparison of flexible and static wedge models of intrinsically bent DNA. J Mol Biol, 1993. 232(2): p. 530-54. Vlahovicek, K. and S. Pongor, Model.it: building three dimensional DNA models from sequence data. Bioinformatics, 2000. 16(11): p. 1044-5. Guex, N. and M.C. Peitsch, SWISS-MODEL and the Swiss-PdbViewer: an environment for comparative protein modeling. Electrophoresis, 1997. 18(15): p. 2714-23. Sayle, R.A. and E.J. Milner-White, RASMOL: biomolecular graphics for all. Trends Biochem Sci, 1995. 20(9): p. 374. Macke, T. and D.A. Case, Modeling unusual nucleic acid structures, in Molecular Modeling of Nucleic Acids, N.B. Leontes and J. SantaLucia, Editors. 1998, American Chemical Society: Washington DC. p. 379-393. Case, D.A., et al., AMBER 5. 1997, University of California: San Francisco. Barta, E., L. Kajan, and S. Pongor, IS: A web-site for introns statistics. Bioinformatics, 2003. 19: p. 543. Long, M., S.J. de Souza, and W. Gilbert, Evolution of the intron-exon structure of eukaryotic genes. Curr Opin Genet Dev, 1995. 5(6): p. 774-8. Kriventseva, E.V. and M.S. Gelfand, Statistical analysis of the exon-intron structure of higher and lower eukaryote genes. J Biomol Struct Dyn, 1999. 17(2): p. 281-8. Tosato, V., et al., The DNA secondary structure of the Bacillus subtilis genome. FEMS Microbiol Lett, 2003. 218(1): p. 23-30. http://bioweb.pasteur.fr/GenoList/SubtiList. McDonagh, P.D., P.J. Myler, and K. Stuart, The unusual gene organization of Leishmania major chromosome 1 may reflect novel transcription processes. Nucleic Acids Res, 2000. 28(14): p. 2800-3. Tosato, V., et al., Secondary DNA structure analysis of the coding strand switch regions of five Leishmania major Friedlin chromosomes. Curr Genet, 2001. 40(3): p. 186-94. Myler, P.J., et al., Genomic organization and gene function in Leishmania. Biochem Soc Trans, 2000. 28(5): p. 527-31. Martinez-Calvillo, S., et al., Transcription of Leishmania major Friedlin chromosome 1 initiates in both directions within a single region. Mol Cell, 2003. 11(5): p. 1291-9. Szabo, G., Jr., F. Boldog, and N. Wikonkal, Disassembly of chromatin into approximately equal to 50 kb units by detergent. Biochem Biophys Res Commun, 1990. 169(2): p. 706-12. Szabo, G., Jr., 50-kb chromatin fragmentation in the absence of apoptosis. Exp Cell Res, 1995. 221(2): p. 320-5. Gal, I., et al., Protease-elicited TUNEL positivity of non-apoptotic fixed cells. J Histochem Cytochem, 2000. 48(7): p. 963-70. Varga, T., I. Szilagyi, and G. Szabo, Jr., Single-strand breaks in agarose-embedded chromatin of nonapoptotic cells. Biochem Biophys Res Commun, 1999. 264(2): p. 388-94. Szilagyi, I., et al., Non-random features of loop-size chromatin fragmentation. J Cell Biochem, 2003. 89(6): p. 1193-205. Bansal, M., D. Bhattacharyya, and S. Vijaylakshmi, NUVIEW: software for display and interactive manipulation of nucleic acid models. Comput Appl Biosci, 1995. 11(3): p. 289-92. Sarai, A., et al., Sequence dependence of DNA conformational flexibility. Biochemistry, 1989. 28(19): p. 7842-9. De Santis, P., et al., Validity of the nearest-neighbor approximation in the evaluation of the electrophoretic manifestations of DNA curvature. Biochemistry, 1990. 29(39): p. 9269-73.