March/April 2007 ⢠Vol 97 ⢠No 2 ⢠Journal of the American Podiatric Medical Association. Celebrating100years of continuous publication:1907â2007.
ORIGINAL ARTICLES
Prediction of Dynamic Foot Posture During Running Using the Longitudinal Arch Angle Thomas G. McPoil, PhD, PT, ATC* Mark W. Cornwall, PhD, PT, CPed* Background: A study was conducted to determine whether the longitudinal arch angle can be used to predict dynamic foot posture during running. Methods: Seventeen healthy, experienced runners participated in the study. The static longitudinal arch angle was determined from a digital image of the medial aspect of each subject’s feet obtained in relaxed standing posture. For the dynamic phase, subjects were asked to walk across a 12-m walkway and then to run across a 25-m runway while the medial aspect of each foot was videotaped. The longitudinal arch angle was digitized from the video images at midstance in walking and at midsupport while running for five trials per extremity. Results: The longitudinal arch angle obtained in relaxed standing posture was highly predictive of dynamic foot posture at midstance in walking (r 2 = 0.854) and at midsupport while running (r 2 = 0.846). Conclusions: The static measurement of longitudinal arch angle is highly predictive of dynamic foot posture during walking and running. The longitudinal arch angle measured in relaxed standing posture significantly contributed to explaining more than 85% of the variance associated with the longitudinal arch angle position at midstance during walking and at midsupport while running. These results seem to validate use of the longitudinal arch angle as part of the foot and ankle physical examination. (J Am Podiatr Med Assoc 97(2): 102-107, 2007)
Foot morphology has long been associated with overuse injuries of the lower extremity during running. In early work on the subject, Brody1 and James et al2 indicated that an excessively pronated or low-arch foot type could contribute to the development of lowerextremity overuse injuries. The proposed rationale for this contribution to injury is that an excessively pronated foot type could cause increased stress on the medial structures of the foot and ankle and on more proximal joints in the lower extremity.3 Several studies have attempted to assess the relationship between foot type and the development of an overuse injury in the lower extremity during running. Giladi et al4 prospectively studied 295 male military recruits and reported that recruits with high arches were at greater risk for stress fractures of the lower leg and foot than those with low arches. Cowan et al5 *Department of Physical Therapy, Gait Research Laboratory, Northern Arizona University, Flagstaff. Corresponding author: Thomas G. McPoil, PhD, PT, CPed, Department of Physical Therapy, Gait Research Laboratory, Northern Arizona University, Box 15105, Flagstaff, AZ 86011.
also reported a higher incidence of overuse foot and knee injuries in military recruits with high arches. Dahle et al6 studied the relationship between foot type and the occurrence of ankle and knee injury in 55 athletes participating in American football and cross-country running. They found a significant relationship between athletes who experienced knee pain and those classified as having either a pronated or a supinated foot type. Williams et al7 assessed the relationship between foot type and lower-extremity injury in 40 recreational and team runners. They reported that the most common injuries in runners with high arches were lateral ankle sprains, plantar fasciitis, iliotibial band syndrome, and fifth metatarsal stress fractures. The most common injuries affecting the low-arch group of runners were knee pain, patellar tendinitis, plantar fasciitis, and second and third metatarsal stress fractures. On the basis of the results of these studies, it seems that an assessment of foot structure should be included in the physical examination. In selecting an appropriate foot structure assessment method, the Celebrating 100years of continuous publication:1907–2007
102
March/April 2007 • Vol 97 • No 2 • Journal of the American Podiatric Medical Association
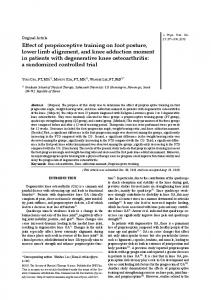
procedure not only should provide a measurement of static foot posture but also ideally should allow the clinician to predict dynamic foot posture during activities such as walking and running. In addition, the foot measurement selected should demonstrate a high degree of intrarater and interrater reliability.8 The longitudinal arch angle (LAA), first described by Dahle et al,6 has been reported to have a high degree of reliability and to be predictive of dynamic foot posture during walking. The LAA is operationally defined as the angle formed by two lines: one line passing through the midpoint of the medial malleolus and the navicular tuberosity and a second line passing through the midpoint of the medial aspect of the first metatarsal head and the navicular tuberosity (Fig. 1). The apex of the LAA is the navicular tuberosity. Dahle et al6 used the LAA to visually and subjectively assess the medial longitudinal arch posture in 55 athletes. In their study, subjects visually observed to have an LAA close to 90° were classified as having a low arch and those with an LAA close to 180° were considered to have a high arch. Subjects with an LAA of 120° to 150° were classified as having normal arches. Although Dahle et al did not attempt to objectively measure the LAA, they did report a substantial degree of within-rater reliability using visual assessment of the LAA. Sommer and Vallentyne9 attempted to use the LAA to retrospectively determine the development of medial tibial stress syndrome in 25 folk dancers. They objectively measured the LAA in 14 dancers with a history of medial tibial stress syndrome and in 36 symptom-free feet. They concluded that an LAA of less than 140° was accurate in determining the risk of
medial tibial stress syndrome. Although these authors reported that the mean LAA was 137° for the injured group and 145° for the symptom-free group, they did not provide any further descriptive statistics that would permit assessment of the variability of the LAA measurement. Jonson and Gross10 assessed the LAA in 63 healthy navy recruits as part of a study assessing within-rater and interrater reliability of lower-extremity and foot skeletal measurements. They reported that the mean (SD) LAA for this group was 141.6° (7.67°) (range, 122° to 160°). Unlike previous static measurements of the foot, they found the LAA to be a highly reliable measure, with intraclass correlation coefficients (ICCs) of 0.90 for within-rater reliability and 0.81 for interrater reliability established using two examiners. McPoil and Cornwall11 used the LAA in an attempt to predict the position of the foot at midstance in walking using 50 healthy subjects. They found that the LAA in relaxed standing posture was highly predictive of the LAA position recorded at midstance during walking, explaining more than 90% of the variance. These authors also reported no differences in the LAA between the sexes or extremities and acceptable levels of intrarater and interrater reliability using a separate subgroup of 42 subjects. On the basis of the results of these previous investigations, the LAA 1) seems to be a consistent measure of the bony architecture of the medial longitudinal arch, 2) is prognostic of the dynamic foot posture at midstance during walking, and 3) may have some predictive value in determining the risk of lower-extremity injuries. A key question that remains to be answered, however, is whether the LAA would be predictive of dynamic foot posture during more aggressive physical activities, such as running. Thus the purpose of this study was to determine whether the LAA, measured in relaxed standing posture, could be used to predict dynamic foot posture during running and walking.
Methods Subject Characteristics
Figure 1. The longitudinal arch angle (LAA) is operationally defined as the angle formed by two lines: one line passing through the midpoint of the medial malleolus and the navicular tuberosity and a second line passing through the midpoint of the medial aspect of the first metatarsal head and the navicular tuberosity.
Seventeen healthy subjects (8 men and 9 women) voluntarily consented to participate in this study. The mean age of the subjects was 40.8 years (age range, 24–59 years). None of the subjects selected had any history of lower-extremity trauma or injury 6 months before data collection, and none had traumatic or congenital deformities of either lower extremity. The study subjects had been runners for a mean of 12 years (range, 2–30 years). The typical distance run
Celebrating 100years of continuous publication:1907–2007
Journal of the American Podiatric Medical Association • Vol 97 • No 2 • March/April 2007
103
per week was 32 miles. The average subject running pace for training was 7.2 mph (range, 6–10 mph). A Northern Arizona University–based human subjects review board approved the protocol for the study, and each subject gave informed consent before participation. All of the subjects were informed that they could withdraw from the study at any time.
Procedures Each subject was first asked to stand in the middle of a 25-m runway so that the midpoint of the medial malleolus, the tuberosity of the navicular bone, and the midpoint of the medial aspect of the first metatarsal head could be identified by means of palpation and their locations marked on the skin. Subjects were then instructed to place their feet 6 inches apart while maintaining the medial border of their right foot along the midline of the runway. Next they were asked to slide the left foot backward so that the hallux was in line with the posterior aspect of the heel of the right foot. After being instructed to maintain a relaxed standing posture and place equal weight on both feet, a video image was obtained of the medial aspect of the right foot and then the left foot. The video camera used to capture the image (SR series motion recorder; Eastman Kodak Co, San Diego, California) was connected to a videocassette recorder (model GV-550; Sony Corp, New York, New York). Video images from the camera were recorded at 60 fields per second for all static and walking trials. For all running trials, video images were recorded at 250 fields per second. The camera was calibrated using a known linear distance in the field of view to correct for any lens aberrations that might affect the linear measurements. The video camera was positioned 2 m from the midpoint of the 25-m runway with the lens perpendicular to the midline. The subject was continuously observed during the 2 sec required to obtain the video image to ensure that the relaxed standing and equal weightbearing posture was maintained. Once the static foot image was recorded, the procedure was repeated for the left foot. The subjects were then instructed to practice walking barefoot at a self-selected speed along the middle 12 m of the 25-m runway. Walking speed was monitored using two infrared photocells (Tandy Corp, Fort Worth, Texas) positioned 6 m apart and connected to a digital timer (model 54030; Lafayette Instrument Co, Lafayette, Indiana). When between-trial walking speed was consistent (variation of less than 5% between trials), the subject was asked to walk barefoot over the 12-m section of the runway five times in each direction
while video images of the medial aspect of both feet were recorded. After the walking trials were completed for each foot, the subject was asked to move to one end of the 25-m runway and to practice running across the runway at a self-selected speed. Running speed was again monitored using the infrared photocells, and when between-trial running speed was consistent (variation of less than 5% between trials), the subject was asked to run barefoot over the 25-m runway five times in each direction while video images of the medial aspect of both feet were recorded.
Data Analysis A video copy processor (model P71U; Mitsubishi, Cypress, California) was used to print the static and dynamic video images. Five dynamic video images for midstance in walking and for midsupport in running, in addition to the relaxed standing posture image, were obtained for both feet of each subject. Midstance during walking was determined by first calculating the number of video frames for the entire stance phase, beginning with heel contact and ending with toe-off, and then calculating the midpoint frame. The position of midstance was selected for analysis because previous studies12, 13 assessing rearfoot and midfoot motion during walking indicated that the maximum degree of foot pronation occurs at between 50% and 55% of the stance phase. To determine midsupport in running, the frame in which the medial longitudinal arch (as indicated by the dorsum of the foot just above the mark on the navicular tuberosity) reached its most plantar position before the heel left the supporting surface was recorded. Once all of the video images were obtained, the LAA was measured and recorded for each image using a digitizing tablet (model 34120; GTCO Calcomp Inc, Columbia, Maryland). The LAA, when measured from static and dynamic video images using a digitizing tablet, has previously been shown to have acceptable levels of intrarater and interrater reliability.11
Statistical Analysis In addition to descriptive statistics, type (2,1) ICCs were calculated to ensure that the walking and running speeds used by each subject for the five walking and running trials per foot were consistent.14 The level of consistency, or reliability, for the ICC was classified using the characterizations reported by Landis and Koch15: slight, the coefficient would range from 0 to 0.20; fair, 0.21 to 0.40; moderate, 0.41 to 0.60; substantial, 0.61 to 0.80; and almost perfect, 0.81 to 1.00. The standard error of measurement (SEM) Celebrating 100years of continuous publication:1907–2007
104
March/April 2007 • Vol 97 • No 2 • Journal of the American Podiatric Medical Association
was also calculated to determine the level of reliability of the LAA measurements obtained statically and dynamically. The SEM is a number in the same units as that of the original measurement and represents the way a single score will vary if the LAA were measured more than once.16 In assessing the level of reliability for the SEM, a confidence limit of 95% is usually used. Thus the SEM should be less than 5% of the mean measurement value to be considered reliable. T tests were used to determine whether differences in the LAA occurred between extremities. Pearson product moment correlations were then used to determine the ability of the static LAA measurements obtained in relaxed standing posture to predict the dynamic LAA at midstance in walking and at midsupport in running. An ! of .01 was established for all tests of significance.
Results Means, SDs, and SEMs for the LAA in relaxed standing posture, midstance, and midsupport are listed in Table 1. The mean ± SD value for stance phase duration in walking was 0.567 ± 0.038 sec and for support phase duration in running was 0.242 ± 0.028 sec. The ICC values for the five walking and running trials for each extremity were 0.90 and 0.85, respectively. The SEMs calculated for the LAA obtained in static relaxed standing posture, midstance in walking, and midsupport in running were all less than 5% of the mean values. The results of the t test indicated no significant differences in the LAA between the left and right feet for static relaxed standing posture, midstance in walking, and midsupport in running. On the basis of these findings, the left and right feet were combined (n = 34) for Pearson correlations. The Pearson product moment correlation coefficient for the LAA measured in relaxed standing posture in relation to the dynamic LAA measured at midstance in walk-
ing was 0.924 (r 2 = 0.854) and at midsupport in running was 0.920 (r 2 = 0.846).
Discussion Our initial concern in interpreting the results of this investigation was whether stance phase and support phase durations were consistent for the walking and running conditions, respectively. The consistency of the stance phase and support phase durations is an important issue because increased variability could indicate that the subject’s speed of walking or running was different in the five trials collected for each extremity. The ICCs for the stance phase and support phase durations for the five walking trials for each extremity were 0.90 and 0.85, respectively, and would be “almost perfect” according to the criteria of Landis and Koch.15 On the basis of the ICC values obtained, the authors concluded that the stance phase and support phase durations were extremely consistent among the walking and running trials and that further analysis of the results could be performed. The purpose of this study was to determine whether the LAA, measured in relaxed standing posture, could be used to predict dynamic foot posture during running and walking. The Pearson product moment correlation coefficients indicate that the static LAA measurement obtained in relaxed standing posture could explain more than 84% of the variance associated with the LAA measured at the point of midsupport in running and 85% of the variance associated with the LAA measured at the point of midstance in walking. As a result of this high degree of association, the clinician can predict the LAA at midstance in walking by using the following formula: 16.602 + 0.856 × static LAA. To predict the LAA at midsupport during running, the clinician would use the following formula: 5.093 + 0.896 × static LAA. On the basis of these re-
Table 1. Longitudinal Arch Angle Measurements in Relaxed Standing Posture, at Midstance During Walking, and at Midsupport While Running Foot
Relaxed Standing Posture Mean SD SEM
Midstance Walking Mean SD SEM
Midsupport Running Mean SD SEM
Left (n = 17)
137.4
133.6
127.8
8.2
2.0
7.0
1.7
8.3
2.1
Right (n = 17)
139.5
7.4
1.9
136.7
7.3
1.8
129.6
7.2
1.8
All (n = 34)
138.4
7.7
1.4
135.2
7.2
1.3
128.7
7.7
1.4
Abbreviation: SEM, standard error of measurement. Note: Data are given in degrees. Celebrating 100years of continuous publication:1907–2007
Journal of the American Podiatric Medical Association • Vol 97 • No 2 • March/April 2007
105
sults, the static measurement of the LAA obtained in relaxed standing posture is highly predictive of the dynamic posture of the foot that occurs at midsupport during running and at midstance during walking. To provide an example using the previously mentioned formulas, if the clinician measured the static LAA for a patient’s right foot to be 150°, the midstance LAA in walking for the right foot would be predicted to be 145° (16.602 + 0.856 × 150°) and the LAA at midsupport in running for the right foot would be predicted to be 139.5° (5.093 + 0.896 × 150°). These results would also validate use of the LAA as a component of the physical examination of the foot and ankle. The results of the present study are also in agreement with the previous findings of McPoil and Cornwall,11 who reported that the LAA in relaxed standing posture was highly predictive of the LAA position recorded at midstance during walking, explaining more than 90% of the variance. Previous studies 9, 10 have reported mean values for the LAA measured in relaxed standing posture ranging from 141° to 145° collected on groups of 65 subjects or fewer. McPoil and Cornwall11 reported a mean ± SD LAA measured in relaxed standing posture of 139.8° ± 10.5° (standard error of measurement, 0.8°) based on a sample of 92 subjects or 184 feet. The mean ± SD LAA obtained for relaxed standing posture in the present study was 138.4° ± 7.70° (SEM, 1.4°). The LAA would, therefore, seem to be a consistent measure of foot morphology even when obtained from different, heterogeneous groups of subjects. The present study used two-dimensional (2-D) motion-analysis methods to assess movement of the LAA from a lateral or sagittal plane view during running and walking. Previous studies17, 18 have discussed the problem of using 2-D motion analysis for assessing rearfoot motion during running. Areblad et al18 compared the results obtained using 2-D and three-dimensional (3-D) motion-analysis methods based on different alignment angles between the posterior view of the rearfoot and the camera axis. They reported that 2-D angular values measured from a posterior view were very sensitive to the camera alignment angle. Areblad et al further noted, however, that 2-D angular values measured from a lateral view were not sensitive to foot/camera alignment and provided a result well in line with 3-D motion-analysis results. Although the study by Areblad et al illustrates the errors encountered when using 2-D motion analysis to record angular movement of the rearfoot from a posterior view, it validates the dynamic LAA values obtained for running and walking in the present study because they reported that angular values obtained from a lat-
eral view of the foot using 2-D techniques are similar to values obtained using 3-D analysis techniques.
Conclusion The results of this study indicate that static measurement of the LAA obtained in a relaxed standing posture is highly predictive of dynamic posture of the foot at midsupport in running and at midstance in walking. The use of static foot measurements, such as the LAA, that can predict dynamic foot posture can help the clinician understand how the static foot posture of the patient can change during activity without having to perform more complex and time-consuming multidimensional gait-analysis procedures. On the basis of the findings of this study, the LAA should be included as a component of the foot and ankle physical examination. Financial Disclosures: None reported. Conflict of Interest: None reported.
References 1. BRODY DM: Techniques in the evaluation and treatment of the injured runner. Orthop Clin North Am 13: 541, 1982. 2. J AMES SL, B ATES BT, O STERNIG LR: Injuries to runners. Am J Sports Med 6: 40, 1978. 3. MCCLAY I, MANAL K: A comparison of three-dimensional lower extremity kinematics during running between excessive pronators and normals. Clin Biomech 13: 195, 1998. 4. G ILADI M, M ILGROM C, S IMKIN A, ET AL : Stress fractures and tibial bone width: a risk factor. J Bone Joint Surg Br 69: 326, 1987. 5. C OWAN DN, J ONES BH, F RYKMAN PN, ET AL : Lower limb morphology and risk of overuse injury among male infantry trainees. Med Sci Sports Exerc 28: 945, 1996. 6. D AHLE LK, M UELLER M, D ELITTO A, ET AL : Visual assessment of foot type and relationship of foot type to lower extremity injury. J Orthop Sports Phys Ther 14: 70, 1991. 7. WILLIAMS DS III, MCCLAY IS, HAMILL J: Arch structure and injury patterns in runners. Clin Biomech 16: 341, 2001. 8. VAN G HELUWE B, K IRBY KA, R OOSEN P, ET AL : Reliability and accuracy of biomechanical measurements of the lower extremities. JAPMA 92: 317, 2002. 9. S OMMER HM, VALLENTYNE SW: Effect of foot posture on the incidence of medial tibial stress syndrome. Med Sci Sports Exerc 27: 800, 1995. 10. JONSON SR, GROSS MT: Intraexaminer reliability, interexaminer reliability, and mean values for nine lower extremity skeletal measures in healthy naval midshipmen. J Orthop Sports Phys Ther 25: 253, 1997. 11. MCPOIL TG, CORNWALL MW: Use of the longitudinal arch angle to predict dynamic foot posture in walking. JAPMA 95: 114, 2005. 12. PIERRYNOWSKI MR, SMITH SB: Rear foot inversion/eversion during gait relative to the subtalar joint neutral position. Foot Ankle Int 17: 406, 1996. 13. CORNWALL MW, MCPOIL TG: Three-dimensional movement Celebrating 100years of continuous publication:1907–2007
106
March/April 2007 • Vol 97 • No 2 • Journal of the American Podiatric Medical Association
of the foot during the stance phase of walking. JAPMA 89: 56, 1999. 14. S HROUT PE, F LEISS JL: Intraclass correlations: uses in assessing rater reliability. Psychol Bull 86: 420, 1979. 15. LANDIS JR, KOCH GG: The measurement of observer agreement for categorical data. Biometrics 33: 159, 1977. 16. ROTHSTEIN JM: “Measurement and Clinical Practice: Theory and Application,” in Measurement in Physical Ther-
apy, ed by JM Rothstein, p 1, Churchill Livingstone, New York, 1985. 17. MCCLAY I, MANAL K: The influence of foot abduction on differences between two-dimensional and three-dimensional rearfoot motion. Foot Ankle Int 19: 26, 1998. 18. A REBLAD M, N IGG BM, E KSTRAND K, ET AL : Three-dimensional measurement of rearfoot motion during running. J Biomech 23: 933, 1990.
Celebrating 100years of continuous publication:1907–2007
Journal of the American Podiatric Medical Association • Vol 97 • No 2 • March/April 2007
107