Computational Research Progress in Applied Science & Engineering ©PEARL publication, 2016 ISSN 2423-4591 CRPASE Vol. 02(03), 110-115, July 2016
Prediction of Energy Consumption by Using Regression Model Sanaz Tabasi, Alireza Aslani, Habib Forotan Department of Renewable Energy and Environment, Faculty of New Sciences and Technologies, University of Tehran
Keywords
Abstract
Energy System, Renewable energy, Regression.
Energy crisis is one of the problems that lead to different changes for countries. Increasing this matter in different countries has made them substitute alternative and renewable energies instead of other resources. Which in turn has brought about development that contributes to sustainability In this work, we analyzed the energy supply and demand in Germany for describing energy consumption in each sector. Considering the energy balance sheet data, the correlation between energy consumption and some basic parameters such as GDP, population growth, and industrial growth rate is analyzed through a regression model. Regarding the model, energy consumption in 2022 is predicted as 209018.1 Mtoe. According to the model, a significant decrease in energy consumption is obtained which is the consequence of renewable energy use in each sector.
1. Introduction Energy is one of the most important topics in the past, present, and future of mankind. The complexity and importance of the issues related to it have never been as it is today. There are the very different issues related to energy management and programming which make it difficult to get a catch on energy matters. For instance, complexity in supply and demand indicators, global and regional markets status, and environmental impacts are such subjects which make it sophisticated to simply discuss energy related matters as well [1]. Economic growth and global energy demand augmentation caused oil and gas prices increase and also decrease the reliance on these sources for energy. Therefore, other resources replacement is one of the best choices for primary energy [2]. One of the most controversial debates is fossil fuels consumption in developed countries which have increased in recent years. Therefore, the matter of emissions and existence of resources related to fossil fuels, roll as a basic concerning in many countries.as for the solution, renewable energies can get a good result. In order to replace renewable energies, recognizing energy demand trend is one of the most important targets [3]. This article aims to analyze energy consumption in Germany. Electricity consumption in various sectors incorporates industry, residential, and transportation is investigated. Then, with using forecasting tools, the best
Corresponding Author: E-mail address:
[email protected] Received: 22 March 2016; Accepted: 30 June 2016
regression model is presented and applied for 2022 energy consumption prediction. Subsequent examination of regression shows the impact of basic parameters on energy demand together. Parameters include GDP, population growth, and industrial growth rate which can influence on energy consumption individually. 2. Literature Review 2.1. Country Situation Germany is one of the central Europe countries, with an area of 357121. 41 Km2 by 2015. According to the statistics, it has 79,758,764 inhabitants and is the most populous country in Europe (with 223 Km2 population density) [4]. The country has a temperate climate and is the third largest exporter of goods and services in the world. Also, Germany has the third largest economy in the world and the first in Europe. On the other hand, it is the sixth country taking into account energy consumption which is extremely dependent on exports. Around 60% of its energy supplied from other countries. Because of the central location, it is called transportation node in order to link countries. Approximately, about a third of energy consumption is consumed in industry. Whereas, transportation and residential sectors consume about a quarter of energy consumption [3]. The use of renewable energy saved 30 billion euro compared with consumption patterns without the presence of renewable energy in the years 2011 to 2013 [5]. Almost a
Tabasi et al. - Comput. Res. Prog. Appl. Sci. Eng. Vol. 02(03), 110-115, July 2016
third of all solar panels and more than half wind turbines of the entire world are made by Germany [3]. Figure1 shows the share of energies in Germany compared in 3 individual years. Thus, the share of renewable energies is increased with nuclear fading.
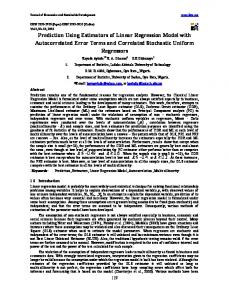
2.2.1. Production A number of renewable energies production is reported 33680 Mtoe in 2013 (12% of total energy consumption). Total energy production is presented 35% which 20% is related to renewable energies. Figure 2 depicts the share of renewable energies in 2015. 4%3% 8% 19% 56% 10%
Figure 1. the share of energies in Germany compared in 3 individual years [3]
Hydropower
2.2. Germany’s Energy Balance Analysis
Geothermal
Waste
Wind
solar
Biomass
Figure 2. Share of renewable energies in 2015
Based on Germany’s energy balance, the total primary energy supply (TPES) in 2013 considered as 317 Mtoe which has increased about 2% compared with last year. This rise is caused by an increase in imports. Primary energy is supplied from resources such as coal (25% of production and imports), oil (30% of imports), natural gas (23% of imports), nuclear energy (8% of production), and biodiesel (9% of production) [3].
2.2.2. Consumption Total energy consumption is reported 218 Mtoe in 2011, 220 Mtoe in 2012 (1% increase), and 224 Mtoe in 2013 (1% increase). Figure 3 represents the share of energy consumption by sectors in 2011-2013. This trend is shown that the energy consumption in different parts of Germany is relatively stable and completely under control [3].
Energy consumption by sectors in 2011, 2012, 2013
Energy Consumption %
Industry
Transportation
Residential
Public services
other
100% 80% 60% 40% 20%
29%
28% 18% 17% 18%
18% 17% 18%
10%
29% 17% 17% 18%
11%
9%
0%
2011
2012
Year
2013
Figure 3. The share of energy consumption by sectors in 2011-2013 [3]
2.3. Germany’s Electricity Consumption Analysis Electricity consumption has surged over the past 10 years (Figure 4) [3]. The use of renewable energies reduces electricity prices in recent years [5]. In recent years, renewable power installed capacity has increased in Germany and reached 76 thousand MW by the end of 2012 [6]. Figure 5 plots the share of power generation by each resource in 2014.
4% 17%
10% 7% 10%
27%
6% 600
19%
590 580
Nuclear
Brown Coal Hard Coal
560
Natural Gas
Wind
550
Biogas
Hydro
570
Solar
540 2003 2004 2005 2006 2007 2008 2009 2010 2011 2012 2013
Figure 5. Share of power generation by each resource in 2014 [7] Figure 4. Electricity consumption over the past 10 years
111
Tabasi et al. - Comput. Res. Prog. Appl. Sci. Eng. Vol. 02(03), 110-115, July 2016
2.4. Germany’s Industrial Energy Consumption
Regarding the industrial trend, it is almost constant during this period. While there are 2 reductions in residential energy consumption [3].
In 2013, the most important primary energy which is used to supply energy demand in the industry reported the electricity (33%). According to Germany’s energy balance, it is obtained that the share of coal, biodiesel, oil product and heat is 4%, 32%, 11%, and 14% respectively. Furthermore, data is shown that the use of renewable energies and their production capacity is rising during recent years.
70000
60000 50000 40000
residental industry
30000
2.5. Germany’s Residential Energy Consumption
20000
The country is gradually reducing its dependence on fossil fuels, thus turning more and more to renewable technologies. It is much obvious in residential part with using geothermal energy as a point of view. On the other hand, the use of fossil fuels is still noticeable where natural gas and oil products are 38% and 23% respectively [3]. To be exact, 60% of total energy is used for space heating, 15% for water heating, and 17% for equipment. As regards renewable energy, about 5% of buildings equipped with solar water heaters in 2012. Among 2000 to 2008, around 20% energy efficiency added which is refer to the residential sector. Further, this number increased 5% during 2009-2012 [3].
10000
2013
2012
2011
2010
2009
2008
2007
2006
2005
2004
2003
0
Figure 6. Industrial and residential consumption trends during 10 years [3]
2.7. Germany’s transportation energy consumption Oil products are considered as the main resource for transportation demand which comprises 92% in 2013. Bioenergy is used as 5%, thus remain are natural gas and electricity. According to statistics, there existed no change in 2012, although total energy consumption increased in 2013. Furthermore, 5.4% of the energy needs in transport sector were covered by renewables in 2014 (Figure 7) [8].
2.6. A Comparison Between Residential and Industry Sectors According to energy balance data in 10 years, the industrial and residential trend is plotted (Figure 6).
Figure 7. The energy needs in transport sector were covered by renewables in 2014 [8]
3. Forecasting Methods Review
4. Energy Forecasting Reviews in Germany
Energy models are standard tool for energy planning. In recent years, efforts have been made for formulation and implementation of energy planning strategies. Therefore, different energy models have identified all around the world. In this study, considering the energy demand trend for each country, the best model is predicted.
Energy demand prediction is one of the most important concerns all around the world whose solution is evaluated by models and policies in order to take key decisions affecting the economy of a country. Different experiments have been conducted for the estimation of energy demand, in both terms of methodology and estimation [9]. Studies show an error of lower than 2% through a model applied in Spain [10]. A future energy model on the basis of bottom112
Tabasi et al. - Comput. Res. Prog. Appl. Sci. Eng. Vol. 02(03), 110-115, July 2016
up system introduced in Germany. The new IKARUSModel described is a time-step or myopic dynamical bottom-up linear optimization model where each time interval is optimized by itself taking into account the heritage due to results from all periods before. Recent calculations of this model are shown reasonable results [11]. General energy transition time-series based models introduced to evaluate renewable energies consumption and the benefits of this technology replacement with the passages of time [12]. Moreover, an electricity demand
response potential model with a high share of renewable energies presented in Germany. In a case study considering a future German power supply system with a share of 70% renewable energies, possible cost reductions achieved by investment [13]. Hence, several models were analyzed and identified as the most accurate. The very common models used in this country are MAED-2, FfE-Gebäudemodell, CDEM, REM, CREEM, ECCABS, REEPS, BREHOMES, LEAP, DECM, CHM, BSM [14-16](see Table 1).
Table 1. The very common energy models Model Name LEAP (Long-range Energy Alternatives Planning)
Developer SEI—Stockholm Environment Institute, Tellus Institute, USA
FfE Gebäudemodell (Forschungsstelle für EnergiewirtschaftGebäudemodel)
Forschungsstelle für Energiewirtschaft e.V. (FfE), Germany
REM (Regional Engineering Model)
University of Joensuu, Finland
BSM (bottom-up BuildingStock-Model)
Karlsruhe Institute of Technology, Germany
MAED-2 (Model for Analysis of Energy Demand)
International Atomic Energy Agency, Austria
ECCABS (Energy, Carbon and Costs Assessment of Building Stocks)
Chalmers University of Technology, Sweden
CDEM (Community Domestic Energy Model)
Department of Civil and Building Engineering, Loughborough University, UK
CREEM (Canadian Residential Energy End-use Model) BREHOMES (Building Research Establishment Housing Model for Energy Studies) REEPS (Residential End-use Energy Planning System)
Canadian Residential Energy End-use Data and Analysis Centre, Canada Building Research Establishment (BRE), UK
DECM(Domestic Energy and Carbon Model)
CHM (Cambridge Housing Model)
Electric Power Research Institute, USA
The Martin Centre for Architectural and Urban Studies, Department of Architecture, University of Cambridge, UK Cambridge Architectural Research Ltd (CAR), UK
Model Description Integrated modeling tool that can be used for the analysis and evaluation of energy policies and the assessment of climate change mitigation measures across all sectors of an economy (housing, commercial, transportation and industry sectors). On the basis of available statistical data and distribution keys (floor space per building type, location of buildings, specific energy demand for space heating and hot water provision) this model allows to derive detailed conclusions for the energy demand in the German residential sector. Regional building stock model for assessing the energy demand for space heating and the related GHG emissions and costs. The model was validated using the province of North Karelia, Finland as case study area. Modular tool for predicting the building stock development (based on deterministic projections of floor space and demolition/refurbishment rates) and the energy demand (based on statistical data for the specific energy demand for space heating). The model is designed for analyzing the German federal government's energy policy targets for the residential sector. Based on medium- to long-term scenarios of socio-economic, technological and demographic developments this model allows the prediction of the future energy demand. Calculations are performed for the housing, commercial, transportation and industry sectors. Calculation of the annual energy demand, CO2 emissions and energy costs associated with the residential sector. This Model is designed to assess the effects of energy saving measures and CO2 emission mitigation strategies. Using the core calculation engine BREDEM-8 (Building Research Establishment Domestic Energy Model) this model calculates the monthly energy demand and CO2 emissions in the English residential sector, disaggregating the English housing stock into 47 house archetypes. Calculation of the annual and monthly energy demand and CO2 emissions in the Canadian residential sector. The Software HOT2000 is used as calculation engine. Disaggregation of the UK housing stock into over 1000 dwelling categories and calculation of the energy demand for each dwelling category with BREDEM-12. Evaluation of future trends in energy demand (based on forecasts for appliance installations, operating efficiencies, and utilization patterns for space heating, water heating, air conditioning and cooking) in the US housing sector, taking into account various user-defined assumptions and/or different development scenarios. Prediction of the energy demand and CO2 emissions of the existing English housing stock, using the core calculation engine SAP-2005 (Standard Assessment Procedure). An occupancy pattern is added to this model as a novel feature. Based on SAP-2009 the model generates estimates for the household energy demand for the UK Government’s Department of Energy and Climate Change (DECC).
113
Tabasi et al. - Comput. Res. Prog. Appl. Sci. Eng. Vol. 02(03), 110-115, July 2016
𝑌 = −1088663.837 − 3.359𝑋1 + 16128.479𝑋2 + 494.879𝑋3
5. Analysis of the Relationship between Consumption and Fundamental Economic Variables 5.1. Regression Analysis
(1)
According to Eq. (1), 𝑋1 , 𝑋2 , 𝑋3 are GDP, population growth and industrial production growth rate factors, respectively.
Table 2 represents regression results. As a result, the R square is calculated 0.83 which means the high relationship between energy consumption and the parameters above. Therefore, energy consumption prediction is possible considering the equation bellow
Table 2. Regression results Regression Statistics Multiple R R Square Adjusted R Square Standard Error Observations ANOVA
0.91117055 0.83023177 0.745347656 3344.454522 10 df 3 6 9 Coefficients -1088663.837 -3.359174408 16128.47925 494.8793617
Regression Residual Total Intercept GDP-billion 2005 USD population-millions Industrial Prodduction Grothe rate RESIDUAL OUTPUT
5.1.2. Energy Consumption Prediction
resulted. In future, on the basis of other influenced parameters, environmental consideration, different energy consumption patterns, changes in import and export, international commitment, and technology progressing, study and research in the field of energy will be conducted adequately in Germany.
Considering parameter’s trend, it is easily possible to predict each amount in one special year. Then, energy consumption is calculated yearly. Equations bellow are shown a linear relationship between year and each parameter. Year-GDP 𝑋1 = −19.999𝑥 + 3433.5
References
(2)
[1] J.B. Lesourd, J. Percebios, F. Valette, Models for energy policy, 2005. [2] I. Cadoreta, F. Padovano, The political drivers of renewable energies policies, Energy Economics 56 (2016) 261–269. [3] International Energy Agency, www.iea.org. [4] http://countrymeters.info/. [5] M. Dillig, M. Jung, J. Karl, The impact of renewables on electricity prices in Germany – An estimation based on historic spot prices in the years 2011–2013, Renewable and Sustainable Energy Reviews 57 (2016) 7–15. [6] B. Burger, Electricity production from solar and wind in Germany in 2014, FRAUNHOFER INSTITUTE FOR SOLAR ENERGY SYSTEMS ISE, Germany, 2014. [7] M. Pacesilaa, S.G. Burceaa, S.E. Colesca, Analysis of renewable energies in European Union," Renewable and Sustainable Energy Reviews 56 (2016) 156–170. [8] Christina Wulf, Martin Kaltschmitt , "Life cycle assessment of biohydrogen production as a transportation fuel in Germany," Bioresource Technology 150 (2013) 466–475. [9] A.A. Salisua, T.O. Ayindec, Modeling energy demand: Some emerging issues, Renewable and Sustainable Energy Reviews 54 (2016)1470–1480. [10] J. Sánchez-Oroa, A. Duartea, S. Salcedo-Sanzb, Robust total energy demand estimation with a hybrid Variable Neighborhood Search – Extreme Learning Machine algorithm, Energy Conversion and Management 123 (2016) 445–452.
Year- Population growth 𝑋2 = −0.0732𝑥 + 82.517
(3)
Year- Industrial growth rate 𝑋3 = −0.1939𝑥 + 2.6667
(4)
Using the above relations, energy consumption is calculated in 2022. 6. Conclusion Evaluations show a genuine prediction for energy demand from which energy consumption can be controlled and future target scenarios will be reached as well. In this work, energy consumption is predicted taking into account 3 basic parameters such as GDP, population growth, and industrial production rate. Further, Practical solutions and analysis in order to introduce a model is obtained. With using energy modeling scenarios, sustainable aims, and considering Germany’s policy in 2020, renewable energies can fill energy demand’s gaps. Moreover, emissions and dependence on other countries reduction are 114
Tabasi et al. - Comput. Res. Prog. Appl. Sci. Eng. Vol. 02(03), 110-115, July 2016 [11] D. Martinsen, V. Krey, P. Markewitz, S. Vögele, A New Dynamical Bottom-Up Energy Model for Germany-Model Structure and Model Results, Systems Analysis and Technology Evaluation (STE), 2012. [12] M. Guidolin, R. Guseo, The German energy transition: Modeling competition and substitution between nuclear power and Renewable Energy Technologies, Renewable and Sustainable Energy Reviews 60 (2016) 1498–1504.
[13] H.C. Gils, Economic potential for future demand response in Germany – Modeling approach and case study, Applied Energy 162 (2016) 401–415. [14] A.M. Soto, M.F. Jentsch, Comparison of prediction models for determining energy demand in the residential sector of a country, Energy and Buildings 128 (2016) 38–55. [15] The world bank, http://www.worldbank.org/. [16] Federal Ministry of Economics and Technology (BMWI), https://www.bmwi.de.
115