Kerry Hourigan ... blade row with either the Euler or the Navier-Stokes flow models. ... Navier-Stokes computations due to three-dimensionality of the cascade ...
Ivan McBean Alstom Power, Switzerland
Kerry Hourigan Mark Thompson Monash University, Australia
Feng Liu University of California, Irvine, California
Prediction of Flutter of Turbine Blades in a Transonic Annular Cascade A parallel multiblock Navier-Stokes solver with the k- turbulence model is used to solve the unsteady flow through an annular turbine cascade, the transonic Standard Test Case 4, Test 628. Computations are performed on a two- and three-dimensional model of the blade row with either the Euler or the Navier-Stokes flow models. Results are compared to the experimental measurements. Comparisons of the unsteady surface pressure and the aerodynamic damping are made between the three-dimensional, two-dimensional, inviscid, viscous simulations, and experimental data. Differences are found between the stability predictions by the two- and three-dimensional computations, and the Euler and Navier-Stokes computations due to three-dimensionality of the cascade model and the presence of a boundary layer separation, respectively. 关DOI: 10.1115/1.2060731兴
Introduction Aeroelasticity in turbomachinery has been recognized as one of the most important problems presently facing the designers of turbomachinery blades. The structural instability is due to the interaction between the unsteady aerodynamics and the structural dynamics of the blades. In the aeronautical industry, demand for lighter and more efficient machines is developing. In the power generation industry, there is a drive to increasingly large exhaust areas of low-pressure steam turbines, leading to longer blades. Under both of these conditions, turbine blades of present-day designs are more likely to react to the effects of dynamic loading due to unsteady aerodynamics. The coupling between the fluid and structure can lead to blade failure if in the design phase attention is not paid to the possibility of aeroelastic interaction. The aeroelastic interaction may be regarded as falling into one of two groups. One is forced response where the blades vibrate under periodic aerodynamic force of neighboring blade rows; however, there is sufficient mechanical or aerodynamic damping to limit the amplitude of the vibration. Blades under these conditions may fail under low- or high-cycle fatigue. The second is an unstable situation where there is insufficient damping in the system, and the amplitude of a self-excited vibration increases over time, until the blade fails. This second type of configuration is the focus of the models investigated in this paper. Although experimental studies play an important role in the research into this phenomenon, computational simulations provide a number of key advantages. These include the ability to represent the flow in the whole flow-field at significantly lower cost. Thus results may be studied, in detail, providing insights into flow behavior and flow structures. Marshall and Imregun 关1兴 provide a review of both classical and more modern numerical methods for aeroelastic predictions. Sophisticated simulation models that involve fully coupled and time-accurate fluid-structure computations have been developed for turbomachinery blade rows in recent years, where the motion of the blades are computed by computational structural dynamics under aerodynamic forcing while the flow is computed by an Euler or a Navier-Stokes flow solver with moving boundaries to accommodate the motion of the blades. Vahdati and Imregun 关2兴 presented a methodology for the three-dimensional aeroelasticity Contributed by the Fluids Engineering Division for publication in the JOURNAL OF FLUIDS ENGINEERING. Manuscript received by the Fluids Engineering Division November 2, 2004; final manuscript received: May 29, 2005. Associate Editor: Akira GOTO
Journal of Fluids Engineering
analysis of turbomachinery blades using an unstructured NavierStokes solver for the fluid and a modal model for the structure. Sayma et al. 关3兴 and Vahdati et al. 关4兴 extended the method for forced response predictions. Carstens et al. 关5兴 developed a structured-grid Navier-Stokes solver coupled with structural model for flutter simulations. Doi and Alonso 关6兴 coupled an unsteady flow solver with a commercially available finite element code for the structure. Liu et al. 关7兴 developed a multiblock, multigrid, and parallel time-accurate Navier-Stokes solver coupled with a modal model for the structures for flutter simulations of airfoils and wings. The method was also extended to turbomachinery blade vibrations Sadeghi et al. 关8兴. Although the aforementioned approaches represent a new step in computational analysis, their applications in a practical design environment still await development of faster computers, more efficient numerical algorithms, or both; and validation of such direct time-domain simulations remains to be fully investigated because of the lack of measurement data. In addition, experience with such codes by the design engineer must be developed. Consequently, more efficient methods using two-dimensional models, or Euler equations, and the energy method to determine flutter boundaries are still the major tools used in the design of turbomachinery blades. Discussions of these methods can be found in 关1,9–11兴. Under certain conditions, it is questionable that such approaches adequately represent turbine blade behavior under operating conditions. A major difficulty in the simulation of threedimensional aeroelasticity in turbomachinery is the lack of experimental measurements to validate numerical computations. Bell and He 关12兴 designed experiments and performed computations to study three-dimensional effects on blade flutter. Their studies, however, are limited to low sub-sonic conditions. The purpose of this paper is to quantify and document the differences between two- and three-dimensional computations and those between Euler and Navier-Stokes computations by comparing all of them with a relatively well-defined experimental test case, the transonic Standard Test Case 4, Test 628. The annular cascade geometry was investigated in a previous paper 关13兴 for the subsonic flow conditions. The investigation presented in this paper involves transonic flow conditions.
Model of Aeroelastic Configuration The model configuration was chosen so that it could be compared to experimental measurements thus providing a validation of the simulation and realistic boundary conditions. The case is known as Test 628, of standard configuration 4 of the standard
Copyright © 2005 by ASME
NOVEMBER 2005, Vol. 127 / 1053
Table 1 Aeroelastic parameters for standard configuration 4, Test 628 Condition Typical reference velocity Uref Bending mode direction ␦ Bending mode amplitude at hub hc Bending mode amplitude at midspan hc Bending mode amplitude at casing hc Reynolds number Outlet Mach number Mais2 Reduced frequency kc
Experiment 65 m / s 63.0° 3.15⫻ 10−3 4.03⫻ 10−3 4.91⫻ 10−3 5.9⫻ 105 1.43 0.0779
configurations developed to demonstrate flutter in turbomachinery 关14兴. This has a low aspect ratio, is well documented in terms of the experimental measurement, and exhibits both transonic and significant viscous flow characteristics. The standard configurations rely on Lane’s 关15兴 traveling wave model where a single vibrational mode shape is considered, with an interblade phase angle 共IBPA兲 assumed between adjacent blade passages. Since there are a finite number of possible IBPAs for a rotor of finite radius, only a limited number are required to be modeled. In the present numerical model, the annular or linear cascade is truncated at the lowest number of passages required for flow periodicity; periodic conditions are assumed at the circumferential boundaries of the cascade. The experimental configuration is characterized by the flow conditions summarized in Table 1. The flow at the inlet is subsonic and almost incompressible, whereas at the exit absolute Mach number it is well above unity. Surface pressure measurements were taken only at midspan. The experimental apparatus involved an annular cascade of blades that were translated in an oscillatory manner to model the vibration of turbine blades undergoing flutter. The aeroelasticity was modeled in the experiment by rotating the blade about a spanwise pivot, toward the hub of the apparatus. The amplitude of the vibration was kept constant, as was the frequency of oscillation. The phase difference was modified between neighboring blades to identify the most critical interblade phase angle. This was determined by the energy method, where the unsteady pressure is integrated over time. The model may be related to a simple springmass system. If energy in the system is damped, the system remains stable. Conversely if the energy adds to the total energy of the system over time, it is unstable. During the experiments, which involved a number of different configurations and flow conditions, Schlieren photography was performed and a strong passage shock was located on the blade suction side. The exact position of the shock wave was not noted for this particular set of conditions. The experiment was modeled numerically through both a threeand two-dimensional geometry. In the case of the twodimensional configuration, the midspan flow conditions were specified at the inlet and outlet of the domain. Periodic flow conditions were specified in the circumferential or blade-to-blade direction. Where the aeroelastic configurations were modeled, sufficient blade passages were required to maintain time periodicity as well as spatial periodicity. For example, for the interblade phase angle of 90 deg, four passages would be required, with periodic conditions applied at the outer blade passage boundaries. In the case of the three-dimensional geometry, the amplitude of the blade oscillation was varied linearly over the span to model the rotation of the blade about the pivot, as in the experiment. The tip gap was not modeled. There are two different geometric configurations considered. The first is a two-dimensional cascade model where the dimen1054 / Vol. 127, NOVEMBER 2005
sions of the two-dimensional slice are taken to be at midspan of the experiment. The second involves three-dimensional annular passages. The inlet and outlet plane lies one chord upstream and downstream of the blade’s leading and trailing edges, respectively. Although the overall distribution of the inlet total pressure profile was specified, the details of the boundary layer profile were not provided. Thus, a constant level of total pressure was specified to the wall. The boundary layer thickness developed over the end walls between inlet and the blade leading edge.
Modeling Method The numerical implementation of the fluid model involves a finite volume spatial discretization of the compressible Reynoldsaveraged Navier-Stokes equations. They are solved simultaneously with the k- turbulence equations for model closure. The fluid model governing equations are solved in a time accurate manner using a dual-time approach 关7,16兴. The artificial diffusion scheme of Jameson et al. 关17兴 is applied for smoothing oscillations due to the discretization of the convective terms and nonlinearities in the flow field, such as shock waves and stagnation points. The solver has been implemented to operate on parallel computer facilities using MPI. A moving mesh implementation adapts the fluid mesh to the oscillation of the turbine blades 关18兴. The numerical implementation has been validated by applying the code to a number of simplified flutter configurations. This process of validation has been reported previously 关13,19兴.
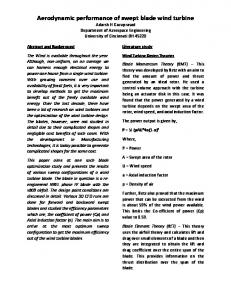
Results and Discussion Because of the complicated nature of the flow for this particular configuration, it was necessary to perform a detailed study under steady flow conditions to ensure that the results were not unduly affected by the grid geometry. This investigation also gave indication about some of the physical behavior that could be expected of the aeroelastic configuration. Steady Flow. A grid resolution study was first performed on the steady configuration, with no oscillation of the blade profile. Although an H-grid was adequate for modeling the subsonic turbine configurations, it had some major deficiencies when applied to the modeling of transonic cascade flow. A comparison between the passage Mach number distribution and cell distribution for two-dimensional steady simulations with an outlet Mach number of 1.4 was investigated for two different types of mesh geometries 关13兴. Each mesh had a comparable cell count, with the O–H grid having 152 cells and the H-grid having 160 cells on the blade surface, respectively. The most notable difference was the resolution of the trailing edge shock. The wake region in the case of the H-grid was also less distinct. This was the most compelling reason for the use of the O–H mesh for the modeling of this flow regime. The low resolution of shock waves on the blade suction side could lead to significant inaccuracies in the reproduction of the unsteady flow field. An O–H mesh was further refined in the throat region, which led to better resolution of the passage shock. A simulation involving the new mesh of four times the number of cells exhibited shock-induced boundary-layer separation at about 70% of chord on the blade suction side. A mesh of twice the cell density was produced involving 85,000 cells per spanwise plane and 736 cells on the blade surface, displayed little further change in results. The inlet average flow angle condition measured in the experiment was given in the cross section normal to the cascade axis 10% axial chord upstream of the blade leading edge, where there exists considerable circumferential and radial nonuniformity due to the proximity to the blades. In the case of the computations, the inlet plane is one chord length ahead of the blade leading edge and a uniform inlet angle of −26 deg is used instead of the −12 deg measured at the 10% chord location ahead of the blade leading edge in the experiment. The surface pressure coefficient for these Transactions of the ASME
Fig. 1 Surface pressure coefficient for coarse and fine meshes
two meshes is shown in Fig. 1. There is some difference in the separation region, however the distribution through the passage shock at 70% chord is similar between the two simulations. Schlieren distributions of the simulated flow field may be represented by contours of density gradient. They are useful for identifying shock features, wake regions, and boundary layers in compressible flow. The density gradient was calculated for the simulations. Comparisons of this quantity for the coarse and fine meshes showed that they were similar for the two-dimensional simulations, with little difference between the flow features. A comparison of the surface pressure coefficient at midspan for the three-dimensional, two-dimensional Navier-Stokes, and Euler simulations is made in Fig. 2. Both Navier-Stokes simulations predict the impingement of the passage shock on the blade suction-side at about 65% chord, with the position predicted by the two-dimensional simulation slightly forward of that predicted by the three-dimensional simulation. The two-dimensional Euler simulation predicts the shock impingement further forward again, at 60% chord. In the experimental results shown in the same figure, it appears that the passage shock impinges on the blade at 50% of chord, given that the passage shock is identified by a local minimum in the surface pressure coefficient. It is not obvious whether the experimental results involve a separation zone at the trailing edge. Experiments in a linear cascade with the same profile at the higher outlet Mach number of 1.68 show what appears to be a separated zone after the passage shock on the suction side
Fig. 2 Surface pressure coefficient for Euler, and two- and three-dimensional configurations
Journal of Fluids Engineering
Fig. 3 Schlieren distributions for steady Navier-Stokes simulations
in a plot of surface isentropic Mach number 关14兴. The Schlieren distribution in Fig. 3 were calculated for the twoand three-dimensional Navier-Stokes simulations to identify differences between the two results. The Schlieren distribution for the three-dimensional case is at midspan. The flow is quite complex and involves a number of different phenomena. In the two-dimensional case the point of flow separation coincides with the passage compression shock at about 70% chord. An oblique shock wave emanates from the separation point at −30 deg from the machine axis. Another oblique shock wave extends from the blade trailing edge toward the outlet at an angle of −20 deg from the machine axis. The wake is characterized by a fork like region, extending in the flow direction from the trailing edge. The three-dimensional simulations differ in the point of separation and the geometry of the shock waves. The passage shock is also visible but does not coincide with the separation point on the blade suction side; the flow separates further down stream at about 85% chord. A shock wave also occurs at the point of separation at a similar angle to that in the two-dimensional case, but it merges shortly downstream with the shock from the trailing-edge. A three-dimensional contour plot of the steady pressure coefficient on the blade suction side for the simulation is shown in Fig. 4. In the trailing-edge region of the blade in the figure, the white region represents the separation bubble; this is where the flow has negative axial velocity at the first mesh point adjacent to the blade surface. The pressure distribution varies significantly in the spanwise direction from midchord toward the trailing edge, as does the size of the separation bubble. On inspection, the flow in circumferential plane at the 75% span region more closely resembles the two-dimensional simulation compared with the midspan threedimensional distribution. The spanwise variation in pressure coefficient is also compared NOVEMBER 2005, Vol. 127 / 1055
Fig. 4 Steady pressure coefficient and separated zone on blade suction side for three-dimensional simulation
with experimentally measured values in Fig. 5. Once again, the impingement of the passage shock on the blade suction side is identified by a local minimum in the pressure coefficient, in the neighborhood of midchord. The point of impingement of the passage shock in the simulation is 70% chord at 25% span, 65% chord at midspan, and 55% chord at 75%. It is more difficult to identify the position of the shock in the experimental measurements due to lack of resolution. At 25% span the shock may be at about 65% chord, midspan at 50% chord, and at 75% span at 45% chord. The simulation predicts a shock position that is 10% further aft on average than the experiment. Therefore, the in-passage flow conditions in the simulations are at higher Mach number than in the experiment. There are some differences between the steady simulations, between the two- and three-dimensional simulations, and also with experiment. The next section investigates the way in which these differences affect the results for the simulations of the aeroelastic configuration. The surface pressure distributions do not compare well between the two- and three-dimensional configurations. The way in which this affects the aeroelastic stability of the configuration is investigated in the following section.
Fig. 6 First harmonic magnitude of unsteady pressure for blade suction side at midspan
Unsteady Surface Pressure and Aerodynamic Damping. The aeroelastic configuration involved the oscillation of the blade profile in a translational mode, as described in model section. The flow conditions were similar to those applied in the steady simulations described above. Because of the higher mesh density of the mesh required to resolve the passage shock, only an interblade phase angle of 180 deg was investigated, given the limits of the available computer resources. The mesh for this particular case involves a grid
density of ⬃5 million cells, run under unsteady flow conditions. This is a large simulation for state-of-the-art workstations and medium-sized parallel, computer clusters. The unsteady pressure on the blade due to the oscillation of the blade is analyzed by performing a fast-Fourier-transform of the fluctuating static pressure on the blade surface. The first harmonic of this quantity is typically the largest and is at the same frequency as the blade oscillation, with a phase shift that depends on the local flow conditions. The phase shift is critical in determining the stability of the configuration. The experimental measurements were analyzed in a similar way. A configuration where the integrated unsteady pressure over the blade surface leads the oscillation of the blade in terms of phase is unstable and will lead to failure of the blade where there is insufficient mechanical damping. A comparison is made between Euler and Navier-Stokes simulations for the two- and three-dimensional geometries at midspan in Figs. 6–8. The blade surface distributions of the first harmonic of unsteady pressure are shown. The magnitude of the second harmonic of unsteady pressure was found to be insignificant. For the peak unsteady pressure on the blade suction side at 20% chord, there is some deviation between the two- and threedimensional geometries. In the forward half of the blade, the predictions of unsteady pressure phase compare well with experiment for both models and both surfaces. Beyond midchord on the blade
Fig. 5 Distribution of steady pressure 3-dimensional simulation versus experiment
Fig. 7 First harmonic magnitude of unsteady pressure on blade pressure side at midspan
1056 / Vol. 127, NOVEMBER 2005
coefficient
for
Transactions of the ASME
Fig. 10 Phase of first harmonic of unsteady pressure for three-dimensional configuration
Fig. 8 Phase of first harmonic of unsteady pressure at midspan
suction side, however, there are more significant differences. The passage shock is evident in the experiment and the simulation results by a local maximum on the blade suction side between 60% and 70% chord. The two-dimensional Euler simulation predicts the shock impingement position closest to the experiment as it did in the steady simulations. For the two-dimensional Navier-Stokes simulations it is difficult to distinguish between the shock impingement and the separation point at 70% chord. The three-dimensional Navier-Stokes simulation predicts the impingement at ⬃65% chord as in the steady simulation. The flow separation is the cause of the second maximum at about 85% chord. There are significant differences in phase for the flow models on the blade suction side toward the trailing edge; however, the three-dimensional result gives the best prediction of phase in this region. In the experiment, the phase on the blade suction side returns to similar values to the forward section after the neighborhood of the passage shock, whereas both two-dimensional fluid models predict a phase almost a half cycle from the experimentally measured value. The distribution on the blade of the unsteady pressure and phase for the three-dimensional Navier-Stokes simulation is shown in Figs. 9 and 10. The separation line is visible in both plots toward the blade trailing edge. The impingement of the passage shock is also visible in the plot of phase, as a local maximum at 70% chord. Because of the complicated nature of the spanwise variation in unsteady pressure, a two-dimensional simulation cannot reproduce this type of behavior. The shock induced boundary layer separation or any other flow separation on the blade suction side cannot be well predicted by inviscid simulations. Navier-Stokes simulations, however, tend to be conservative in the prediction of flow separation. Usually they predict flow separation at more extreme conditions than is required in reality. A grid-independent prediction of the flow sepa-
Fig. 9 Magnitude of first harmonic of unsteady pressure for three-dimensional configuration
Journal of Fluids Engineering
ration on the blade suction side proved to be a significant challenge. As the spatial grid and time resolution are refined, unsteady vortex shedding may appear at time scales much smaller than that of the blade oscillation frequency. The suitability of the turbulence model under such conditions is questionable. Other authors have investigated the performance of turbulence simulations with separated flow with mixed results 关20兴. Deviations of the results from the experimental results may also be due to other important factors, such as the effect of tip leakage at the outer casing and the lack of resolution of the flow conditions at the simulation inlet and outlet planes, taken from the experimental measurements. Despite the aforementioned issues, the present computational results indicate the importance of the use of a three-dimensional model and a Navier-Stokes code for the accurate prediction of the unsteady pressures, especially the phase of the unsteady pressure after flow separation, which is critical for the correct prediction of flutter stability of the blades. A comparison is made between the different configurations for damping coefficient in Fig. 11. Even though the three-dimensional Navier-Stokes simulation predicts a significant difference in the peak unsteady pressure magnitude at 20% chord, the damping coefficient it predicts is closest to experiment since the damping coefficient is mostly determined by phase angle.
Conclusion A parallel multiblock Navier-Stokes solver with the k- turbulence model is used to study the unsteady flow through an annular turbine cascade. Two different configurations are used in the computations, one two-dimensional, the other three-dimensional. In addition, computations are also performed with both the Euler and the Navier-Stokes flow models. The computational results of the two- and three-dimensional configurations and with either the
Fig. 11 Damping coefficient for different simulations versus experiment
NOVEMBER 2005, Vol. 127 / 1057
Euler or the Navier-Stokes models are compared to available experimental data to document the effects of viscosity and threedimensionality on the prediction of unsteady pressure and aerodynamic damping for the vibration of the blades. The comparisons reveal that, where flow separation occurs, only the Navier-Stokes computation gives the correct phase-angle distribution of the unsteady pressure, which is critical for the prediction of flutter through the computation of aerodynamic damping. Furthermore, there are significant three-dimensional effects in both amplitude and phase of the surface unsteady pressures on the blade. Not surprisingly, the three-dimensional Navier-Stokes computation yields the best prediction of the aerodynamic damping compared to experimental data. This result questions the reliance of the design engineer on the general applicability of two-dimensional, inviscid, or both two-dimensional and inviscid computations for flutter predictions, despite their advantage in computational efficiency.
Acknowledgments The authors wish to thank the Australian Partnership for Advanced Computing 共APAC兲 and the Victorian Partnership for Advanced Computing for provision of the computer equipment and partial support of the project.
Nomenclature b = c / 2 ⫽ semi-chord c ⫽ chord of turbine blade Cp = 共p − pref兲 / 共p0 − pref兲 ⫽ time average surface pressure coefficient Cp共n兲 = p共n兲 / 共hc共p0 − pref兲兲 ⫽ nth harmonic of the unsteady pressure coefficient hc ⫽ bending amplitude, nondimensional with chord kc = c / 2Uref ⫽ reduced frequency, based on semi-chord Ma ⫽ Mach number Mais2 ⫽ isentropic Mach number at outlet p ⫽ static pressure pref ⫽ reference static pressure at a position designated by experiment p共n兲 ⫽ nth harmonic of unsteady pressure p0 ⫽ total pressure Re= Urefc / ⫽ Reynolds number u* = 冑wall / 冑wall ⫽ friction velocity Uref ⫽ velocity at reference position y + = yu* / ⫽ dimensionless distance, scaled with sublayer ␦ ⫽ direction of bending amplitude from machine axis 共n兲 ⫽ phase of nth harmonic of unsteady pressure coefficient ⫽ coefficient of dynamic molecular viscosity
1058 / Vol. 127, NOVEMBER 2005
⫽ coefficient of kinematic molecular viscosity ⫽ density wall ⫽ shear stress at wall ⫽ angular frequency ␣ ⫽ natural frequency of pitching axis ⌶ ⫽ blade aerodynamic damping coefficient
References 关1兴 Marshall, J. G., and Imregun, M., 1996, “A Review of Aeroelasticity Methods With Emphasis on Turbomachinery Applications,” J. Fluids Struct., 10, pp. 237–267. 关2兴 Vahdati, M., and Imregun, M., 1996, “A Nonlinear Aeroelasticity Analysis of a Fan Blade Using Unstructured Dynamic Meshes,” Proc. Inst. Mech. Eng., Part C: J. Mech. Eng. Sci., 210共6兲, pp. 549–564. 关3兴 Sayma, A. I., Vahdati, M., and Imregun, M., 2000, “An Integrated Nonlinear Approach for Turbomachinery Forced Response Prediction, Part I: Formulation,” J. Fluids Struct., 14共1兲, pp. 87–101. 关4兴 Vahdati, M., Sayma, A. I., and Imregun, M., 2000, “An Integrated Nonlinear Approach for Turbomachinery Forced Response Prediction, Part II: Case Studies,” J. Fluids Struct., 14共1兲, pp. 103–125. 关5兴 Carstens, V., Kemme, R., and Schmitt, S., 2003, “Coupled Simulation of FlowStructure Interaction in Turbomachinery,” Aerosol Sci. Technol., 7共4兲, pp. 298–306. 关6兴 Doi, H., and Alonso, J., 2002, “Fluid/Structure Coupled Aeroelastic Computations for Transonic Flows in Turbomachinery,” In: Proc. of ASME Turbo Expo 2002, ASME, New York, ASME Paper No. GT-2002-30313. 关7兴 Liu, F., Cai, J., Zhu, Y., Wong, A. S. F., and Tsai, H. M., 2001, “Calculation of Wing Flutter by a Coupled Fluid-Structure Method,” J. Aircr., 38共2兲, pp. 334– 342. 关8兴 Sadeghi, M., and Liu, F., 2005, “Coupled Fluid-Structure Simulation for Turbomachinery Blade Rows,” 43rd AIAA Aerospace Sciences Meeting and Exhibit, Reno, AIAA Paper No. 2005-0018. 关9兴 Imregun, M., 1998, “Recent Developments in Turbomachinery Aeroelasticity,” Computational Fluid Dynamics ’98, pp. 524–533. 关10兴 Verdon, J., 1993, “Review of Unsteady Aerodynamic Methods for Turbomachinery Aeroelastic and Aeroacoustic Applications,” AIAA J., 31共2兲, pp. 235– 250. 关11兴 Srinivasan, A. V., 1997, “Flutter and Resonant Vibration Characteristics of Engine Blades,” ASME J. Eng. Gas Turbines Power, 119, pp. 741–775. 关12兴 Bell, D. L., and He, L., 2000, “Three-Dimensional Unsteady Flow for an Oscillating Turbine Blade and the Influence of Tip Leakage,” ASME J. Turbomach., 122, pp. 93–101. 关13兴 McBean, I., 2002, “Simulation of 3-Dimensional Aeroelastic Effects in Turbomachinery Cascades,” Ph.D. thesis, Monash University. 关14兴 Bölcs, A., and Fransson, T. H., 1986, “Aeroelasticity in Turbomachines: Comparison of Theoretical and Experimental Cascade Results,” EPFL Lausanne. 关15兴 Lane, F., 1956, “System Mode Shapes in the Flutter of Compressor Blade Rows,” J. Aeronaut. Sci., 23, pp. 54–66. 关16兴 Liu, F., and Ji, S., 1996, “Unsteady Flow Calculations with a Multigrid NavierStokes Method,” AIAA J., 34共10兲, pp. 2047–2053. 关17兴 Jameson, A., Schmidt, W., and Turkel, E., 1981, “Numerical Solutions of the Euler Equations by Finite Volume Methods Using Runge-Kutta Time-Stepping Schemes,” Proc. AIAA 14th Fluid and Plasma Dynamics Conf., AIAA, Washington, DC, AIAA Paper 81-1259. 关18兴 Tsai, H. M., Wong, A. S. F., Cai, J., Zhu, Y., and Liu, F., 2001, “Unsteady Flow Calculations With a Parallel Multi-Block Moving Mesh Algorithm,” AIAA J., 39共6兲, pp. 1021–1029. 关19兴 McBean, I., Liu, F., Hourigan, K., and Thompson, M., 2002, “Simulations of Aeroelasticity in an Annular Cascade Using a Parallel 3-Dimensional NavierStokes Solver,” Proc. of ASME Turbo Expo 2002, ASME, New York, ASME Paper No. GT-2002-30366. 关20兴 Fransson, T. H., Jöcker, M., Bölcs, A., and Ott, P., 1998, “Viscous and Inviscid Linear/Nonlinear Calculations Versus Quasi-3D Experimental Data for a New Aeroelastic Turbine Standard Configuration,” ASME Turbo Expo 1998, ASME, 98-GT-490.
Transactions of the ASME