capillary tubes, and refrigerant valves show excellent agreement over a wide range of operating conditions. ..... 0.5 in D.D. copper tubing. Orifice tube (1.7 mm ...
Prediction of Noise Generated by Expansion Devices Throttling Refrigerant G. M. Singh, E. Rodarte, N. R. Miller, and P. S. Hrnjak
ACRC TR-163
April 2000
For additional information:
Air Conditioning and Refrigeration Center University of Illinois Mechanical & Industrial Engineering Dept. 1206 West Green Street Urbana,IL 61801 (217) 333-3115
Prepared as part ofACRC Project 72 Modes of Propagation of an Acoustic Signal from Expansion Devices and Investigation of Possible Attenuation P. S. Hmjak and N. R. Miller, Principal Investigators
The Air Conditioning and Refrigeration Center was founded in 1988 with a grant from the estate of Richard W. Kritzer, the founder of Peerless of America Inc. A State of Illinois Technology Challenge Grant helped build the laboratory facilities. The ACRC receives continuing support from the Richard W. Kritzer Endowment and the National Science Foundation. The following organizations have also become sponsors of the Center.
Amana Refrigeration, Inc. Ar~elik A. S. Brazeway, Inc. Carrier Corporation Copeland Corporation DaimlerChrysler Corporation Delphi Harrison Thermal Systems Frigidaire Company General Electric Company General Motors Corporation Hill PHOENIX Honeywell, Inc. Hussmann Corporation Hydro Aluminum Adrian, Inc. Indiana Tube Corporation Invensys Climate Controls Lennox International, Inc. Modine Manufacturing Co. Parker Hannifin Corporation Peerless of America, Inc. The Trane Company Thermo King Corporation Visteon Automotive Systems Whirlpool Corporation Wolverine Tube, Inc. York International, Inc. For additional infonnation: Air Conditioning & Refrigeration Center Mechanical & Industrial Engineering Dept. University of Illinois 1206 West Green Street Urbana IL 61801
2173333115
Prediction of Noise Generated by Expansion Devices Throttling Refrigerant George Singh, Enrique Rodarte, Norman R. Miller, and Predrag S. Hrnjak ABSTRACT
A method is presented for predicting the noise generated by expansion devices throttling refrigerant, based on an existing standard model for predicting the noise downstream of large, industrial control valves throttling air. The presented method can be used to predict the noise downstream of any expansion device of any size for any pure two-phase or pure vapor refrigerant flow. Comparison of the model predictions to experimental data for orifice tubes, capillary tubes, and refrigerant valves show excellent agreement over a wide range of operating conditions. Experimental results for the attenuation of sound waves in a two-phase refrigerant flow are also presented, as well as direct comparisons of the noise generated by different expansion devices over similar operating conditions. INTRODUCTION
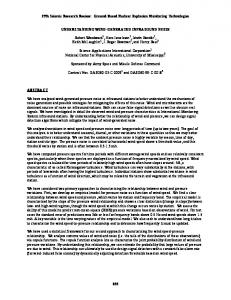
Aerodynamic noise (or "flow noise") on the low pressure side of refrigeration and airconditioning systems can be a significant problem in some units. The primary source of this noise is often the expansion device. The jet of refrigerant exiting the expansion device can generate significant aerodynamic noise, which can then propagate and interact with downstream components, such as piping and heat exchangers, inducing vibrations or even resonance, as illustrated in Figure 1. To date, much work has been done on noise from control valves in air and water systems [1,2], but little appears to have been done on noise from expansion devices (valves, orifice tubes, and
AIR
Excited downstream component airborne travelling
~SOUndwa. . EAR internal travelling
sound wave
r---
vibrating tube wall
--
internal disturbance .. _._._._._._._ .. -. ,
Orifice tube or other expansion device
II
\
travelling mechanical vibrations
Figure 1. Overview of expansion noise
1
capillary tubes) in refrigeration systems. In 1995, the lEe released a standard method [3] for predicting the aerodynamic noise generated by control valves. The model showed that valve noise is primarily a function of pressure ratio across the valve, as different physical mechanisms of noise generation occurred (see Figure 2). However, the standard model is limited to ideal gases and isentropic valves (valves with no frictional losses or heat transfer between the inlet and the choking point). The standard model then, as written, can not be used for capillary tubes, nor can it be used during two-phase flow. This paper presents a method for predicting the noise from all types of refrigerant expansion devices during pure refrigerant single-phase vapor or twophase flow. This method is based on the standard model, but includes modifications for friction and two-phase flow. A full justification ofthese modifications is presented in [4]. Data is pr~sented describing some of the basics of expansion noise in refrigerant, including comparisons of the presented model predictions to experimental data, comparisons of the noise generated by different expansion devices with similar operating conditions, and experimental results for twophase attenuation in tubes.
PREDICTION OF EXPANSION NOISE FOR CHOKED FLOW At the choking point in any expansion device, the mechanical stream power is: mc 2 W =m
]
e ! a.
(1)
2
I
I
I
Regime I Regime II: Regime 11/ 1 Regime IV
Regime V
:::J
fI)
"g
c :::J o
en "i ...c
~
~~----~--------~------------------~----------~
Choking pressure ratio
Pressure Ratio P1n1e/Pexit
Figure 2. The five regimes of downstream expansion noise Regime I: (Unchoked flow) Isentropic recompression. Dipole rwise due to turbulent mixing. Regime II: (Choked flow) Isentropic recompression. Interaction between shock cells and turbulent chokedflow mixing.
Regime ill: (Choked flow) No isentropic recompression. Turbulentflow-shear noise mechanisms. Regime IV: (Choked flow) Mach disc fonns. Noise mechanism is shock cell-turbulentflow interaction. Regime V: (Choked flow) Constant acoustical efficiency. Decrease in Pexit will no longer increase rwise
Oualitative reproduction from f31
2
The speed of sound can be calculated numerically from its definition for both single-phase and homogeneous two-phase flows:
c={:1 ={:1
(2)
P = xPsv + (1- x)P SI c = ..jyRT
(2a)
(Two - phase flow)
(Ideal gas flow)
(2b)
For vapor flow through thermostatic expansion valves or orifice tubes, P and T at the choking point can be calculated from standard ideal gas isentropic flow relations [3,5]:
P = PI
( 1;Iv-I _2_ y+I
(2c)
v-X T
= T ,[ : , )
(2d)
,
For vapor flow through capillary tubes, a Fanno-flow analysis may be used, as described in [5]. For two-phase flows though valves or orifice tubes, the choking-point pressure and quality can be calculated by assuming isentropic and isenthalpic flow. Finally, for two-phase flows through capillary tubes, pressure, quality, and velocity can be calculated by correlation, as described in [6]. Some fraction of the energy at this point will be converted into sound. In terms of the mechanical stream power (Eqn. 1):
Ws =TJWm where TJ, the acoustical efficiency factor, is given in Table 1.
(3)
Table 1. Table of Acoustical Efticienc Factors (assembled from [3]) Regime PI
Pressure Limit*
Acoustical Efficiency Factor*
Mj=v/c
>P2~PIT
.PII > P2 ~ PllI
Pm =P.
(
Yr+l
)
YIY-.
1'\ =
0.000lM~'6Fl(P.p._p - P2) J
Same as regime IT
PllI > P2 ~ PIV PIV>P2~PV
PV>P2
Jet Mach Number, Mj
p.
=(p')/(22a)
1'\ = 0.0001 M: .fi6.6Fl.
Same as regime IT
2 M2 2 1'\ = O.OOOI-i .fi6.6Fi. 2
*Although these pressure limits and the forms of" were principally determined for valves in air, they have been shown experimentally to be valid for single or two-phase refrigerant flows [4]. 3
The total internal sound pressure level (in dB) downstream of the valve exit is then given by:
(4) Here x is a factor to account for jet exit angle. For an orifice or capillary tube, where the jet exits along the tube axis, 100% of the exit noise is transmitted downstream and x=1. The standard factor for an arbitrary valve whose jet exits at an angle is 0.25. Model for Unchoked flow For unchoked flow, replace "c" in Eqn (1) with "v". For valves or orifice tubes with ideal gases, v may be calculated from the standard isentropic equation:
v=
i ~II-(~)(Y-l)/Y] PI 1. y-I PI pI
(5)
For two-phase flows and/or capillary tubes, v must be determined by correlation, as in [6].
CHARACTER OF EXPANSION NOISE Expansion noise is generally white noise over the audible frequency range (0-20kHz) for both single-phase and two-phase flows. For choked flow, a soft "haystack"-like peak may appear in the spectrum at a frequency equal to the convection velocity divided by the shock spacing [7]. The equations for estimating the peak frequency are given in Table 2.
Table 2. Peak Frequency Regime
PEAK FREQUENCY
I
= O.2*Vvc
f
D.
P
J
II
O.2*M.*c f = J P Dj
ill-V
f
= P
O.35*c 1.25D j ~ M j -l
PREDICTION OF EXTERNAL PIPE-WALL ACCELERATION If the internal sound pressure spectrum downstream of a valve is known, the external pipe-wall acceleration at a point can be calculated as well. Based on coincidence between the acoustic modes of the internal sound waves and structural modes of the tubing, only certain frequencies of
4
the internal spectrum are transmitted though the tube. A full description of this method for refrigeration systems is given in [8]. EXPE~ENTALPROCEDURE
In each experiment, the internal sound pressure and external pipe-wall acceleration was measured 1m. downstream of the exit of various expansion devices over a wide range of operating conditions. The internal noise measurements were made with tiny microphones (PCB piezoelectric 105B02, 2.54 mm measuring diaphragm) mounted flush to the inside wall of the downstream tubing, as shown in Figure 3. Pure R-134a was used in all experiments. M~asurements were made over the audible frequency range (20-20kHz) using resolution of 25Hz and a Hanning window. All measurements were corrected for reflections (sound waves reflected off of downstream components) and confirmed by experiment to be free from internal flow disturbances, flow oscillations, or vibrations generated by other system components. The total internal sound pressure was then calculated for each measurement as follows: !'(Sound_ pressure)2j TSPL(dB)=10LogIO[ ..=!2S:!!!oHz_ _ _ _...".. (reference_ pressure)2
(6)
Please note that for two-phase flow, the sound pressure spectrum used in Eqn.(6) must be corrected for attenuation, as described below. The experimental test facility used is described in full detail in [9] and [10]. Microphone (mounted flush to inner wall of tube)
1m Flow
D
---I~.
•
Negligible
• 11 reflections
~----------~------------------------~------~~---Non-intrusive
Valve outlet
temperature measurement
Surface accelerometer
Pressure measurement made downstream _ _.~
Figure 3. Basic experimental set-up EXPE~ENTAL
RESULTS
Figure 4 shows the results of both single-phase vapor and two-phase attenuation as measured in our system. Note that the single-phase attenuation is negligible over reasonable distances, but that two-phase attenuation appears much more significant. Further, the two-phase attenuation appeared to be a minor function of the quality of the flow but independent of the specific flow conditions (mass flow and pressure). As noted, the measured spectra were correctedfor twophase attenuation before using Eqn (6) to compute the total sound pressure level. The corrected results are shown in Figure 5. Although the problem of sound wave attenuation for gas flows in
5
tubes has been well studied and is fairly well understood [11], there appears to be few published results for the attenuation of sound in two-phase flow in tubes. --.-.... .......
j,. -+----. «l
25
-+- ...... C-,.. ...........,
f--+--+-+-+-I
20
III
5m~~~~~~~~~~
.S
""
15
B 'iI
10
6
5
~
0 0
5000
10000
15000
20000
Frequency (Hz)
(A)
(B)
Figure 4. Attenuation of sound waves in pure Refrigerant-134a (A) vapor over 7.24 m and (B) two-phase flow (85% quality) over 0.635 m. Figure (A) from [11] 0.5 in D.D. copper tubing. Orifice tube (1.7 mm I.D., 38.4 mm length) used as noise source.
Figure 6 shows results for two block-type thermostatic expansion valves of different sizes and FL factors. The valves throttled pure R-134a vapor. Note the excellent agreement between predicted noise (using the method of this paper) and experimental results over a wide range of pressure ratios. Also note the increase in noise with pressure difference and the white-noise character of the measured spectra. ~1~y-----------------------~ G. ~140~--------~~-----n~~
~ 130~.~1
!120~~~~~~~~~~~~
.!.
~ 150
... 140 130
!
120
...I
'110~--~~----~~~~~~
iii
110
~-------------=---=-----=CI!!'j
-=
100 90
'4 100
j
90 f - - - - - - r - - - - - - - r - - - - - - r - - - - - - l o ~ 10000 1~ 20000
!
=
0
Frequency (Hz)
~
10000
1~
Frequency (Hz)
(B)
(A)
Figure 5. Internal sound pressure spectra (A) As measured 1 m downstream of expansion device (B) Corrected for two-phase attenuation as measured in Figure 4b* *Simple linear correction over frequency and distance and adjusted for the effect of flow quality (0.55 ~'-::7""-~""--------I
5 \60t------'~-----;;7~_~~--i
I:I "'t-----~~~--j "ot---~~"'--.......'------'~---I
"'+""----".""""'---::>-.£-_ _ _ _ _ _--1
.. o""""-_""--~-~-~-_---I I!SO
."
110
1-40
Pre.leted SPL
.'0
IS.!!
16'
110
Predicted SPL
Figure 7. Predicted noise vs. experimental results for orifice and capillary tubes throttling pure R134a vapor (A) Noise prediction method used as presented (B) Uncorrected for frictional pressure drop in Table 1 Outlying points in (B) are capillary tube data. Lines are ± 5db (± 3.5%). Figure 7 shows results for orifice and capillary tubes in vapor flow. There is again good agreement between the predicted and measured noise, as seen in Figure 7 A. The importance of accounting for frictional pressure drop in capillary tubes is illustrated in Figure 7B. Since orifice tubes are short, they were assumed isentropic from the inlet to the exit plane. However, capillary tubes generate significant frictional pressure drop from the inlet to the choking point (exit plane - see Figure 8). When the measured inlet pressure is used in computing 11, the capillary tubes show significant overprediction by the model, indicating the model does not account for energy or acoustic efficiency lost via friction along the tube length. This can be seen over a wider range
7
of operating condition in Figure 9, where the capillary and orifice tubes were sized to yield nearly identical outlet conditions (pressure, quality/superheat) for any given set of inlet conditions (pressure, quality/superheat, mass flow) over the range of pressure differences shown. Figure 10 shows results for an orifice tube with two-phase flow ofR-134a. Again, note the good agreement between predicted noise and experimental results, as seen in Figure lOa. Figure lOb highlights the importance of correcting for two-phase speed of sound, density, and attenuation.
liquid
Inlet Pressure (PI)
----'2fIII'~--r--r-------'~-
Two-phase Capillary tube Exit plane ---_._-+--1:....----
vapor
h Figure 8. Qualitative view of expansion in choked orifice and capillary tubes Solid lines: Inlet contraction Dotted lines: Frictional pressure drop Dashed lines: Sudden expansion Although shown for two-phase flow, process is qualitatively similar for vapor flow
8
'is
D.
:g
165 o
160
o
155 ! m 150 N
X 0
:2..J
D.
en
!
u
0
•
145
Xo
140
u
'" '
• •
00
0
~
X •
v
.~
000
.~
~ X""
•"
135 50
100
150 ~
200 P (psi)
250
350
300
Figure 9. Noise from orifice and capillary tubes with matching inlet and outlet conditions Open circles: Orifice tube, 1.22 mm ID., 38.4 mm length Closed circles: Cap tube, 1.626 mm ID., 813 mm length Crosses: Cap tube, 1.905 mm ID., 1.73 m length Mass flow rate: 75 lbmlhr (9.45 g/s), Outlet pressure: 4 bar 175
175
11' HI6
1165 'I'
..•
* !
155
g
145 1 ...
.'
i iii • -
~
145
~
135
...
a
III •
135
155
I!
!
.
o 0 0
a
••
-
0
00
...
••
• •
125
125 0
5
10
15
20
5
0
10
15
20
AP(bu)
APIb_.,
(B)
(A)
Figure 10 - Predicted noise vs. experimental results for orifice tube in two-phase flow (A) Noise prediction method used as presented (B) Uncorrected for two-phase density, speed of sound, or attenuation Orifice tube: 1.45 mm ID., 38.4 mm length Mass flow rate: 75 lbmlhr (9.45 g/s), Outlet pressure: 4 bar
SUMMARY AND CONCLUSIONS A method is presented which can be used to predict the noise from any single-orifice valve, orifice tube, or capillary tube in refrigerant. The model is based on the valve noise model of IEC 534-8-3:1995, but modified to account for both frictional pressure drop along the length of the device and two-phase flows. Comparison of predicted noise to experimental show very good agreement between the two for several expansion devices over a wide range of operating conditions.
9
Experimental results show expansion noise to be white noise over the audible frequency range and to increase with an increase in exit velocity, mass flow, or pressure ratio. Further, for expansion devices over the same operating conditions, increased frictional pressure drop or an angle to the exiting jet can significantly decrease the expansion noise. Finally, the attenuation of sound waves in two-phase flow has been measured in refrigerant and shown to be significant, especially as compared to the attenuation present in single-phase flows. It should be noted that again all experimental results reported here were done with an anechoic termination for high frequencies and corrected for reflections at low frequencies (see [9, 10]). In a typical system downstream components can cause significant reflections, vibrations, and even resonance (see Figure 1) and may add significantly to the measured noise. Further, as noted, all experiments were done using pure R-134a. As such, the effects of oil concentration in the system were not studied per se, but one might speculate that the noise results would be qualitatively the same, changed in the model by changing the values of attenuation, density, and speed of sound accordingly. This topic might well be worth further study. Finally, mesh screens attached to the exit of orifice tubes were found to significantly reduce the noise (by roughly 20 dB TSPL) over a wide range of operating conditions, as can be seen in [9] and [10].
ACKNOWLEDGMENT This work was supported by the National Science Foundation and the 24 member companies of the Air Conditioning and Refrigeration Center at the University of Illinois at Urbana-Champaign. The authors are also grateful for assistance provided by Prof. Clark Bullard and Prof. Jose Moreira.
10
APPENDIX Example: Orifice Tube in Vapor Flow Orifice tube: D=1.22 mm, L=38.4 mm, Pl=24.8 bar, P2=4.3 bar, Tl=84.1 °C, T2=41.4°C, m=75.1Ibmlhr, pure R134a vapor flow, measured TSPL = 162.3 dB. Look up the following properties: pl=129.4 kglm3, p2=18.2 kglm3, y=1.05, R=0.0823 kglkmol-K Assume negligible entrance effects*. Since orifice tube is short, neglect frictional pressure drop. Thus, assume isentropic flow from the inlet to the choking point (exit plane). Calculate the temperature and pressure at the choking point using isentropic ideal gas relations: P=15.0 bar T=83.2°C
(Eqn 2c) (Eqn 2d)
Cl;llculate the speed of sound at the choking point**: c=171.7 mls
(Eqn 2b)
Calculate the mechanical stream power of the flow through the choking point: (Eqn 1)
Wm=139.3 W
Calculate the pressure regime cut-offs (Table 1): PII=15.0bar PIII= 15.0bar PIV=9.1bar PV=l.lbar Calculate 11: Mj=1.87 11 = 0.0017221
(Table 1) (Table 1)
The sound power exiting the valve is: Ws=0.2398851 W
(Eqn 3)
And the total internal sound pressure level downstream of the valve is: c2 = 161.3 mls TSPL = 162.8 dB
(Eqn 2b**) (Eqn 4)
* As can be calculated using the methods in [12] ** For two-phase flow, use Eqns. 2 and 2a.
11
NOMENCLATURE Wm m c v p psv psI x g. P T PI Tl pi Ws TJ FL ex PII PIlI PIV PV pd cd Di d
Mechanical stream power Mass flow rate speed of sound Velocity density denity of saturated vapor density of saturated liquid quality (0-1) ideal gas specific heat ratio Pressure at the choking point in an expansion device Temperature at the choking point in an expansion device Pressure at the inlet of an expansion device Temperature at the inlet of an expansion device Density at the inlet of an expansion device Sound power Acoustical efficiency factor Pressure recovery factor Ratio of inlet pressure to outlet pressure at critical flow conditions =PIIIIPrr Pressure at which expansion noise regime II begins (See Figure 2) Pressure at which expansion noise regime III begins (See Figure 2) Pressure at which expansion noise regime IV begins (See Figure 2) Pressure at which expansion noise regime V begins (See Figure 2) Density downstream of expansion device Speed of sound downstream of expansion device Internal diameter of downstream tubing Distance (in m) from the exit of the expansion device to the point of the internal noise measurement.
12
REFERENCES 1. Baumann, H. D. 1970. On the Prediction of Aerodynamically Created Sound Pressure Level of Control Valves. ASME Paper WMIFE 2B. 2.· Reethof, G. 1978. Turbulence-Generated Noise in Pipe Flow. Ann. Rev. Fluid Mech.: 333367. 3. IEC Standard 534-8-3:1995: Industrial-process control valves - Part 8: Noise considerations - Sections 3: Control valve aerodynamic noise prediction method. 4. Singh, G., E. Rodarte, N. R. Miller, and P. S. Hrnjak. Modification of a Standard Aeroacoustic Valve Noise Model to Account for Friction and Two-phase Flow. Submitted for publication to the Journal of Sound and Vibration. 5. Hodge, B. K. and Keith Koenig 1995. Compressible Fluid Dynamics. New Jersey: Prentice Hall. 6. Woodall, R. J. and C. W. Bullard 1996. Development, Validation, and Application of a Refrigerator Simulation Model. ACRC TR-99, Air Conditioning and Refrigeration Center, University of Illinois at Urbana-Champaign. 7. Reethof, G. and G. C. Chow 1980. A Study of Valve Noise Generation Process for Compressible Fluids. ASME Paper BO-WAlNC-15. B. Rodarte, E., G. Singh, N. R. Miller, P. S. Hrnjak 1999. Refrigerant Expansion Noise Propagation Through Downstream Tube Walls. Paper and presentation at the 1999 SAE International Congress and Exposition. 9. Singh, G., E. Rodarte, N. R. Miller, P. S. Hrnjak 1999. Noise Generation from Expansion Devices in Refrigerant. Paper and presentation in the 1999 SAE International Congress and Exposition 10. Singh, G., 1999. Noise from Expansion Devices in Refrigerant. Master's Thesis, University of Illinois at Urbana-Champaign.
11. Rodarte, E., G. Singh, N. R. Miller and P. S. Hrnjak. Sound Attenuation in Tubes due to Visco-Thermal Effects, Journal of Sound and Vibration, pending publication. 12. Idel'chik, I. E. 1994. Handbook of Hydraulic Resistance. Boca Raton, FL: CRC Press
13