JOURNAL OF ADVANCES IN INFORMATION TECHNOLOGY, VOL. 2, NO. 1, FEBRUARY 2011
57
Prediction of Number of Zombies in a DDoS Attack using Polynomial Regression Model *
B. B. Gupta, R. C. Joshi, and Manoj Misra
Department of Electronics and Computer Engineering Indian Institute of Technology Roorkee, India Email: *
[email protected]
Abstract—This paper reports the evaluation results of proposed approach that is used to predict number of zombies using polynomial regression model. A relationship is established between number of zombies and observed deviation in sample entropy. Various statistical performance measures are used to measure the performance of the regression model. Network topologies similar to Internet used for simulation are generated using Transit-Stub model of GT-ITM topology generator. NS-2 network simulator on Linux platform is used as simulation test bed for launching DDoS attacks with varied number of zombies. The simulation results are promising as authors are able to predict number of zombies efficiently using polynomial regression model with very less error rate. Index Terms—DDoS attack, Intrusion detection, Polynomial regression, Zombies, Entropy
I. INTRODUCTION The Internet has become a popular medium of commercial activity and this has raised the risks, both, for attackers and security personnel. DDoS attacks compromise availability of the information system through various means [1,2]. One of the major challenges in defending against DDoS attacks is to accurately detect their occurrences in the first place. Anomaly based DDoS detection systems construct profile of the traffic normally seen in the network, and identify anomalies whenever traffic deviate from normal profile beyond a threshold [3]. This extend of deviation is normally not utilized. We use polynomial regression [4,5] based approach that utilize this extend of deviation from detection threshold, to predict number of zombies. A zombie is a computer connected to the Internet that has been compromised by a hacker, computer virus or trojan horse. Generally, a compromised machine is only one of many in a botnet, and will be used to perform malicious tasks of one sort or another under remote direction. Most owners of zombie computers are unaware that their system is being used in this way. Because the owner tends to be unaware, these computers are metaphorically compared to zombies. Zombies can be used to conduct distributed denial-ofservice attacks. A real time estimation of the number of zombies in DDoS scenario is helpful to suppress the effect of attack by choosing predicted number of most
© 2011 ACADEMY PUBLISHER doi:10.4304/jait.2.1.57-62
suspicious attack sources for either filtering or rate limiting. We have assumed that zombies have not spoof header information of out going packets. Moore et. al [6] have already made a similar kind of attempt, in which they have used backscatter analysis to estimate number of spoofed addresses involved in DDoS attack. This is an offline analysis based on unsolicited responses. Our objective is to find the relationship between number of zombies involved in a flooding DDoS attack and deviation in sample entropy. In order to predict number of zombies, polynomial regression model is used. To measure the performance of the proposed approach, we have calculated various statistical performance measures i.e. Coefficient of Determination (R2), Coefficient of Correlation (CC), Standard Error of Estimate (SSE), Mean Square Error (MSE), Root Mean Square Error (RMSE), Normalized Mean square Error (NMSE), Nash–Sutcliffe Efficiency Index (η) and Mean Absolute Error (MAE). Internet type topologies used for simulation are generated using Transit-Stub model of GTITM topology generator [7]. NS-2 network simulator [8] on Linux platform is used as simulation test bed for launching DDoS attacks with varied number of zombies. In our simulation experiments, attack traffic rate is fixed to 25Mbps in total; therefore, mean attack rate per zombie is varied from 0.25Mbps to 2.5Mbps and total zombie machines range between 10 and 100 to generate attack traffic. The remainder of the paper is organized as follows. Section 2 contains overview of polynomial regression model. Section 3 presents various statistical performance measures. Intended analytical model and detection scheme are described in section 4. Section 5 describes experimental setup and performance analysis in details. Model development is presented in section 6. Section 7 contains simulation results and discussion. Finally, Section 8 concludes the paper.
II. POLYNOMIAL REGRESSION MODEL In its simplest form regression analysis [9,10] involves finding the best straight line relationship to explain how the variation in an outcome variable, Y, depends on the variation in a predictor variable, X. Hence, regression analysis is a statistical tool for the investigation of
58
JOURNAL OF ADVANCES IN INFORMATION TECHNOLOGY, VOL. 2, NO. 1, FEBRUARY 2011
relationships between variables. Variables which are used to ‘explain, other variables are called explanatory variables. Variable which is explained is called response variable. A response variable is also called a dependent variable, and an explanatory variable is sometime called an independent variable, or a predictor, or repressor. When there is only one explanatory variable the regression model is called a simple regression, whereas if there are more than one explanatory variable the regression model is called multiple regression. Polynomial regression [4,5] is a form of regression in which the relationship between the independent variable X and the dependent variable Y is modeled as an ith order polynomial. The general form of this regression model is as follows:
Yi = Yˆi + ε i Yˆi = β0 + β1 X + β2 X 2 + ......... + βn X n
(1)
R2 =
(3)
CC =
i =1
o
© 2011 ACADEMY PUBLISHER
∑ (Y
− Yo ) 2
c
i =1
(6)
N
v). Root Mean Square Error (RMSE): The Root Mean Square Error (RMSE) between observed and computed outputs can be defined as:
RMSE =
∑ (Y
− Yo ) 2
c
i =1
(7)
N
vi). Normalized Mean Square Error (NMSE): The Normalized Mean Square Error (NMSE) between observed and computed outputs can be defined as: N
1 N
∑ (Y i =1
c
− Yo ) 2
2 σ obs
(8)
vii). Nash–Sutcliffe efficiency index (η): The Nash– Sutcliffe efficiency index (η) can be defined as: N
η = 1−
∑ (Y
− Yo ) 2
∑ (Y
− Yo )
c
i =1 N
o
i =1
(9) 2
viii). Mean absolute error (MAE): Mean absolute error (MAE) can be defined as follows: N
MAE = 1 −
∑ |Y i =1 N
c
∑ |Y i =1
o
− Yo | (10)
− Yo |
simulated values of dependent variable respectively,
Yo
2 are the mean and the standard deviation of the σ obs
observed dependent variable respectively.
IV. DETECTION OF ATATCKS
− Yo )(Yc − Yc )
N ⎡N ⎤ 2 ( ) (Yc − Yc ) 2 ⎥ Y Y − ⋅ ∑ ⎢∑ o o i =1 ⎣ i =1 ⎦
MSE =
and
ii). Coefficient of Correlation (CC): The Coefficient of Correlation (CC) can be defined as:
∑ (Y
N
where N represents the number of feature vectors prepared, Yo and Yc denote the observed and the
2
N ⎡N 2 2⎤ ⎢ ∑ (Yo − Yo ) ⋅ ∑ (Yc − Yc ) ⎥ i =1 ⎣ i =1 ⎦
N
iv). Mean Square Error (MSE): The Mean Square Error (MSE) between observed and computed outputs can be defined as:
NMSE =
The different statistical parameters are adjusted during calibration to get the best statistical agreement between observed and simulated variables. For this purpose, various performance measures, such as Coefficient of Determination (R2), Coefficient of Correlation (CC), Standard Error of Estimate (SSE), Mean Square Error (MSE), Root Mean Square Error (RMSE), Normalized Mean square Error (NMSE), Nash–Sutcliffe Efficiency Index (η) and Mean Absolute Error (MAE) are used to measure the performance of the proposed regression model. These measures are defined below. i). Coefficient of Determination (R2): Coefficient of determination (R2) is a descriptive measure of the strength of the regression relationship, a measure how well the regression line fit to the data. R2 is the proportion of variance in dependent variable which can be predicted from independent variable.
(5)
i =1
(2)
III. STATISTICAL PERFORMANCE MEASURES
⎞ )⎟ ⎠
N
SSE = ∑ (Yo − Yc ) 2
N
Input and Output: In polynomial regression model, a relationship is developed between number of zombies Y (output) and observed deviation in sample entropy X as input. Here X is equal to (Hc-Hn). Our proposed regression based approach utilizes this deviation in sample entropy X to predict number of zombies.
⎛ N ⎜ ∑ (Yo − Yo )(Yc − Yc ⎝ i =1
iii). Sum of Squared Errors (SSE): The Sum of Squared Errors (SSE) can be defined as:
1/ 2
(4)
A. Choice of traffic parameter The main factor that governs the effectiveness of a modeling technique is the parameter used in modeling. Many parameters have been proposed and studied. One of
JOURNAL OF ADVANCES IN INFORMATION TECHNOLOGY, VOL. 2, NO. 1, FEBRUARY 2011
the most obvious parameter of choice is volume (number of packets and byte count per unit time), as most of existing solutions use volume based metrics (number of packets and byte count per unit time) to detect DDoS attacks. These suffer in the form large number of false positives/negatives hence more collateral damage when attack is carried at slow rate or when volume per attack flow is not so high as compared to legitimate flows. Entropy based approaches can detect low rate degrading attacks too. Lakhina has observed that most of traffic anomalies despite their diversity share a common characteristic: they induce a change in distributional aspects of packet header fields (i.e. source address, source port, destination address, and destination port etc called traffic features). Our hypothesis to detect attacks treats DDoS anomalies as events that disturb the distribution of traffic features. For example, a DoS attack, regardless of its volume, will cause the distribution of the destination address to be concentrated on the victim address. Similarly, a scan for vulnerable port (network scan) will have a dispersed distribution for destination addresses, and a skewed distribution for destination ports that is concentrated on the vulnerable port being scanned. The key question here is to decide which parameter to be used for measuring distribution of traffic features. In this work, we have chosen Entropy as a metric to model the flooding attacks. Entropy captures in a single value the distributional changes in traffic features, and observing the time series of entropy on multiple features exposes unusual traffic behavior. B. Entropy Based DDoS Detection Scheme
V. EXPERIMENTAL SETUP AND PERFORMANCE ANALYSIS In this section, we evaluate our proposed scheme using simulations. The simulations are carried out using NS2 network simulator [8]. We show that false positives and false negatives (or various error rates) triggered by our scheme are very less. This implies that profiles built are reasonably stable and are able to predict number of zombies correctly. A. Simulation Environment Real-world Internet type topologies generated using Transit-Stub model of GT-ITM topology generator [7] are used to test our proposed scheme, where transit domains are treated as different Internet Service Provider (ISP) networks i.e. Autonomous Systems (AS). For simulations, we use ISP level topology, which contains four transit domains with each domain containing twelve transit nodes i.e. transit routers. All the four transit domains have two peer links at transit nodes with adjacent transit domains. Remaining ten transit nodes are connected to ten stub domain, one stub domain per transit node. Stub domains are used to connect transit domains with customer domains, as each stub domain contains a customer domain with ten legitimate client machines. So total of four hundred legitimate client machines are used to generate background traffic. Total zombie machines range between 10 and 100 to generate attack traffic. Transit domain four contains the server machine to be attacked by zombie machines. A short scale simulation topology is shown in figure 1.
Here, we will discuss our detection system that is part of access router or can belong to separate unit that interact with access router to detect attack traffic. Entropy [11] based DDoS scheme is used to construct profile of the traffic normally seen in the network, and identify anomalies whenever traffic goes out of profile. A metric that captures the degree of dispersal or concentration of a distribution is sample entropy. Sample entropy H(X) is
H ( X ) = −∑ pi log 2 ( pi )
59
Client Machine
Zombie Machine
Router
N
ISP Network
(11)
i =1
where pi is ni/S. Here ni represent total number of bytes arrivals
for
a
flow
i
in
{t
−
∆,
Server
t}
= ∑ ni , i = 1, 2....N . The value of sample entropy N
and S
i =1
lies in the range 0-log2 N. To detect the attack, the value of
Hc ( X ) is calculated
in time window ∆ continuously; whenever there is appreciable deviation from X n ( X ) , various types of DDoS attacks are detected. Hc ( X ) , and X n ( X ) gives Entropy at the time of detection of attack and Entropy value for normal profile respectively.
© 2011 ACADEMY PUBLISHER
Figure 1. A short scale simulation topology
Currently, the majority of the DDoS attacks are flooding type, so we will consider detection of a wide range of flooding DDoS attacks in this section. The legitimate clients are TCP agents that request files of size 1 Mbps with request inter-arrival times drawn from a Poisson distribution. The attackers are modeled by UDP agents. A UDP connection is used instead of a TCP one because in a practical attack flow, the attacker would normally never follow the basic rules of TCP, i.e. waiting for ACK packets before the next window of outstanding
60
JOURNAL OF ADVANCES IN INFORMATION TECHNOLOGY, VOL. 2, NO. 1, FEBRUARY 2011
Sample Entropy (H)
packets can be sent, etc. The attack traffic rate is fixed to 25 Mbps in total; therefore, mean attack rate per zombie is varied from 0.25Mbps to 2.5 Mbps. In our experiments, the monitoring time window was set to 200 ms, as the typical domestic Internet RTT is around 100 ms and the average global Internet RTT is 140 ms [12]. Total false positive alarms are minimum with high detection rate using this value of monitoring window. The simulations are repeated and different attack scenarios are compared by varying total number of zombie machines and at fixed attack strengths.
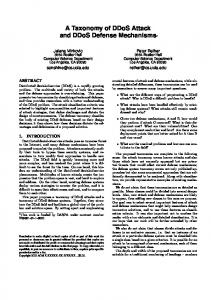
VI. MODEL DEVELOPMENT In order to predict number of zombies ( Yˆ ) from deviation (HC - Hn) in entropy value, simulation experiments are done at the same attack strength 25Mbps in total and varying number of zombies from 10-100 with increment of 5 zombies i.e. mean attack rate per zombie from 0.25Mbps-2.5Mbps. Figure 2 shows entropy variation with 10-100 numbers of zombies at same attack strength in total of 25Mbps. Table I represents deviation in entropy with actual number of zombies.
8.9 8.8 8.7 8.6 8.5 8.4 8.3 8.2 8.1 8.0 7.9 7.8 7.7 0
3
6
9 12 15 18 21 24 27 30 33 36 39 42 45 48 51 54 57 60 Time (seconds) H(Normal) H(10) H(15) H(20) H(25) H(30) H(35) H(40) H(45) H(50) H(55) H(60) H(65) H(70) H(75) H(80) H(85) H(90) H(95) H(100) Figure 2. Entropy variation with varied number of zombies
TABLE 1 DEVIATION IN ENTROPY WITH ACTUAL NUMBER OF ZOMBIES
Polynomial regression model is developed using number of zombies (Y) and deviation (HC - Hn) in entropy value as discussed in Table I to fit the regression equation. Figure 3 shows the regression equation and coefficient of correlation for polynomial regression model.
Actual Number of Zombies (Y)
Deviation in Entropy (X) (Hc-Hn)
10
0.045
15
0.046
20
0.048
25
0.050
30
0.068
35
0.087
40
0.099
45
0.111
50
0.121
55
0.130
60
0.139
65
0.148
70
0.157
75
0.163
80
0.170
85
0.176
90
0.182
VII. RESULTS AND DISCUSSION
95 100
0.189 0.192
We have developed polynomial regression model as discussed in section 6. Various performance measures are
© 2011 ACADEMY PUBLISHER
120
y = 1559.x2 + 170.7x + 6.823 R² = 0.989
100 80 60 40 20
Polynomial Regression
0 0.00
0.05
0.10
0.15
0.20
0.25
Figure 3. Regression equation and coefficient of correlation for polynomial regression model
JOURNAL OF ADVANCES IN INFORMATION TECHNOLOGY, VOL. 2, NO. 1, FEBRUARY 2011
used to check the accuracy of this model. Number of zombies can be computed and compared with actual number of zombies using proposed regression model. The comparison between actual number of zombies and predicted number of zombies using polynomial regression model is depicted in figures 4.
61
It can be inferred from table II that for polynomial regression model Values of R2, CC, SSE, MSE, RMSE, NMSE, η, MAE are 0.99, 0.99, 146.88, 7.73, 2.78, 027, 0.99 and 0.92 respectively. Hence number of zombies predicted by this model is close to the observed number of the zombies. VIII. CONCLUSION
120
Recently, a number of highly publicized incidents of DDoS make clear that it is a complex and difficult problem. Several schemes have been proposed on how to defend against these attacks, but they suffer from a range of problems, some of them being impractical and others not being effective against these attacks. This paper investigates suitability of polynomial regression model to predict number of zombies involved in a flooding DDoS attack from deviation ( Hc ( X ) - X n ( X ) ) in sample
100 80 60 40 20 0
Observed number of Zombies Pridicted number of zombies
Figure 4. Comparison between actual number of zombies and predicted number of zombies using polynomial regression model
To represent false positive (falsely predicted normal clients as zombies) and false negative (zombies are identified as normal client) we plot residual error. Positive cycle of residual error curve represents false positive, while negative cycle represents false negative. Figure 5 represents residual error for polynomial regression model. Table II shows values of various performance measures. 10.00 8.00
Residual error
6.00 4.00 2.00 0.00 -2.00 0
10 20 30 40 50 60 70 80 90 100 110
-4.00 -6.00 -8.00 Figure 5. Residual error in polynomial regression model TABLE II. VALUES OF VARIOUS PERFORMANCE MEASURES R2
0.99
CC
0.99
SSE
146.88
MSE
7.73
RMSE
2.78
NMSE
0.27
η
0.99
MAE
0.92
© 2011 ACADEMY PUBLISHER
entropy. We have calculated various statistical performance measures i.e. R2, CC, SSE, MSE, RMSE, NMSE, η, MAE and residual error and their values are 0.99, 0.99, 146.88, 7.73, 2.78, 027, 0.99 and 0.92 respectively. Therefore, total number of predicted zombies using polynomial regression model is very close to observe/actual number of zombies. However, simulation results are promising as we are able to predict number of zombies efficiently, experimental study using a real time test bed can strongly validate our claim.
REFERENCES [1] B. B. Gupta, M. Misra, R. C. Joshi, “An ISP level Solution to Combat DDoS attacks using Combined Statistical Based Approach,” in International Journal of Information Assurance and Security (JIAS), vol. 3, issue 2, Dynamic Publishers Inc., USA, pp. 102-110, 2008. [2] B. B. Gupta, R. C. Joshi, M. Misra, “Defending against Distributed Denial of Service Attacks: Issues and Challenges,” in Information Security Journal: A Global Perspective, vol. 18, number 5, Taylor & Francis Group, UK, pp. 224-247, 2009. [3] B. B. Gupta, R. C. Joshi, M. Misra, “Dynamic and Auto Responsive Solution for Distributed Denial-of-Service Attacks Detection in ISP Network,” International Journal of Computer Theory and Engineering (IJCTE), vol.1, number 1, IACSIT Press, Singapore, pp. 71-80, 2009. [4] S. M. Stigler, “Optimal Experimental Design for Polynomial Regression,” Journal of American Statistical Association, 1971, vol. 66, num. 334, pp. 311-318, 1971. [5] T. W. Anderson, “The Choice of the Degree of a Polynomial Regression as a Multiple Decision Problem,” The Annals of Mathematical Statistics, Vol. 33, No. 1 (Mar., 1962), pp. 255-265. [6] D. Moore, C. Shannon, D. J. Brown, G. Voelker, S. Savage, “Inferring Internet Denial-of-Service Activity,” ACM Transactions on Computer Systems, 24 (2), 115-139, (2006). [7] GT-ITM Traffic Generator Documentation and tool. Available at: http://www.cc.gatech.edu/fac/EllenLegura/ graphs.html. [8] NS Documentation. Available at: http://www.isi.edu/nsnam/ns.
62
JOURNAL OF ADVANCES IN INFORMATION TECHNOLOGY, VOL. 2, NO. 1, FEBRUARY 2011
[9] Lindley, D.V. (1987). "Regression and correlation analysis," New Palgrave: A Dictionary of Economics, vol. 4, pp. 120–23. [10] David A. Freedman, Statistical Models: Theory and Practice, Cambridge University Press, 2005. [11] C. E. Shannon, “A mathematical theory of communication,” ACM SIGMOBILE Mobile Computing and Communication Review, vol. 5, pp. 3-55, 2001. [12] B. Gibson, “TCP Limitations on File Transfer Performance Hamper the Global Internet,” White paper, Sept. 2006. Available at: http://www.niwotnetworks.com/gbx/TCPLimitsFastFileTra nsfer.htm.
B. B. Gupta received the bachelor’s degree in Information Technology in 2005 from Rajasthan University, India. He is currently a PhD student in the Department of Electronics and Computer Engineering at Indian Institute of Technology, Roorkee, India. His research interests include defense mechanisms for thwarting Denial of Service attacks, Network security, Cryptography, Data mining and Data structure and Algorithms.
R. C. Joshi received the bachelor’s degree in Electrical Engineering from Allahabad University, India in 1967. He received his master’s and PhD degree in Electronics and Computer Engineering from University of Roorkee, India in 1970 and 1980, respectively. Currently, he is working as a Professor at Indian Institute of Technology Roorkee, India. He has served as Head of the Department twice from Jan 1991 to Jan 1994 and from Jan 1997 to Dec 1999. He has been Head of Institute Computer Centre (ICC), IIT Roorkee from March 1994- Dec 2005. Prof. Joshi is in expert panel of various national committees like AICTE, DRDO and MIT. He has a vast teaching experience exceeding 38 years at graduate and postgraduate levels at IIT Roorkee. He has guided over 25 PhD thesis, 150 M.E./M.Tech dissertations and 200 B.E./B.Tech projects. Prof. Joshi has published over 250 research papers in National/International Journals/Conferences and presented many in Europe, USA and Australia. He has been awarded Gold Medal by Institute of Engineers for best paper. He has chaired many national and international conferences and workshops. Presently, he is actively involved in research in the field of Database management system, Data mining, Bioinformatics, Information security, Reconfigurable systems and Mobile computing. Manoj Misra received the bachelor’s degree in Electrical Engineering in 1983 from HBTI Kanpur, India. He received his master’s and PhD degree in Computer Engineering in 1986 and 1997 from University of Roorkee, India and Newcastle upon Tyne, UK, respectively. He is currently a Professor at Indian Institute of Technology Roorkee. He has guided several PhD theses, M.E./M.Tech. Dissertations and completed various projects. His areas of interest include Mobile computing, Distributed computing and Performance Evaluation.
© 2011 ACADEMY PUBLISHER