Graefes Arch Clin Exp Ophthalmol DOI 10.1007/s00417-016-3275-4
RETINAL DISORDERS
Prediction of regression of retinal neovascularisation after panretinal photocoagulation for proliferative diabetic retinopathy Irini P. Chatziralli 1 & Theodoros N. Sergentanis 2 & Sobha Sivaprasad 1,3
Received: 3 August 2015 / Revised: 8 January 2016 / Accepted: 12 January 2016 # Springer-Verlag Berlin Heidelberg 2016
Abstract Purpose The purpose of this study was to evaluate the regression of neovascularization elsewhere (NVE) after panretinal photocoagulation (PRP) based on its location in relation to the internal limiting membrane (ILM). Methods Participants in this retrospective case series were 47 patients with active NVE within the vascular arcade. All patients were treated with PRP and followed up for at least 12 months. The time to regression of NVE based on its location relative to the ILM on spectral domain-optical coherence tomography (SD-OCT) was analyzed. Results The proportion of eyes, showing regression of NVE at the end of follow-up period was 19/25 (76 %) in the Bbelow ILM^ group and 13/22 (59 %) in the Babove ILM^ group. The Bbelow ILM^ group was associated with a twofold enhanced regression of NVE in comparison to the Babove ILM^ group (HR = 2.13, p = 0.038). Conclusions Regression of NVE is determined by its location relative to the ILM. Patients with Bbelow ILM^ NVE were found to show a twofold increased regression rate in comparison with the Babove ILM^ group, while the proportion of eyes showing regression of NVE at the end of the follow-up period was significantly greater in the Bbelow ILM^ than the Babove ILM^ group.
* Sobha Sivaprasad
[email protected]
1
Laser and Retinal Research Unit, King’s College Hospital, Denmark Hill, London SE5 9RS, UK
2
Department of Epidemiology and Biostatistics, University of Athens, Athens, Greece
3
NHIR, Moorfields Eye Hospital, London, UK
Keywords Neovascularization . Photocoagulation . Proliferative diabetic retinopathy
Introduction Diabetic retinopathy (DR) is present in approximately 35 % of persons with diabetes mellitus, while proliferative DR (PDR) affects approximately 7 % of patients with DR [1, 2]. Neovascularization is the predominant feature of PDR and the new vessels may develop on the disc (NVD) or elsewhere on the retina (NVE) [2]. Clinically, NVE is characterized by fine loops or networks of vessels arising from the venous side of circulation, lying mainly parallel to the surface of the retina and extending into the vitreous cavity after penetration of the internal limiting membrane (ILM). Recent advances in retinal imaging and innovation have allowed us to understand better the relation of the new vessels to the retinal layers. The high-resolution spectral domainoptical coherence tomography (SD-OCT) images and faster scanning have shown that NVE can also exist in the inner retinal layers [3]. It is clinically difficult to differentiate these intraretinal neovascular complexes from intraretinal microvascular abnormalities (IRMA). Fluorescein angiography (FA) is the gold standard test that could differentiate NVE and IRMA, as the latter shows no signs of leakage in contrast to NVE, which demonstrates extensive leakage [3, 4]. Recently, several investigators have attempted to describe further the appearance of the NVE and its relation to the vitreoretinal interface using SD-OCT, swept-source OCT and Doppler OCT [3–7]. We hypothesized that the location of the neovascular complex may in fact have an impact on the response of NVE to treatment. Panretinal photocoagulation (PRP) is the standard treatment for PDR, as it has been proven to reduce the risk of
Graefes Arch Clin Exp Ophthalmol
severe visual loss by over 50 % in high-risk PDR patients at the 4-year follow-up [8]. The PASCAL (Pattern SCAn Laser; Topcon Medical Laser Systems, Santa Clara, CA, USA) is a frequency-doubled 532-nm wavelength Nd:YAG laser that delivers arrays up to 56 spots with a single foot pedal depression [9–12]. There are quite a few reports associated with the use, risk, and prognostic factors, as well as technological advances of PRP [13–17]. The primary response to PRP is the regression of the NVE. However, the regression of NVE is variable within and between eyes. To our knowledge, the location of the NVE as a prognostic factor after PRP has not been yet investigated. Therefore, the purpose of this study was to evaluate the effect of the location of the NVE relative to the ILM on the regression of the NVE after PRP.
Materials and methods In this retrospective case series, we reviewed the laser database at the Laser and Medical Retina Unit, King’s College Hospital, London, UK to identify patients who underwent PRP for PDR from January 2012 to December 2013 and had a minimum follow-up of 12 months. We then reviewed the available FA and SD-OCT images of these patients to identify consecutive patients with NVE in the posterior pole that were captured on macular scans performed on SD-OCT. We excluded patients with diabetic macular oedema (defined as central retinal thickness more than 320 μm), other co-existent ocular pathologies, such as age-related macular degeneration, retinal vein occlusion or ocular inflammation, or with poor quality OCT scans. Patients with either type 1 or 2 diabetes were included. The demographic and clinical details were obtained from case-notes. Institutional review board approval is not required in our institute for retrospective studies. All patients included in this study had data on bestcorrected visual acuity (BCVA) measured using standard ETDRS protocol at 4-m distance with a modified ETDRS distance chart and recorded in ETDRS letters. As far as the OCT acquisition was concerned, SD-OCT (Spectralis HRA + OCT, Heidelberg Engineering, Heidelberg, Germany) was used in all patients. The OCT volume scan was performed on a 20 × 20° cube, consisted of 49 horizontal B-scans with 20 averaged frames per B-scan centered over the fovea, each containing 1064 pixels, separated by 125 μm. The integrated follow-up mode of the device was used to ensure that the exact retinal area and the specific raster line were imaged at every follow-up visit. FA was performed using Topcon (Topcon TRC 501X; Topcon Medical Systems, Inc, Paramus, NJ, USA) or Spectralis (HRA + OCT). NVE was detected clinically and on fundus photograps, and confirmed as leakage on FA, where available. In case of multiple NVEs, the largest NVE in surface, as detected on fundus photographs and fundoscopy, was selected.
For the analysis of the OCT scans, one horizontal scan that passed through the NVE and provided the best visualization of the NVE was selected in each case. As the integrated followup mode of the device was used in the protocol, we were able to ensure that the exact retinal area and the specific raster line were analysed at every follow-up visit. The morphology of NVE on SD-OCT was broadly classified into being totally below the ILM or above the ILM if the NVE has penetrated the ILM. We described these neovascular complexes in more detail as follows: 1. Below the ILM (n = 25): These NVE were seen as intraretinal hyperreflective thickening/mass, which extended through the inner plexiform layer, ganglion cell layer and nerve fiber layer (Fig. 1), 2. Above the ILM (n = 22): The topography of these vessels varied significan,tly and we broadly defined them as hyperreflective lesions extended through and above the ILM and attached to the thickened posterior hyaloid creating a scaffold or as hyperreflective lines extending into the vitreous cavity (Figs. 2 and 3). The regression rate of the NVE (proportion of regressed NVEs among all NVEs) after PRP in the two groups (above and below the ILM) was compared. All patients had received at least two sessions of PRP (range: 1–3 sessions) in the studied eye, according to the ETDRS protocol [18], using PASCAL photocoagulator. The data on laser application from the case-notes and images indicate that the multispot laser spots of gray-white lesions were obtained by applying a beam size of 200 μm with an exposure time 20 ms and moderate intensity (200–400 mW). The median number of spots was 2950 and 2815 spots for the Babove^ and Bbelow ILM^ group respectively. BFailure to regress^ or Bpersistence^ on OCT was defined as failure to show significant regression of the NVE or disappearance of the hyperreflective lesions above or below the ILM at the last follow-up. Conversely, patients were categorised as successfully treated if regression of neovascularisation with no recurrence of the NVE or complete absence of the hyperreflective lesion was observed. We compared the time to regression of the NVE depending on the location of NVE above or below the ILM. Statistical analysis For the description of patients’ characteristics at baseline, mean ± standard deviation (SD) was used for continuous variables and counts with percentages for categorical variables. Mann–Whitney Wilcoxon test for independent samples (MWW for brevity) was performed to compare the two groups regarding age and BCVA, while the respective comparisons concerning categorical variables (gender, morphology of
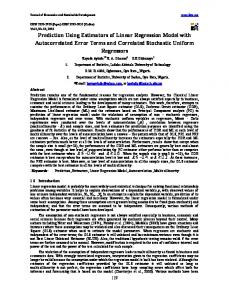
Graefes Arch Clin Exp Ophthalmol Fig. 1 Thirty-eight-year-old male patient with type 1 diabetes with Bbelow internal limiting membrane^ neovascularization. a Color fundus photo, showing retinal neovascularisation elsewhere (white arrow); b early and c late phase fluorescein angiogram, showing leakage at the site of neovascularisation (white arrow) and microaneurysms; d Spectral domain-optical coherence tomography, showing intraretinal hyperreflective thickening (orange arrows) at the site of neovascularisation below the internal limiting membrane (blue arrows); e Spectral domain-optical coherence tomography 4 months after one session of panretinal photocoagulation, showing regression of neovascularisation and no hyperreflective area
NVE) were conducted using the Chi-squared test or Fisher’s exact test, as appropriate. Univariate Cox regression analysis was performed to evaluate the factors affecting time of regression of NVE (age, gender, BCVA at baseline, location of NVE); the respective hazard ratios (HRs) together with their 95 % confidence intervals (CIs) were provided. Statistical analysis was performed using STATA/SE 13 statistical software (Stata Corporation, College Station, TX, USA). A p value