Energy Sources, 24:773–785, 2002 Copyright © 2002 Taylor & Francis 0090-8312 /02 $12.00 C .00 DOI: 10.1080/0090831029008668 0
Prediction of Solar Radiation Parameters Through Clearness Index for Izmir, Turkey KORAY ULGEN Solar Energy Institute Ege University Bornova, Izmir, Turkey
ARIF HEPBASLI Department of Mechanical Engineering Faculty of Engineering Ege University Bornova, Izmir, Turkey The need for meteorological parameters is essential in the design and study of solar energy conservation devices. Other uses of such information include agricultural studies, meteorological forecasting, environment, and energy conversion. In this study, the ratio of monthly average hourly diffuse radiation to monthly average hourly global radiation (Id =I ) was correlated with the monthly average hourly clearness index (kT ) in the form of the polynomial relationships for the city of Izmir in the western part of Turkey. Experimental data were measured in the Solar-Meteorological Station of Solar Energy Institute in Ege University over a 5 year period from 1994 to 1998. The values of the monthly average-daily hours of bright sunshine (S) varied between 3.54 and 12.28. The values of the monthly average-daily clearness index (KT ) ranged from 0.41 to 0.66, averaged for the same period. The frequency distribution of the clearness index was also given. It can be concluded that the present models estimate the values of Id for Izmir, and possibly elsewhere with similar climatic conditions, reasonably well if the values of I are known or can be predicted. Keywords clearness index, correlation models, experimental measurements, global and diffuse radiation, solar energy system, Izmir, Turkey
Introduction Renewable energy is accepted as a key source for the future, not only for Turkey but also for the world. This is primarily due to the fact that renewable energy resources have some advantages when compared to fossil fuels. At the present time, with existing technology, it is impossible to supply the total demand of any country from renewable resources (Ediger and Kentel, 1999). However, environmental concerns and limited energy sources make renewable energy technology as a good candidate as fossil fuels. They are, in fact, Received 25 August 2001; accepted 19 October 2001. Address correspondence to Dr. Koray Ulgen, Solar Energy Institute, Ege University 35100, Bornova, Izmir, Turkey. E-mail:
[email protected]
773
774
K. Ulgen and A. Hepbasli
complementary to each other and can be used effectively alone or in combinations of 2 or more renewable energy sources (e.g., wind and biomass). Thus all renewable options should be pursued in tandem (Wrixon et al., 1993). Turkey is geographically well situated with respect to solar energy potential, which is about 2640 h per year. Average daily solar energy density is 3.6 kWh/m2 . In 1998, solar energy potential was 100 ktoe (kilo tons of oil equivalent). It is estimated to be 129 ktoe, 431 ktoe, and 828 ktoe in 2000, 2010, and 2020, respectively (WEC-TNC, 1997; WEC-TNC, 2000). The total gross solar energy potential of Turkey is about 88 mtoe (million tons of oil equivalent). Maximum solar radiation intensity value is observed as 21.1 MJ/m2 in July with a minimum of 5.5 MJ/m2 in December (TUBITAK-TTGV, 1998). Although Turkey has high solar potential, residential and industrial utilization of solar energy started in the 1980s. The residential sector accounted for the biggest share at about 3 times the consumption of the industrial sector between 1986 and 1998 in Turkey. Solar collectors mounted in 1998 were 3,000,000 m2 , and total energy production related to this amount was 100,000 toe (WEC-TNC, 2000). One of the most important requirements in the design and study of solar energy conservation devices is information on solar radiation and its components at a given location (Gopinathan and Soler, 1995). In other words, a reasonably accurate knowledge of the availability of the solar resource at any place is required by solar engineers, architects, agriculturists, and hydrologists in many applications of solar energy such as solar furnaces, concentrating collectors, and interior illumination of buildings (Tasdemiroglu and Sever, 1991a; Tiris et al., 1996; Togrul and Onat, 1999; Kaygusuz, 1999). On the other hand, the determination of solar energy capacity effectively, through the empirical models, plays a key role in developing solar energy technologies and the sustainability of natural resources (Ertekin and Yaldiz, 2000). For this purpose, in the past several empirical formulas using various parameters have been tested in order to estimate the solar radiation around the world (Soler, 1988; Samuel, 1991; Kudish and Lanetz, 1992; El Aroudam et al., 1992; Nfaoui and Buret, 1993; Srivasta et al., 1993; Rehman and Halawani, 1997; Aksakal and Rehman, 1999; Mosalam Shaltout et al., 2001; Hassan, 2001). These parameters include extraterrestrial radiation, sunshine hours, relative humidity, ambient temperature, soil temperature, number of rainy days, altitude, latitude, and cloudiness. Based on the studies carried out in Turkey, some researchers gave the correlations for some provinces of Turkey such as Gebze (Dincer et al., 1995; Tiris et al., 1996; Sen and Tan, 2001), Elazig (Togrul and Onat, 1999), Trabzon (Kaygusuz, 1999), Antalya (Ertekin and Yaldiz, 1999; Ertekin and Yaldiz, 2000), and also for Turkey’s general values (Tasdemiroglu and Sever, 1991a, b). The main objective of this study is to develop some empirical relations for Izmir, Turkey in order to estimate the solar radiation parameters (global and diffuse radiation) with the monthly average hourly clearness index.
Solar Evaluation Instruments and Measurements The Solar-Wind Meteorological Station located on the roof of the Solar Energy Institute Building in Ege University is used to measure the local potentials of both solar and wind energy data. The station is fully operated with passive energy and hereby the supplementary energy is not needed. The data collection is made at an interval of 1 s and the monthly average values are also recorded. The solar radiation measurement system was installed in October 1993 and the measurements have been carried out since then.
Clearness Index for Izmir, Turkey
775
The monthly average hourly global and diffuse solar radiation data averaged for 5 years studied are given in Table 1, while they are shown graphically in Figures 1–4. The monthly average daily global and diffuse radiations are presented in Figure 5. The average hours of bright sunshine are also listed in Table 2.
Theoretical Analysis Solar radiation is the most important parameter in the design of solar energy conversion systems. Solar radiation data are commonly available in 2 forms, such as the monthly average daily global solar radiation on a horizontal surface (H ) and the hourly total radiation on a horizontal surface (I ) for each hour for extended periods of one or more years. The H data are widely available (Duf e and Beckman, 1991). Diffuse radiation, needed in many solar energy applications, is measured in comparatively few locations. Therefore it is common practice to estimate its value from other measurement parameters. Correlations used for predicting monthly average daily values of diffuse radiation may be classi ed in 4 groups as follows (Gopinathan and Soler, 1996; Kaygusuz, 1999): (i) from the clearness index, (ii) from global radiation before striking the ground, (iii) from relative sunshine duration, and (iv) from both clearness index and relative sunshine duration. In the present study, the equations belonging to the rst group were used, as given in the following. The monthly-average clearness index (KT ) is the ratio of the monthly average daily radiation on a horizontal surface (H ) to the monthly average daily extraterresterial radiation (Ho ), that is, (Angström, 1924; Page, 1961; Duf e and Beckman, 1991; Al-Hinai and Al-Alawi, 1995) KT D
H : Ho
(1)
The monthly average daily extraterrestrial radiation on a horizontal surface may be computed from the following equations: Ho D with
³ ´ 24 ¼ Gon cos Á cos ± sin !s C !s sin Á sin ± ¼ 180
³ ³ 360 n ´´ day Gon D Gsc 1 C 0:033 cos ; 365
(2)
(3)
where Gsc is the solar constant (D 1367 W/m2 ), Á is the latitude of the site, ± is the solar declination, !s is the main sunshine hour angle for the month, and nday is the number of the day of the year starting from the rst of January. The solar declination, main sunshine hour angle for the month, and maximum possible sunshine duration (So ) are given as follows (Duf e and Beckman, 1991): ³ 360 ´ ± D 23:45 sin .284 C nd ay / ; (4) 365 !s D cos ¡1 .¡ tan Á tan ±/; So D
2 !s : 15
(5) (6)
776
Daily total
19–20
18–19
17–18
16–17
15–16
14–15
13–14
12–13
11–12
10–11
9–10
8–9
7–8
6–7
5–6
4–5
Hour
G D G D G D G D G D G D G D G D G D G D G D G D G D G D G D G D G D
G/D
0.00 0.00 0.00 0.00 0.00 0.00 30.53 30.28 332.50 307.41 733.86 542.51 1078.22 585.05 1279.04 503.54 1268.40 429.26 1104.30 336.62 867.88 209.76 502.53 180.96 150.92 150.93 0.00 3.86 0.00 0.00 0.00 0.00 3280.16 7348.18
Jan.
0.00 0.00 0.00 0.00 0.84 0.84 136.64 133.34 550.65 479.04 1017.95 696.51 1414.33 707.56 1705.44 602.28 1650.99 538.23 1492.51 455.45 1210.93 322.36 808.76 176.14 380.21 122.49 55.67 55.68 0.00 0.00 0.00 0.00 4289.93 10424.91
Feb.
0.00 0.00 0.04 0.04 63.53 62.51 456.48 422.16 992.77 771.71 1507.81 952.83 1832.20 910.41 2058.03 791.82 2095.39 713.47 1859.95 596.62 1534.95 441.31 1102.74 274.93 641.91 133.74 207.24 114.03 5.88 5.88 0.00 0.00 6191.45 14358.92
Mar. 0.00 0.00 22.62 22.38 331.78 313.36 899.61 726.62 1537.78 1034.54 2019.87 1160.18 2440.20 1125.65 2561.49 978.69 2492.54 805.56 2319.08 688.77 1868.46 556.07 1410.20 369.80 897.48 196.02 409.73 154.09 58.09 34.06 0.80 0.81 8166.62 19269.73
Apr. 0.89 0.89 153.64 149.73 654.71 576.20 1249.50 928.13 1868.20 1188.64 2361.32 1284.86 2714.31 1236.75 2803.64 1075.94 2760.86 883.25 2612.86 724.18 2263.35 602.31 1779.83 445.76 1213.04 270.56 638.78 129.40 181.92 44.56 31.25 3.29 9544.46 23288.09
May 35.01 10.08 242.82 235.55 821.20 711.29 1484.34 1068.90 2122.41 1290.66 2638.02 1354.15 3008.65 1279.62 3157.26 1098.51 3157.74 868.39 2967.65 720.73 2617.37 592.77 2135.42 463.44 1529.69 315.95 888.51 178.97 326.68 102.65 20.98 21.00 10312.67 27153.76
Jun. 0.72 0.72 157.14 153.76 709.22 647.52 1402.41 1062.48 2042.98 1309.37 2606.83 1388.37 2991.24 1310.60 3163.22 1097.51 3175.79 825.66 2990.03 679.30 2633.84 566.73 2123.39 456.05 1534.51 312.10 884.16 177.27 312.61 73.02 17.54 17.55 10078.00 26745.61
Jul. 0.00 0.00 43.14 42.74 469.34 449.32 1144.86 931.32 1831.31 1218.83 2382.20 1316.02 2764.50 1275.00 2964.49 1062.93 2916.66 820.79 2729.54 649.76 2386.07 509.81 1890.98 384.50 1251.73 251.95 609.12 168.16 135.39 69.98 0.88 0.88 9151.98 23520.21
Aug. 0.00 0.00 3.41 3.40 247.13 238.67 858.27 700.72 1492.11 975.41 2029.82 1099.23 2385.18 1067.75 2540.78 903.59 2563.13 699.35 2316.89 543.23 1880.73 436.07 1341.31 294.44 734.56 147.54 233.63 40.79 10.03 10.04 0.00 0.00 7160.27 18636.97
Sep.
Oct. 0.00 0.00 0.00 0.01 68.03 66.58 494.92 414.43 1055.93 685.67 1561.25 782.72 1879.82 740.97 2011.26 649.95 1912.29 565.54 1693.37 464.21 1287.37 327.73 781.88 170.69 301.62 158.06 26.87 26.90 2.59 2.62 0.00 0.00 5056.09 13077.22
Table 1 Hourly averaged global (G) and diffuse (D) solar radiations on a horizontal surface (kJ/m2 )
0.00 0.00 0.00 0.01 4.15 4.13 194.39 181.57 627.12 445.85 1023.72 567.02 1316.37 581.82 1462.31 513.85 1382.08 443.95 1159.67 342.93 828.69 210.46 419.70 87.78 85.05 38.20 0.13 0.13 0.00 0.00 0.00 0.00 3417.71 8503.38
Nov.
0.00 0.00 0.00 0.00 0.00 0.01 37.73 37.22 325.13 289.10 689.25 482.71 970.62 497.00 1079.85 431.75 1036.51 398.64 869.60 297.08 598.42 160.97 307.30 63.01 49.34 26.19 0.00 0.00 0.00 0.00 0.00 0.00 2683.73 5963.75
Dec.
Clearness Index for Izmir, Turkey
Figure 1. Monthly average hourly global solar radiation between 5:00 and 12:00 h.
Figure 2. Monthly average hourly global solar radiation between 12:00 and 19:00 h.
777
778
K. Ulgen and A. Hepbasli
Figure 3. Monthly average hourly diffuse solar radiation between 5:00 and 12:00 h.
Figure 4. Monthly average hourly diffuse solar radiation between 12:00 and 19:00 h.
Clearness Index for Izmir, Turkey
779
Figure 5. Monthly-average daily extraterrestrial, global, beam, and diffuse radiations (beam radiation is given as the difference of global and diffuse radiations).
The monthly average hourly clearness index kT can also be de ned as kT D
I ; Io
(7)
where I is the monthly average hourly global radiation and Io is the monthly average hourly extraterrestrial radiation. Io can be calculated by the following equation: Io D
12
³ ´ 3600 .!2 ¡ !1 / Gon cos Á cos ±.sin !2 ¡ sin !1 / C sin Á sin ± : ¼ 180
¤
(8)
Results and Discussion As can be seen in Table 1, the maximum value of the monthly average daily total global radiation was observed to be 27154 kJ/m2 in June, while that of the diffuse radiation was recorded to be 10313 kJ/m2 for the same month. The minimum value of the monthly average daily total global radiation was 5964 kJ/m2 recorded during December, while that of the diffuse radiation was 2684 kJ/m2 recorded for the same month. The monthly average daily hours of bright sunshine .S/ are given in Table 2 over a 5 year period. The highest S values were in summer with a mean value of 12.28, while the lowest S values were in winter with a mean value of 3.54. These gures showed good agreement with the ndings of Tasdemiroglu and Sever (1991b).
780
94
4.07 4.67 7.75 8.90 9.97 11.15 12.23 11.87 10.61 6.70 5.38 4.14 8.12
Months
Jan. Feb. Mar. Apr. May. Jun. Jul. Aug. Sep. Oct. Nov. Dec. Annual average
3.52 6.55 5.98 8.31 10.04 11.78 12.16 11.47 9.35 8.53 4.57 3.49 7.98
95
3.86 3.52 5.40 8.44 9.13 12.56 12.68 11.54 8.60 7.32 5.69 3.08 7.65
96 5.47 5.56 7.13 5.58 10.89 10.33 11.98 10.08 9.98 6.23 4.67 3.79 7.64
97 4.82 6.46 4.96 7.14 6.40 11.57 12.36 11.51 9.11 7.42 4.86 3.19 7.48
98
Duration of bright sunshine (S) in hour
4.35 5.35 6.25 7.67 9.29 11.48 12.28 11.29 9.53 7.24 5.03 3.54 7.78
Average 0.43 0.43 0.55 0.60 0.59 0.64 0.65 0.66 0.61 0.50 0.49 0.41 0.55
94 0.38 0.54 0.51 0.56 0.63 0.65 0.66 0.66 0.62 0.64 0.48 0.42 0.56
95 0.43 0.40 0.48 0.58 0.59 0.69 0.66 0.62 0.58 0.57 0.53 0.41 0.54
96
0.53 0.52 0.56 0.45 0.63 0.62 0.66 0.62 0.66 0.53 0.48 0.41 0.56
97
0.50 0.55 0.46 0.55 0.49 0.66 0.67 0.65 0.60 0.57 0.46 0.39 0.55
98
0.45 0.49 0.51 0.55 0.58 0.65 0.66 0.64 0.61 0.56 0.49 0.41 0.55
Average
Monthly average daily clearness index (KT )
Table 2 The monthly-average-daily hours of bright sunshine (S) and monthly average daily clearness index (KT ) for Izmir
Clearness Index for Izmir, Turkey
781
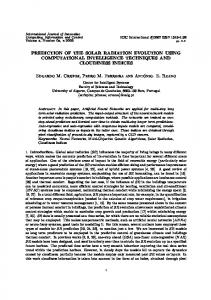
Table 2 illustrates the values of the monthly average daily clearness index, KT , over a 5 year period from 1994 through 1998. It was found that the minimum and maximum values of KT are 0.41 in December and 0.66 in July, with an annual average value of 0.55. The frequency of occurrence of days with various levels of clearness index, KT , is illustrated in Figure 6. It is clear from this gure that for KT values between 0.4 and 0.5, the frequency of occurrence of days was 43% in the winter days. KT ranged from 0.5 to 0.6 with a frequency of 40% in the spring and autumn days, while it varied between 0.6 and 0.7 with that of 90% in the summer days. In most days, KT values were over 0.5. Figure 7 shows a plot of diffuse fraction Id =I versus kT for the site studied. In order to obtain Id =I versus kT correlations, data from the Izmir location were divided into bins or ranges of values of kT , and the data in each bin were averaged to obtain a point on the plot, as reported by Duf e and Beckman (1991).
Figure 6. Frequency of occurrence of days with various clearness index by season.
782
K. Ulgen and A. Hepbasli
Figure 7. Variation of monthly average hourly clearness index.
A set of these points was then the basis of the correlation. Applying statistical methods to the measured values, the following equations were derived in linear and polynomial forms, respectively: 8 > :0:30
for kT > 0:32; for 0:32 < kT < 0:62; for kT > 0:62;
8 0:68 > > > T T T > > :0:30
(9)
for kT < 0:32; for 0:32 < kT < 0:62; for kT > 0:62:
(10)
Conclusions The clearness index is among the most signi cant concepts in solar engineering. It gives more information about the atmospheric characteristics of solar stations in addition to the degree of solar energy potential of stations and their surrounding areas (Sahin et al., 2001). The following conclusions may be drawn from the present study: a) Solar radiation parameters (global and diffuse global radiation) were developed in terms of the clearness index in the 2 different polynomial forms for Izmir (38 ° 240 N: 27° 100 E), located in the western part of Turkey.
Clearness Index for Izmir, Turkey
783
b) The minimum and maximum values of the monthly average daily hours of bright sunshine (S) were recorded to be 3.54 and 12.28. c) The values of the monthly average-daily clearness index (KT ) ranged from 0.45 to 0.66 averaged for a 5 year period from 1994 through 1998, with an annual average value of 0.55. d) It was found that the monthly average daily total global solar radiation varies from 5964 kJ/m2 in December to 27154 kJ/m2 in June, while the monthly average daily total diffuse radiation ranges from 2684 kJ/m2 to 10313 kJ/m2 for the same months, respectively. e) The 2 models presented here were found to be suitable and reasonably reliable for estimating or predicting the ratio Id =I and hence monthly average hourly diffuse radiation, Id , in terms of kT in this location and possibly elsewhere with similar climatic conditions.
Nomenclature f Gon Gsc H Ho I Id Io kT KT n nday S So
frequency (%) extraterrestrial radiation (W/m2 ) solar constant (D 1367 W/m2 ) monthly average daily global radiation (kJ/m2 ) monthly average daily extraterrestrial radiation (kJ/m2 ) monthly average hourly global radiation (kJ/m2 ) monthly average hourly diffuse radiation (kJ/m2 ) monthly average hourly extraterrestrial radiation (kJ/m2 ) D I =Io D monthly average hourly clearness index D H =Ho D monthly average daily clearness index total number of observations number of the day of the year starting from the rst of January monthly average daily hours of bright sunshine (h) monthly average of the maximum possible daily hours of bright sunshine (h)
Greek Letters Á ± !
latitude of site (° ) solar declination (° ) mean sunrise hour angle for month (° )
Acknowledgements The authors wish to express their gratutide to Dr. Ibrahim Dincer, Department of Mechanical Engineering (KFUPM), for his valuable comments and suggestions.
References Aksakal, A., and Rehman. 1999. Measured and Estimated Solar Radiation in the Arabian Gulf Coast, Proceedings of the Second Trabzon International Energy and Environment Symposium, I. Dincer and T. Ayhan (eds.). July 26–29, 1998, Karadeniz Technical University, Trabzon, Turkey, Begell House, Inc., pp. 167–170.
784
K. Ulgen and A. Hepbasli
Al-Hinai, H. A., and S. M. Al-Alawi. 1995. Typical solar radiation data for Oman. Appl. Energy 52:153–163. Angström, A. 1924. Solar and terrestrial radiation. Quart. J. Roy Met. Soc. 50:121–125. Dincer, I., S. Dilmac, I. E. Ture, and M. Edin. 1995. A simple technique for estimating solar radiation parameters and its application for Gebze. Energy Convers. Mgmt. 37(2):183– 198. Duf e, J. A., and W. A. Beckman. 1991. Solar Engineering of Thermal Processes. New York: Wiley. Ediger, V. S., and E. Kentel. 1999. Renewable energy potential as an alternative to fossil fuels in Turkey. Energy Convers. Mgmt. 40:743–755. El Aroudam, H., M. El Hammouti, and H. Ezbakhe. 1992. Determination of correlations of solar radiation measured in Tetouan. Renewable Energy 2:473–476. Ertekin, C., and O. Yaldiz. 1999. Estimation of monthly average daily global radiation on horizontal surface for Antalya, Turkey. Renewable Energy 17(1):95–102. Ertekin, C., and O. Yaldiz. 2000. Comparison of some existing models for estimating global solar radiation for Antalya (Turkey). Energy Convers. Mgmt. 41:311–330. Gopinathan, K. K., and A. Soler. 1995. Diffuse radiation models and monthly-average daily, diffuse data for a wide latitude range. Energy 20(7):657–667. Gopinathan, K. K., and A. Soler. 1996. Effect of sunshine and solar declination on the computation of monthly mean daily diffuse solar radiation. Renewable Energy 7(1):89–93. Hassan, A. H. 2001. The variability of the daily solar radiation components over Helwan. Renewable Energy 23:641–649. Kaygusuz, K. 1999. The comparison of measured and calculated solar radiations in Trabzon, Turkey. Energy Sources 21:347–353. Kudish, A. I., and A. Lanetz. 1992. Analysis of the solar radiation data for Beer Sheva, Israil, and its environs. Solar Energy 48:97–106. Mosalam Shalout, M. A., A. H. Hassan, and A. M. Fathy. 2001. Study of the solar radiation over Menia. Renewable Energy 23:621–639. Nfaoui, H., and J. Buret. 1993. Estimation of daily and monthly direct, diffuse and global solar radiation in Rambat (Morocco). Renewable Energy 3(8):923–930. Page, J. K. 1961. The Estimation of Monthly Mean Values of Daily Total Short Wave Radiation on Vertical and Inclined Surface from Sunshine Records for Latitudes 40N-40S, Proceedings of UN Conference on New Sources of Energy 4(598):378–390. Rehman, S., and T. O. Halawani. 1997. Global solar radiation estimation. Renewable Energy 12:369–385. Sahin, A. D., M. Kadioglu, and Z. Sen. 2001. Monthly clearness index values of Turkey by harmonic analysis approach. Energy Convers. Mgmt. 42:933–940. Samuel, T. D. M. A. 1991. Estimation of global radiation for Srilanka. Solar Energy 47(5):333. Sen, Z., and E. Tan. 2001. Simple models of solar radiation data for northwestern part of Turkey. Energy Convers. Mgmt. 42:587–598. Soler, A. 1988. The dependence on solar elevation of the correlation between monthly average hourly diffuse and global radiation. Solar Energy 41:335–340. Srivasta, S. K., O. P. Singh, and G. N. Pandey. 1993. Estimation of global solar radiation in Uttar Pradesh (India) and comparison of some existing correlations. Solar Energy 51:27–29. Tasdemiroglu, E., and R. Sever. 1991a. Estimation of monthly average daily, horizontal diffuse radiation in Turkey. Energy 16(4):787–790. Tasdemiroglu, E., and R. Sever. 1991b. Maps for average bright sunshine hours in Turkey. Energy Convers. Mgmt. 31(6):545–552. Tiris, M., C. Tiris, and I. E. Ture. 1996. Correlations of monthly-average daily global, diffuse and beam radiations with hours of bright sunshine in Gebze, Turkey. Energy Conserv. Mgmt. 37(9):1417–1421. Togrul, I. T., and E. Onat. 1999. A study for estimating solar radiation in Elazig using geographical and meteorological data. Energy Convers. Mgmt. 40:1577–1584.
Clearness Index for Izmir, Turkey
785
TUBITAK-TTGV, Turkish Scienti c and Technologic Research Committee (TUBITAK)-Turkish Technology Development Committee (TTGV). 1998. Energy Technologies Policies Study Group Report, Science-Technology-Industry Discussion Platform, Ankara, Turkey (in Turkish). WEC-TNC, World Energy Council-Turkish National Committee. 2000. Energy Report 1998, Ankara, Turkey (in Turkish). WEC-TNC, World Energy Council-Turkish National Committee. 1997. Energy Report 1995, Ankara, Turkey. Wrixon, G. T., M. E. Rooney, and W. Palz. 1993. Renewable Energy 2000, Berlin, Germany: Springer-Verlag.