Accepted Manuscript Title: Predictive models for thermal diffusivity and specific heat capacity of coals in Huainan mining area, China Authors: Jun Deng, Qing-Wei Li, Yang Xiao, Chi-Min Shu, Yan-Ni Zhang PII: DOI: Reference:
S0040-6031(17)30226-5 http://dx.doi.org/10.1016/j.tca.2017.09.005 TCA 77821
To appear in:
Thermochimica Acta
Received date: Revised date: Accepted date:
14-5-2017 19-8-2017 1-9-2017
Please cite this article as: Jun Deng, Qing-Wei Li, Yang Xiao, Chi-Min Shu, Yan-Ni Zhang, Predictive models for thermal diffusivity and specific heat capacity of coals in Huainan mining area, China, Thermochimica Actahttp://dx.doi.org/10.1016/j.tca.2017.09.005 This is a PDF file of an unedited manuscript that has been accepted for publication. As a service to our customers we are providing this early version of the manuscript. The manuscript will undergo copyediting, typesetting, and review of the resulting proof before it is published in its final form. Please note that during the production process errors may be discovered which could affect the content, and all legal disclaimers that apply to the journal pertain.
1 2
Predictive models for thermal diffusivity and specific heat capacity of coals in
3
Huainan mining area, China
4
Jun Denga, b, Qing-Wei Lia, Yang Xiaoa, b, , Chi-Min Shuc, Yan-Ni Zhanga,b
5
a School of Safety Science and Engineering, Xi’an University of Science and Technology, No. 58, Yanta Mid. Rd., Xi’an, Shaanxi
6
710054, PR China.
7
b Shaanxi Key Laboratory of Prevention and Control of Coal Fire, No. 58, Yanta Mid. Rd., Xi’an, Shaanxi 710054, PR China.
8
c Graduate School of Engineering Science and Technology, National Yunlin University of Science and Technology, 123, University
9
Rd., Sec. 3, Douliou, Yunlin 64002, Taiwan, ROC
10
HIGHLIGHT
11
Linear correlation of coal’s thermal properties vs. their initial values was found.
12
Variations of coal’s thermal properties vs. temperature were studied and predicted.
13
A modeling method for thermal properties of coal vs. temperature was introduced.
14
Feasibility of the modeling method was analyzed by coals in different areas.
15 16 17
Abstract: Thermal properties of coal govern the thermal transfer in coal mass. Taking coal samples from Huainan
18
mining area as the objects, thermophysical parameters (thermal diffusivity, specific heat capacity, and thermal
19
conductivity) were measured from 30 to 300 °C by LFA457 laser-flash apparatus. Predictive models for thermal
20
diffusivity and specific heat capacity were then established. The results indicate that the thermal diffusivity of coal
21
samples in Huainan mining area decreases with increased temperature, whereas specific heat capacity and thermal
22
conductivity rise. The predictive models could accurately forecast the values and variations of thermophysical
23
parameters for coal samples in Huainan mining area below 300 °C. Furthermore, the modeling method is suitable
24
for the establishment of models for coal samples in other areas. These will be beneficial for the understanding of
25
thermal transfer in coal mass and shorten the testing time in the laboratory.
26
Keywords: Thermophysical parameters; Temperature; Predictive models; Flash method
27 28
Corresponding author at: School of Safety Science and Engineering, Xi’an University of Science and Technology, No. 58, Yanta Mid. Rd., Xi’an, Shaanxi 710054, PR China. E-mail address:
[email protected] (Y. Xiao).
1
1
1.
Introduction
2
China is one of the major coal-producing countries [1], and coal plays an important role in the energy
3
consumption structure. Since the 1990s, the ratio of coal consumption to total energy consumption has been
4
within the range of 65% to 75% in China, and although the share of coal in energy mix has decreased in recent
5
years, the consumption of coal will still increase through 2020 [2, 3]. Pyrolysis of coal is an important process
6
involved in gasification, liquefaction, and oxidation of coal. Characteristics of coal pyrolysis have been researched,
7
such as the apparent activation [4], coke formation [5], and release of volatiles [6]. Thermophysical parameters
8
(including thermal diffusivity, specific heat capacity, and thermal conductivity) govern the thermal transfer in coal
9
mass. For instance, thermal diffusivity indicates the ability of heat diffusion, whereas the specific heat capacity
10
presents the potential to hold energy when the coal is heated. Moreover, the thermophysical parameters are
11
involved in some mathematical models, such as the calculating model for heat intensity during spontaneous
12
combustion of coal [7]. In recent years, the temperature of surrounding rocks increases as the depth of mining
13
extends. Then, the coal seams are located in a relatively high temperature environment. Therefore, the
14
thermophysical parameters of coals have attracted the attention of researchers. Wen et al. [8, 9] found that the
15
thermal diffusivity of coal was lower at higher temperature, while the specific heat capacity and thermal
16
conductivity were greater. Deng et al. [10] found that specific heat capacity had the highest sensitivity to
17
temperature, and the sensitivity of thermal conductivity to temperature is the lowest in nitrogen atmosphere.
18
Zhumagulov [11] analyzed the correlation of thermal conductivity and specific heat capacity to temperature.
19
However, as complex porous materials, the thermophysical property of coal is influenced by many factors.
20
Cremers [12] investigated the thermal diffusivity of powdered coal with two different particle sizes and
21
considered that particle size of coal had a slight impact on thermal diffusivity. Melchior et al. [13] found that the
22
specific heat capacity is related to the chemical composition and structure of coal. Meanwhile, Callanan et al. [14]
23
tested the specific heat capacity of coal under various atmospheres and the specific heat capacity presented
24
different behaviors.
25
Many researchers have also paid attention to the thermal properties of rocks. Vosteen et al. [15] reported that
26
below 300 °C, the thermal diffusivity and thermal conductivity of rocks decreased by increasing temperature
27
while the specific heat capacity increased. Abdulagatova et al. [16] considered pressure as another factor that
28
influences the thermal conductivity, and the thermal conductivity of sandstone increased with the increase of
29
pressure. Miao et al. [17] increased the temperature from room temperature to 900 °C and found the variations of
30
thermal properties of rocks are similar to these by Vosteen et al. [15] and Abdulagatova et al. [16]. Goto et al. [18]
31
estimated the thermal properties of sediments in the eastern flank of the Juan de Fuca Ridge, and the results 2
1
indicate that lithology and porosity had a strong influence on the thermal properties of sediments. Tanikawa et al.
2
[19] found that the thermal conductivity is higher than that of coal, and also, the thermal conductivity of deep
3
sediments increases with the depth due to the porosity reduction.
4
The flash method, developed by Paker et al. [20], is an effective means to measure the thermophysical
5
parameters for most materials. Based on contact-free style, it has many advantages compared to traditional contact
6
method, including avoiding thermal contact resistance, shortening the testing time, high measuring accuracy, and
7
wide testing range for thermophysical parameters [21]. In this study, taking the coal samples in Huainan mining
8
area as the objects, the thermal diffusivity and specific heat capacity were measured from 30 to 300 °C by flash
9
method. Most previous studies are focused on the temperature dependence of thermophysical parameters for coal
10
samples. Although many equations have been found to fit the correlation between thermophysical parameters and
11
temperature, there has been no model with universal applicability due to the complexity of coal’s structure. The
12
purposes of this study were to: (1) investigate the thermal properties of coal samples in Huainan mining area; (2)
13
analyze the temperature dependence of thermal properties for coal samples in Huainan mining area; and (3)
14
establish predictive models to forecast the thermal properties of coal samples in Huainan mining area. This study
15
provides an insight into thermal transfer in coal mass and is helpful for the establishment of predictive models for
16
other coals.
17
2.
18
2.1.
Samples and experimental procedures Coal samples
19
Huainan mining area is located in the central and northern parts of Anhui province, China. The distribution of
20
Huainan mining area is nearly eastward and the geological condition is eastward plunging syncline structure. The
21
activity of magma is poor. Most coal-bearing areas are directly covered by Neogene and Quaternary. Coal seams
22
in Huainan mining area belong to permo-carboniferous system and formed in the land surface, the shore, the delta,
23
and the composite sedimentary system. In this study, six coal samples were collected from Gubei, Panbei, Pansan,
24
Xieqiao, Panyi, and Xinzhuangzi coal mines in Huainan mining area. The ultimate and proximate analyses are
25
shown in Table 1. The ultimate analysis is based on dry-ash-free (daf.) basis, while the proximate is based on
26
air-dried (ad.) basis.
27 28
Table 1 2.2.
Experimental details
29
Laser-flash apparatus LFA457 (Netzsch GmbH, Selb, Germany) was adopted to measure the thermal
30
properties of coal samples. By flash method, the instrument can test the thermophysical parameters of most
31
materials below 1000 °C. As shown in ref. [10], it mainly consists of a furnace, infrared detector, and laser 3
1
generator. Before experiments were conducted, the coal samples were prepared into tablets. The tablet diameter
2
was
3
the heat loss during transfer [10]. Thermal property measurements were conducted from 30 °C up to 300 °C
4
because the variation of porosity for coal was not obvious until 300 °C, but at high temperature above 300 °C, the
5
porosity increased rapidly due to thermal fracture damage [22]. The thermal fracturing probably caused the
6
reduction of the density for coal tablet, which resulted in the overestimation of thermal conductivity. Furthermore,
7
the tablet may break down due to thermal fracture damage. Then, the coal samples were heated from 30 to 300 °C
8
at 1 °C/min heating rate. During the experiments, nitrogen was supplied into furnace at constant 100 mL/min.
12.7 mm to meet the requirement of the sample holder, and the thickness was small to
1 mm for reducing
9
When testing, the laser generator will irradiate a laser pulse on the underside of the coal sample and its
10
temperature will increase. The infrared detector collects the variation of temperature on the upside of the coal
11
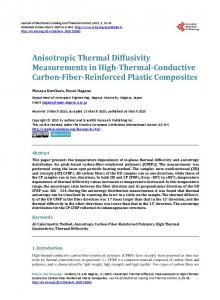
sample [21]. The detector signal is shown in Fig. 1.
12
Fig. 1.
13
The thermal diffusivity and specific heat capacity can be obtained by Eqs. (1) [20] and (2) [10].
14
D
l2 t1 2
(1)
15
where D is the thermal diffusivity, mm2/s; α is constant, 0.13878; l is the thickness of tested sample, mm; t1/2 is the
16
moment when the temperature rise is half of the maximum, s.
ΔU std mstd c cstd ΔU m
17
(2)
18
where c and cstd are the specific heat capacity of tested sample and standard sample, J/(g K); U and Ustd are the
19
difference of detector signal for tested sample and standard sample, V; m and mstd are the mass of tested sample
20
and standard sample, g.
21 22
After the thermal diffusivity and specific heat capacity were obtained, the thermal conductivity at different temperature was calculated by Eq. (3).
λ ρc D
23
(3)
24
where is the thermal conductivity, W/(m K); ρ is the density of coal and considered as constant by ignoring
25
thermal expansion, g/cm3.
26
3.
27 28
Variations of thermophysical parameters From 30 to 300 °C, the thermal diffusivity, specific heat capacity, and thermal conductivity for the six coal
samples in Huainan mining area are described in Figs. 2 to 4. 4
1
3.1.
Thermal diffusivity
2
Fig. 2.
3
Fig. 2 indicates that the thermal diffusivity of coal samples from Huainan mining area presents a decreasing
4
tendency with elevated temperature. This agreed well with the reports about the thermal diffusivity of coal and
5
rocks [8, 9, 15, 17, 23, 24]. The most accepted mechanism is that with the augmented temperature, the number of
6
phonons increases and the phonon vibration increases, leading to the decrease in the mean free path of
7
phonon-phonon [25]. Thermal diffusivity is related to the mean free path of phonon-phonon. Shorter mean free
8
path of phonon-phonon results in lower thermal diffusivity [26]. As the temperature continually rises, the number
9
of phonons tends to be saturated [27, 28]. The growth of temperature cannot cause a significant decrease in
10
thermal diffusivity and the thermal diffusivity tends to be gentle.
11
3.2.
Specific heat capacity
12
Fig. 3.
13
The specific heat capacity of coal samples in Huainan mining area increases by increasing temperature from
14
30 to 300 °C (Fig. 3). The studies of Wen et al. [8, 9] and Stanger et al. [29] presented a similar tendency. Specific
15
heat capacity is a parameter that characterizes the thermal storage capacity of materials. Greater specific heat
16
capacity indicates greater thermal storage capacity. Maloney et al. [30] presented that energy is stored by the
17
excitation of vibrational modes of freedom in the material structures. Therefore, the increasing specific heat
18
capacity for coal samples with augmented temperature is considered to be associated with the vibration of phonon.
19
The thermal energy absorbed by coal is stored in the form of a phonon’s kinetic energy. As the temperature rises,
20
the total kinetic energy of phonon vibration increases due to the increasing number of phonons and the
21
strengthening vibration of phonon. Therefore, more thermal energy is held by coal and the specific heat capacity
22
increases.
23
3.3.
Thermal conductivity.
24
Fig. 4.
25
Fig. 4 shows that the thermal conductivity of coal samples in Huainan mining area increased with the
26
augmented temperature. Wen et al. [8, 9] and Stanger et al. [29] found a similar tendency for the thermal
27
conductivity of coal with temperature. Observed from Eq. (3), thermal conductivity is mainly associated with
28
thermal diffusivity and specific heat capacity when ignoring the variation of density. Thermal conductivity will
29
decrease with the decrease of thermal diffusivity but increase with the increase specific heat capacity. Therefore,
30
the differences between thermal diffusivity (specific heat capacity) and the value at 30 °C were firstly calculated.
31
Then, ratio of the absolute value of the difference to the value at 30 °C was analyzed to characterize the 5
1
temperature sensitivity of thermal diffusivity and specific heat capacity, as shown in Fig. 5.
2
Fig. 5.
3
It indicates that the variation of specific heat capacity for coal samples in Huainan mining area is more
4
obvious than that of thermal diffusivity. Although the thermal diffusivity of coal samples decreased with the
5
growth temperature, the specific heat capacity rose. The decrease of thermal conductivity caused by thermal
6
diffusivity was eliminated and turned to increase with the increase of temperature. This is quite different from that
7
of most rocks, such as reported by Vosteen et al. [15], Abdulagatova et al. [16], and Miao et al. [17], who found
8
that the thermal conductivity of rocks decreased with the increase of temperature below 300 °C. The possible
9
reasons may be that there are more impurities contained in rocks, and irregularities in the lattice of atomic
10
dimensions enhance the scattering during thermal transfer [31]. However, Birch et al. [31, 32] also found that the
11
thermal conductivity of certain rocks, such as feldspars, increases with the increase of temperature, and the
12
exceptional behavior was ascribed to fine-scale imperfections. Nevertheless, compared to that of most rocks, the
13
scattering during thermal transfer in coal mass is weaker and mainly determined by the reduction of mean free
14
path. Meanwhile, the upward of specific heat capacity will counterbalance the downward of thermal diffusivity.
15
4.
16
4.1.
Predictive models for thermal diffusivity and specific heat capacity Temperature dependences of thermal diffusivity and specific heat capacity
17
According to the fact that the thermal diffusivity of coal samples in Huainan mining area decreased by 37.1
18
to 39.1% by increasing the temperature from 30 to 300 °C while the specific heat capacity increased by 79.1 to
19
91.4%, temperature is considered an important factor that influences the thermophysical parameters. To establish a
20
model for predicting thermal diffusivity and specific heat capacity at different temperatures, the temperature
21
dependences of thermal diffusivity and specific heat capacity for coal samples in Huainan mining area were first
22
investigated. As previous analysis, the thermal diffusivity of coal decreases with the increase of temperature.
23
Furthermore, for most solid materials, the thermal diffusivity asymptotically approaches constant when the
24
temperature is high enough [21]. Then, the relationship between thermal diffusivity and temperature was fitted by
25
Eq. (4). Eq. (5) was used to fit the temperature dependence of specific heat capacity. The fitting results are
26
tabulated in Table 2. The higher fitting degree in Table 2 indicates that Eqs. (4) and (5) can be used to describe the
27
temperature dependences of thermal diffusivity and specific heat capacity.
28
D f 0 f1T 1 f 2T 2
(4)
29
c p qT
(5)
30
where f0, f1, f2, p and q are fitting parameters; T is the temperature of coal mass, °C. 6
1 2
Table 2 4.2.
Introduction of the values at 30 °C
3
Figs. 2 and 3 graph that the thermal diffusivity and specific heat capacity are quite different for different coal
4
samples in Huainan mining area. By grey correlation theory, the correlation between thermophysical parameters at
5
30 °C and elements, as well as moisture, ash, volatile, and fixed carbon, was analyzed.
6
To analyze the experimental data by grey correlation theory [33, 34], linear normalization of the
7
experimental data for elements, moisture, ash, volatile, and fixed carbon, was performed as well as thermal
8
diffusivity and specific heat capacity at 30 °C. The normalized method was expressed as Eq. (6).
9
yi j
xi ( j )
(6)
n
y ( j) i
i 1
n 10
where y i ( j ) and x i ( j ) are the jth factor for the ith coal sample and the corresponding normalized result,
11
respectively; n is the number of coal samples.
12 13
Then, the grey relational coefficient and grey relational grade can be obtained by Eqs. (7) and (8), respectively.
min min x0 ( j ) xi ( j ) ε max max x 0 ( j ) xi ( j ) 14
i
ζ i ( j)
j
i
j
(7)
x 0 ( j ) x i ( j ) ε max max x0 ( j ) xi ( j ) i
j
n
ζ ( j) i
15
γ( j )
i 1
(8)
n
16
where ζ i ( j ) is the grey relational coefficient for the jth factor of the ith coal sample; x0 ( j ) is the ideal
17
normalized result for the jth factor;
18
γ( j) is the grey relational grade for the jth factor. The results of grey relational coefficient and grey relational
19
grade are presented in Table 3, where D30 and c30 stand for the thermal diffusivity and specific heat capacity at
20
30 °C, respectively.
ε is the distinguishing coefficient and in the range of 0 to 1, taking 0.5;
21
Table 3
22
Table 3 indicates that C, H, O, N, and S, as well as moisture, ash, volatile, and fixed carbon, have different
23
degree correlation with thermal diffusivity and specific heat capacity. Forecasting the thermal diffusivity and
24
specific heat capacity of coal samples in Huainan mining area by ultimate and proximate analyses is difficult. Zhu 7
1
et al. [35] and Larkin et al. [36] found that propagons associated with phonons and diffusons associated with
2
disorder are two types of mechanism that contributes to the thermal transfers in solid materials. Therefore, it is
3
inferred that not only the compositions but also the existential forms have an impact on thermophysical
4
parameters. For instance, if the elements are obtained in microcrystalline structure of coal, they will contribute to
5
the thermal transfer in coal mass by phonon vibration, and the elements will be beneficial for the thermal transfer
6
by harmonic coupling with other modes if they belong to the disordered structure in coal.
7
To overcome the complex influencing factors, the thermal diffusivity and specific heat capacity at 30 °C
8
were introduced. Fig. 6 illustrates the relationship between thermophysical parameters at 30 °C and the values at
9
different temperatures. Meanwhile, the average reduction rate of thermal diffusivity within the range of 30 to
10
300 °C, as well as the average generation rate of specific heat capacity, is drawn in Fig. 7.
11
Fig. 6.
12
Fig. 7.
13
Figs. 6 and 7 indicate that the thermal diffusivity and its reduction rate, as well as the specific heat capacity
14
and its average generation rate, increase with the increase in the value at 30 °C. Then, the data were linearly fitted.
15
Basically, a linear relationship exists. The linear equations are listed in Tables 4 and 5.
16
Table 4
17
Table 5
18
4.3.
Establishment of predictive models
19
Based on the analysis in sections 4.1 and 4.2, for the thermophysical parameters of coal samples in Huainan
20
mining area, a polynomial relationship exists between thermal diffusivity and temperature, while the specific heat
21
capacity presents a linear correlation with temperature. Furthermore, thermal diffusivity and specific heat capacity
22
are basically proportional to the values at 30 °C. To establish a simpler model, the predictive model for thermal
23
diffusivity is expressed as Eq. (9) while the predictive model for specific heat capacity is described as Eq. (10).
24
D k D30 T n
(9)
25
c c30 (a b T )
(10)
26 27
where a, b, k and n are the parameters. For easier calculating of the parameters, Eqs. (9) and (10) are converted into Eqs. (11) and (12).
28
D D30 k T n
(11)
29
c c30 a b T
(12)
8
1
The relationship between D/D30 (c/c30) and T is illustrated in Fig. 8. Then, the parameters were obtained by
2
fitting the data by Eqs. (11) and (12). The predictive models are described as D=2.06896·D30·T—0.20791
3
(R2=0.97923) and c=c30·(0.92198+0.00327·T) (R2=0.98978).
4 5
Fig. 8. 4.4.
Feasibility of the predictive models
6
To verify the applicability of the predictive models, thermal diffusivity and specific heat capacity of the six
7
coal samples in Huainan mining area and four coal samples from other areas were forecasted and the predictive
8
data was compared with the experimental data.
9
4.4.1.
10 11
Coal samples in Huainan mining area
The predictive data and experimental data of thermal diffusivity and specific heat capacity for the coal samples in Huainan mining area are illustrated in Fig. 9.
12
Fig. 9.
13
Fig. 9 indicates that the predictive data of thermal diffusivity and specific heat capacity for the coal samples
14
in Huainan mining area are close to experimental data. Meanwhile, the tendency of predictive thermal diffusivity
15
and specific heat capacity with temperature is similar to that of tested data. Taking all six coal samples in Huainan
16
mining area into account, the maximums of relative errors for thermal diffusivity and specific heat capacity are
17
5.15% (GB coal sample at 90 °C) and 6.30% (GB coal sample at 300 °C), respectively. Moreover, the rest is less
18
than 5%. Furthermore, the thermal conductivities calculated by the predictive values of thermal diffusivity and
19
specific heat capacity present a similar tendency to that of experimental values and are close to experimental
20
values. The maximum of relative errors for thermal conductivity was 6.80% (GB coal sample at 300 °C). It
21
indicates that the predictive models could be used to forecast the thermal diffusivity and specific heat capacity of
22
coal samples in Huainan mining area. And the thermal conductivity calculated by predictive values shows
23
agreement with experimental values.
24
4.4.2.
Coal samples in other areas
25
Here, four coal samples from different areas in China were used to check the application of the models to the
26
prediction of thermal properties of other coal samples. Also, the thermophysical parameters of the four coal
27
samples were measured by LFA457 laser-flash apparatus and the conditions are the same as that of coal samples
28
in Huainan mining area. The proximate analyses of the four coal samples are shown in Table 6.
29
Table 6
30
Based on Eqs. (11) and (12), the relationship between D/D30 (c/c30) and T for the four coal samples is shown
31
in Fig. 10 and Table 7, indicating that the variation of D/D30 and c/c30 vs. temperature could also be described by 9
1
Eqs. (11) and (12), and the modeling method is suitable for the establishment of predictive models for coal
2
samples in other areas.
3
Fig. 10.
4
Table 7
5
It can be seen from Table 7 that for the four coal samples, parameter k ranges from 1.84169 to 2.19448, n
6
ranges from 0.17731 to 0.2202, a ranges from 0.89356 to 0.93292, and b ranges from 0.00303 to 0.00349. Also,
7
the parameters determined by coal samples in Huainan mining area are within these ranges. Then, the predictive
8
models determined by coal samples in Huainan mining area were used to predict the values for the four coal
9
samples in other areas. The results were compared to experimental values, as shown in Fig. 11.
10
Fig. 11.
11
Fig. 11 indicates that the variation of thermal properties for coal samples in different areas is similar. Namely,
12
thermal diffusivity decreases with the increase of temperature whereas the specific heat capacity and thermal
13
conductivity increase. Meanwhile, for the inversion data by the models determined by coals in Huainan mining
14
area, the maximums of relative error for thermal diffusivity, specific heat capacity, and thermal conductivity are
15
6.15% (JG coal sample at 150 °C), 6.12% (CM coal sample at 240 °C) and 11.22% (JG coal sample at 150 °C),
16
respectively. This indicates that the thermal diffusivity and specific heat capacity of coal samples in other areas
17
could be predicted by the models determined by coal samples in Huainan mining area. However, the predictive
18
values of thermal conductivity presented great deviation from experimental values. Nevertheless, the tendency of
19
thermal property for coal samples in other areas could be predicted.
20
4.5.
Extension of predictive models
21
The results in Fig. 6 indicate a linear relationship between D and D30. Therefore, the relationship between D
22
and Di (thermal diffusivity when temperature is i) must be linear. Similarly, there must a similar law for the
23
relationship between c and ci (thermal diffusivity when temperature is i). It is inferred that the predictive models
24
could be extended to predict the thermal diffusivity and specific heat capacity by the values at different
25
temperatures. Based on the modeling method above, the models for coal samples in Huainan mining area are
26
described in Table 8.
27
Table 8
28
Table 8 shows that the predictive models for thermal diffusivity and specific heat capacity could be
29
established by the known values at different temperatures though the parameters in the models are different. It can
30
be seen that k, a, and b decrease with the increase of temperature, whereas n presents a discrete distribution. The k,
31
a, and b at different temperatures are illustrated in Fig. 12. The relationship is fitted by quadratic polynomial, as 10
1
given in Table 9.
2
Fig. 12.
3
Table 9
4
The higher fitting degree in Table 9 indicates k, a, and b at different temperatures could be forecasted by
5
quadratic polynomials when the temperature is below 300 °C. Different from the variations of k, a, and b, n
6
presents a discrete distribution. However, the variation of n is small and in the range of 0.2079 to 0.20796, which
7
has a little influence on the predictive values. Therefore, it is considered that the parameters in the predictive
8
models could be changed case by case and the thermal property could be predicted by known values when the
9
temperature is lower than 300 °C. This avoids the limitation for the prediction of thermal property only using the
10
values at 30 °C.
11
5.
Conclusions
12
Thermophysical parameters of coal are important and impact the thermal transfer in coal mass. By laser flash
13
method, the thermal diffusivity, specific heat capacity, and thermal conductivity of coal samples in Huainan
14
mining area were measured from 30 to 300 °C. Predictive models were established. Conclusions are detailed as
15
follows:
16
The thermal diffusivity of coal samples in Huainan mining area decreased with the increase of temperature.
17
This is mainly related to phonon vibration. The vibration of thermal diffusivity indicates that thermal diffusion in
18
coal mass becomes more difficult when the temperature is higher, and longer time is required to reach a stable
19
temperature field. The specific heat capacity of coal samples in Huainan mining area increased with elevated
20
temperature, indicating that more energy was needed for temperature rise of coal mass. The reason for this
21
phenomenon is that phonon vibration is strengthened with increasing temperature and the total kinetic energy of
22
phonons increases. More thermal energy is held in coal mass. The thermal conductivity of coal samples in
23
Huainan mining area rose with the augmented temperature. This was determined by both thermal diffusivity and
24
specific heat capacity.
25
The predictive models for thermal diffusivity and specific heat capacity of coal samples in Huainan mining
26
area were established. The models can be used to forecast the thermophysical parameters of coal samples in
27
Huainan mining area below 300 °C. Moreover, the variation of thermophysical parameters for coal samples in
28
other areas can be predicted. Nevertheless, the modeling method is suitable for the establishment of predictive
29
models for coal samples in different areas.
30 31
Acknowledgments 11
1
The authors gratefully acknowledge Dr. Frank Oreovicz (Retired) at Purdue University (West Lafayette,
2
Indiana, USA), who helped us to improve the manuscript. This work was supported by the National Natural
3
Science Foundation of China (No. 5120-4136 and No. 5167-4191), the China Postdoctoral Science Foundation
4
(No. 2016-M-590963), and the Industrial Science and Technology Project of Shaanxi Province, China (No.
5
2016-GY-192).
12
1
References
2
[1] G.B. Stracher, T.P. Taylor, Coal fires burning out of control around the world: thermodynamic recipe for
3 4 5 6 7
environmental catastrophe, International Journal of Coal Geology 59 (2004) 7–17. [2] Y. Hao, Y. Liu, J.H. Weng, Y. Gao, Does the Environmental Kuznets Curve for coal consumption in China exist? New evidence from spatial econometric analysis, Energy 114 (2016) 1214–1223. [3] Y. Hao, Z.Y. Zhang, H. Liao, Y.M. Wei, China’s farewell to coal: A forecast of coal consumption through 2020, Energy Policy 86 (2015) 444–455.
8
[4] K.V. Slyusarskiy, K.B. Larionov, V.I. Osipov, S.A. Yankovsky, V.E. Gubin, A.A. Gromov, Non-isothermal
9
kinetic study of bituminous coal and lignite conversion in air and in argon/air mixtures, Fuel 191 (2017) 383–
10 11 12 13 14 15 16 17 18 19 20 21 22 23 24
392. [5] J. Wu, Q. Liu, R. Wang,W. He, L. Shi, X. Guo, Z. Chen, L. Ji, Z. Liu, Coke formation during thermal reaction of tar from pyrolysis of a subbituminous coal, Fuel Processing Technology 155 (2017) 68–73. [6] Y. Gu, J. Yperman, G. Reggers, R. Carleer, J. Vandewijngaarden, Characterisation of volatile organic sulphur compounds release during coal pyrolysis in inert, hydrogen and CO2 atmosphere, Fuel 184 (2016) 304–313. [7] J. Deng, Y. Xiao, Q. Li, J. Lu, H. Wen, Experimental studies of spontaneous combustion and anaerobic cooling of coal, Fuel 157 (2015) 261–269. [8] H. Wen, J.H. Lu, Y. Xiao, J. Deng, Temperature dependence of thermal conductivity, diffusion and specific heat capacity for coal and rocks from coalfield, Thermochimica Acta 619 (2015) 41–47. [9] H. Wen, J.H. Lu, Y. Xiao, J. Deng, Thermogravimetric and thermal properties analysis of coal from coalfield fire area, International Journal of Oil Gas and Coal Technology 13 (2016) 60–72. [10] J. Deng, Q.W. Li, Y. Xiao, C.M. Shu, Experimental study on the thermal properties of coal during pyrolysis, oxidation, and re-oxidation. Applied Thermal Engineering 110 (2017) 1137–1152. [11] M.G. Zhumagulov, Experimental study of thermophysical properties of Shubarkol coal, Chemistry and Technology of Fuels and Oils 49 (2013) 100–107.
25
[12] C.J. Cremers, Effective thermal diffusivity of powdered coal, Thermal Conductivity 18 (1985) 699–707.
26
[13] E. Melchior, H. Luther, Measurement of true specific heats of bituminous coals of different rank, and of a
27 28 29 30 31
high-temperature coke, in the temperature range 30–350 °C, Fuel 61 (1982) 1071–1079. [14] J.E. Callanan, S.A. Sullivan, R.A. MacDonald, Experimental determination and modeling of the heat capacity of coal in various atmospheres, International Journal of Thermophysics 8 (1987) 133–145. [15] H.D. Vosteen, R. Schellschmidt, Influence of temperature on thermal conductivity, thermal capacity and thermal diffusivity for different types of rock, Physics and Chemistry of the Earth 28 (2003) 499–509. 13
1
[16] Z. Abdulagatova, I.M. Abdulagatov, V.N. Emirov, Effect of temperature and pressure on the thermal
2
conductivity of sandstone, International Journal of Rock Mechanics and Mining Sciences 46 (2009) 1055–
3
1071.
4
[17] S. Q. Miao, H. P. Li, G. Chen, Temperature dependence of thermal diffusivity, specific heat capacity, and
5
thermal conductivity for several types of rocks, Journal of Thermal Analysis and Calorimetry 115 (2014)
6
1057–1063
7 8
[18] S. Goto, O. Matsubayashi, Inversion of needle-probe data for sediment thermal properties of the eastern flank of the Juan de Fuca Ridge, Journal of Geophysical Research: Solid Earth, 113 (2008) B08105.
9
[19] W. Tanikawa, O. Tadai, S. Morita, W. Lin, Y. Yamada, Y. Sanada, K. Moe, Y. Kubo, F. Inagaki, Thermal
10
properties and thermal structure in the deep-water coalbed basin off the Shimokita Peninsula, Japan. Marine
11
and Petroleum Geology, 73 (2016) 445–461.
12 13
[20] W.J. Parker, R.J. Jenkins, C.P. Butler, G.L. Abbott, Flash method of determining thermal diffusivity, heat capacity, and thermal conductivity, Journal of Applied Physics 32 (1961) 1679–1684.
14
[21] I.M. Abdulagatov, Z.Z. Abdulagatova, S.N. Kallaev, A.G. Bakmaev, P.G. Ranjith, Thermal-diffusivity and
15
heat-capacity measurements of sandstone at high temperatures using laser flash and DSC methods,
16
International Journal of Thermophysics 36 (2015) 658–691.
17
[22] Y. Xiao, J.H. Lu, C.P. Wang, J. Deng, Experimental study of high-temperature fracture propagation in
18
anthracite and destruction of mudstone from coalfield using high-resolution microfocus X-ray computed
19
tomography, Rock Mechanics and Rock Engineering 49 (2016) 3723–3734.
20 21 22 23 24 25 26 27 28 29 30 31
[23] D. Gosset, O. Guillois, R. Papoular, Thermal diffusivity of compacted coal powders, Carbon 34 (1996) 369– 373. [24] W.B. Fu, B.L. Zhang, Experimental determination of the equivalent mass diffusivity for a porous coal-ash particle, Combustion and Flame 101 (1995) 371–377. [25] J.M. Branlund, A.M. Hofmeister, Thermal diffusivity of quartz to 1000°C: effects of impurities and the α-β phase transition. Physics and Chemistry of Minerals 34 (2007) 581–595. [26] M.S. Mostafa, N. Afify, A. Gaber, E.F.A. Zaid, Investigation of thermal properties of some basalt samples in Egypt, Journal of Thermal Analysis and Calorimetry 75 (2004) 179–188. [27] A.M. Hofmeister, Thermal diffusivity of garnets at high temperature, Physics and Chemistry of Minerals 33 (2006) 45–62. [28] A.M. Hofmeister, Mantle values of thermal conductivity and the geotherm from phonon lifetimes, Science 283 (1999) 1699–1706. 14
1
[29] R. Stanger, W. Xie, T. Wall, J. Lucas, M. Mahoney, Dynamic measurement of coal thermal properties and
2
elemental composition of volatile matter during coal pyrolysis, Journal of Materials Research and
3
Technology 3 (2014) 2–8.
4
[30] D.J. Maloney, R. Sampath, J.W. Zondlo, Heat capacity and thermal conductivity considerations for coal
5 6
particles during the early stages of rapid heating, Combustion and Flame 116 (1999) 94–104. [31] F. Birch, H. Clark, The thermal conductivity of rocks and its dependence upon temperature and composition:
7 8
Part
, American Journal of Science 238 (1940) 613–635.
[32] F. Birch, H. Clark, the thermal conductivity of rocks and its dependence upon temperature and composition:
9
Part
, American Journal of Science 238 (1940) 529–558.
10
[33] J.L. Lin, C.L. Lin, The use of the orthogonal array with grey relational analysis to optimize the electrical
11
discharge machining process with multiple performance characteristics, International Journal of Machine
12
Tools and Manufacture 42 (2002) 237–244.
13
[34] K.T. Chiang, F.P. Chang, Optimization of the WEDM process of particle-reinforced material with multiple
14
performance characteristics using grey relational analysis, Journal of Materials Processing Technology 180
15
(2006) 96–101.
16
[35] T. Zhu, E. Ertekin, Phonons, localization, and thermal conductivity of diamond nanothreads and amorphous
17 18
graphene, Nano Letters. 16 (2016) 4763–4772. [36] J.M. Larkin, A.J.H. McGaughey, Thermal conductivity accumulation in amorphous silica and amorphous
19
silicon, Physical Review B 89 (2014) 144303, http://dx.doi.org/10.1103/PhysRevB.89.144303.
20 21 8
Detector signal
Detector signal (V)
6
half of the maximum t1/2
4
2
half of the maximum
0
-4000
22
-2000
0
2000
4000
6000
8000
Time (ms)
23
Fig. 1.
24
flashing the sample; when the time is less than zero, the line is the detector signal used to determine the stability
Detector signal when flashing (note: when the time is more than zero, the line is the detector signal after
15
1
of baseline).
2
16
Thermal diffusivity (mm2/s)
0.16
GB
PB
PS
PY
XQ
XZZ
0.14
0.12
0.10
0.08
0.06 0
1 2
50
100
150
200
250
300
Temperature (°C)
Fig. 2. Thermal diffusivities at different temperatures for the six coal samples in Huainan mining area.
3
17
Specific heat capacity (J/(g K))
2.1
1.8
GB
PB
PS
PY
XQ
XZZ
1.5
1.2
0.9 0
100
150
200
250
300
Temperature (°C)
1 2
50
Fig. 3.
Specific heat capacities at different temperatures for the six coal samples in Huainan mining area.
3
18
Thermal conductivity (W/(m K))
0.22
GB
PB
PS
PY
XQ
XZZ
0.20
0.18
0.16
0.14
0.12 0
1 2
50
100
150
200
250
300
Temperature ( )
Fig. 4. Thermal conductivities at different temperatures for the six coal samples in Huainan mining area.
3
19
100
Thermal diffusivity GB PY
80
PB XQ
PS XZZ
Specific heat capacity GB PY
Ratio (%)
60
PB XQ
PS XZZ
40
20
0 50
100
150
200
250
300
Temperature ( )
1 2
Fig. 5.
3
Huainan mining area.
Temperature sensitivity of thermal diffusivity and specific heat capacity for the six coal samples in
20
Thermal diffusivity (mm2/s)
90 180 270
120 210 300
60 180 300
2.1
Specific heat capacity (J/(g K))
60 150 240
0.14
0.12
0.10
0.08
90 210
120 240
150 270
1.8
1.5
1.2
0.9
0.11
0.12
0.13
0.14
0.15
1
Thermal diffusivity at 30 °C (mm2/s)
2
(a) Thermal diffusivity
3
Fig. 6.
0.16
0.90
0.92
0.94
0.96
0.98
1.00
Specific heat capacity at 30 °C (J/(g K))
(b) Specific heat capacity
Thermal diffusivity and specific heat capacity vs. the value at 30 °C.
4
21
1.02
-0.00014
Average generation rate (J/(g K ))
-0.00016
2
Average reduction rate (mm2/(s K))
0.0036
-0.00018
-0.00020
-0.00022
-0.00024 0.11
1
0.13
0.14
Thermal diffusivity at 30
2 3
0.12
0.15
0.0030
0.0027
0.0024 0.90
0.16
2
(mm /s)
0.92
0.94
0.96
0.98
Specific heat capacity at 30
(a) Average reduction rate of D vs. D30 Fig. 7.
0.0033
1.00
(J/(g K))
(b) Average generation rate of c vs. c30
Average change rates of thermal diffusivity and specific heat capacity vs. the value at 30 °C.
4
22
1.02
2.0
1.0
GB
PB
PS
PY
XQ
XZZ
GB
PB
PS
PY
XQ
XZZ
1.8
0.9
c/c30
D/D30
1.6
0.8
1.4
1.2
0.7
1.0
0.6 0
50
100
150
Temperature (
1 2
200
250
0
300
Fig. 8.
4
fitting curve of consolidated data).
100
150
Temperature (
)
(a) Thermal diffusivity
3
50
200
250
300
)
(b) Specific heat capacity
D/D30 and c/c30 vs. temperature for the six coal samples in Huainan mining area (note: the dot line is the
5
23
0.20
2.4
Experimental data 0.18
2.4
0.26
Predictive data
0.16
Thermal diffusivity (mm2/s ) Specific heat capacity (J/(g K)) Thermal conductivity (W/(m K))
2.1
0.16
1.8
0.14
1.5
0.12
1.2
0.24
0.22
Experimental data
Predictive data 0.18
Thermal diffusivity (mm2/s ) Specific heat capacity (J/(g K)) Thermal conductivity (W/(m K))
2.0
0.14 0.16 1.6
0.20
0.12 0.14 0.18
1.2
0.10 0.16
0.10 50
100
150
200
1
Temperature (
2
(a) GB
250
0.14
300
0.08
0.8 50
100
150
200
Temperature (
)
250
300
)
(b) PB
0.16
2.4
Experimental data
2.4
0.24
Predictive data
0.14
2
0.14
0.12
0.9
Thermal diffusivity (mm /s ) Specific heat capacity (J/(g K)) Thermal conductivity (W/(m K))
2.1
0.22
Experimental data Thermal diffusivity (mm /s ) Specific heat capacity (J/(g K)) Thermal conductivity (W/(m K))
2.0 0.18
0.12 1.8
0.20
1.5
0.18
1.2
0.16
0.12
0.20
Predictive data
2
1.6 0.10
0.16
0.10 1.2
0.08
0.14
0.08 0.9 50
100
150
3
Temperature (
4
(c) PS
200
250
300
0.14 0.06
100
)
150
200
Temperature (
250
300
)
(d) PY
0.14
2.4
Experimental data
0.18
Predictive data
Experimental data
0.18
2
0.12
0.8 50
Thermal diffusivity (mm /s ) Specific heat capacity (J/(g K)) Thermal conductivity (W/(m K))
2.0 0.16
0.16
Thermal diffusivity (mm /s ) Specific heat capacity (J/(g K)) Thermal conductivity (W/(m K))
1.6 0.10
0.14
1.2
0.14
2.4
0.24
2.0
0.22
1.6
0.20
Predictive data
2
0.12
1.2
0.18
0.08 0.8
0.16
0.10 0.8
0.06 50
100
150
5
Temperature (
6
(e) XQ
200
250
300
0.12
50
100
150
200
Temperature (
)
250
300
)
(f) XZZ
7
Fig. 9. Comparison between predictive values and experimental values of thermophysical parameters for the six
8
coal samples in Huainan mining area.
9
24
1.0
BJG
CM
WJL
2.0
JG
BJG
CM
WJL
JG
1.8
0.9
c/c30
D/D30
1.6
0.8
1.4
0.7 1.2
0.6
1.0
0
50
100
150
200
1
Temperature (
2
(a) Thermal diffusivity
250
0
300
50
100
150
Temperature (
)
200
250
300
)
(b) Specific heat capacity
3
Fig. 10. D/D30 and c/c30 vs. temperature for the four coal samples in other areas (note: the dot lines are the fitting
4
curves).
5
25
0.12
2.1
Experimental data
0.17 0.14
Experimental data
Predictive data
0.11
2.7
0.19
2.4
0.18
Predictive data
2
2
Thermal diffusivity (mm /s ) Specific heat capacity (J/(g K)) Thermal conductivity (W/(m K))
0.16 1.8
0.12
0.10
Thermal diffusivity (mm /s ) Specific heat capacity (J/(g K)) Thermal conductivity (W/(m K))
0.15
2.1
0.14
1.8
0.16
1.5
0.09
0.10 0.08
1.2
0.07
0.17
0.15 1.5
0.13
0.14 1.2
0.12 0.08
0.13
0.9 0.06 50
100
1
150
200
Temperature (
2
250
0.11
300
50
(a) BJG
250
0.9
0.12
2.4
0.14
2.1
0.13
300
)
0.17 0.10
Experimental data
Predictive data
Experimental data
1.8
Thermal diffusivity (mm /s ) Specific heat capacity (J/(g K)) Thermal conductivity (W/(m K))
0.09
1.6
Thermal diffusivity (mm /s ) Specific heat capacity (J/(g K)) Thermal conductivity (W/(m K))
0.08
1.8
0.07
1.5
0.06
1.2
0.11
0.10
0.14
1.0
0.08
0.09
0.13 0.05 0.8 50
100
150
Temperature (
200
250
0.12
0.15
0.10 1.2
Predictive data
2
0.16
1.4
4
200
(b) CM
2
0.12
150
Temperature (
0.14
3
100
)
0.9 50
300
100
150
Temperature (
)
(c) WJL
200
250
300
0.08
)
(d) JG
5
Fig. 11. Comparison between predictive values and experimental values of thermophysical parameters for the
6
four coal samples in other areas.
7
26
1 1.0 3.4
0.9
3.2 3.0
0.8
a
k
2.8 2.6
0.7
2.4
0.6 2.2
0.5
2.0 0
50
100
150
2
Temperature (
3
(a) k
200
250
300
0
)
b
0.0024
0.0020
0.0016
5 6
50
100
150
150
(b) a
0.0028
0
100
Temperature (
0.0032
4
50
200
250
300
Temperature ( )
(c) b Fig. 12. k, a, and b at different temperatures.
7 8 9
27
200
)
250
300
1
Table 1
2
Ultimate and proximate analysis for the six coal samples from Huainan mining area, China. Ultimate analysis (daf, %)
Proximate analysis (ad., %)
Density of tablet
Coal sample Moisture
Ash
Volatile
Fixed Carbon
(g/cm3)
1.68
7.94
37.60
52.78
1.253
24.092
1.25
17.62
30.87
50.26
1.100
4.772
20.542
1.47
12.75
32.28
53.50
1.217
0.161
4.611
19.348
1.27
12.14
30.40
56.19
1.174
77.893
0.531
4.929
14.828
2.03
10.96
34.01
53.00
1.200
77.527
0.627
4.623
15.540
0.73
11.38
24.94
62.95
1.116
N
C
S
H
GB (Gubei)
1.893
76.853
0.437
5.077
PB (Panbei)
1.784
68.480
0.821
4.822
PS (Pansan)
1.786
72.380
0.520
PY (Panyi)
1.784
74.097
XQ (Xieqiao)
1.818
XZZ (Xinzhuangzi)
1.683
O 15.739
3
28
1
Table 2
2
Temperature dependence of thermal diffusivity and specific heat capacity for the six coal samples in Huainan
3
mining area. Thermal diffusivity
Specific heat capacity
Coal sample f0
f1
f2
R2
p
q
R2
GB
0.08374
5.6774
-102.84299
0.98467
0.86905
0.00268
0.99503
PB
0.07392
4.18674
-70.05970
0.98285
0.83554
0.00297
0.99764
PS
0.06965
4.35735
-73.81284
0.98205
0.90510
0.00329
0.99826
PY
0.06332
3.82656
-64.53233
0.98255
0.92723
0.00350
0.99866
XQ
0.05806
3.52742
-58.46087
0.98334
0.86818
0.00324
0.99794
XZZ
0.08177
5.22392
-91.70696
0.98299
0.88353
0.00312
0.99269
4
29
1
Table 3
2
Grey relational coefficient (ζ) and grey relational grade (γ) based on grey correlation theory. ζ Coal sample
D30
N
S
H
O
C
Moisture
Ash
Volatile
Fixed carbon
GB
0.7162
0.4738
0.7157
0.4825
0.6741
0.9556
0.3824
0.9821
0.6080
PB
0.9751
0.3350
1.0000
0.4898
0.7765
0.7448
0.4191
0.9286
0.7966
PS
0.9583
0.9269
0.9713
0.6851
0.9665
0.8473
0.8368
0.9139
1.0000
PY
0.7189
0.3421
0.789
0.6288
0.7220
0.9451
0.7341
0.8112
0.6941
XQ
0.6037
0.5871
0.5906
0.9652
0.5686
0.3398
0.8051
0.5630
0.6928
XZZ
0.5991
0.7963
0.6279
0.5041
0.7535
0.3421
0.6216
0.4802
0.9842
0.7619
0.5769
0.7824
0.6259
0.7435
0.6958
0.6332
0.7798
0.7960
GB
0.8308
0.7892
0.8314
0.8075
0.8788
0.5218
0.4492
0.5317
1.0000
PB
0.9215
0.3837
0.9055
0.5273
0.9569
0.8098
0.3341
0.9121
0.8892
PS
0.9444
0.9688
0.9354
0.8419
0.8886
0.9524
0.9358
0.9484
0.8185
PY
0.8696
0.3449
0.8045
1.0000
0.8662
0.6071
0.7917
0.7010
0.8592
XQ
0.9919
0.9583
0.9654
0.6879
0.9215
0.3613
0.7271
0.7726
0.8921
XZZ
0.9189
0.6457
0.9702
0.7547
0.9074
0.3506
0.8386
0.5584
0.6096
0.9129
0.6818
0.9021
0.7699
0.9032
0.6005
0.6794
0.7374
0.8448
γ
c30
γ
3
30
1
Table 4
2
Linear relationship between thermophysical parameters and the values at 30 °C. Thermal diffusivity
Specific heat capacity
Temperature Slope
Intercept
R2
Slope
Intercept
R2
60 °C
0.98083
-0.01141
0.99609
1.10828
-8.88102E-4
0.97992
90 °C
0.92068
-0.01143
0.99695
1.21476
0.00495
0.95704
120 °C
0.84718
-0.00832
0.99747
1.42662
-0.09749
0.94736
150 °C
0.79906
-0.00764
0.99864
1.53042
-0.10176
0.91533
180 °C
0.73891
-0.00467
0.99856
1.67116
-0.14035
0.89687
210 °C
0.72556
-0.00703
0.99830
1.90527
-0.27357
0.88349
240 °C
0.68835
-0.00499
0.99616
2.17327
-0.44370
0.87742
270 °C
0.67876
-0.00619
0.99644
2.48415
-0.64517
0.89878
300 °C
0.65583
-0.00476
0.99466
2.48761
-0.58382
0.89453
3
31
1
Table 5
2
Linear relationships between average change rates of thermophysical parameters and the values at 30 °C Average change rate
Slope
Intercept
R2
Average reduction rate of thermal diffusivity
-0.00128
-1.68504E-5
0.98148
Average generation rate of specific heat capacity
0.00539
-0.00206
0.73814
3
32
1
Table 6
2
Proximate analysis of the four coal samples in other areas. Proximate analysis (ad., %) Coal sample
Density of tablet
Area Moisture
Ash
Volatile
Fixed carbon
(g/cm3)
BJG
Baijigou coal mine in Ningxia autonomous region
1.37
30.49
15.10
53.04
1.259
CM
Cuimu coal mine in Shaanxi province
10.35
6.87
26.33
56.45
1.269
Wangjialing coal mine in Shanxi province
0.58
13.36
15.63
70.43
1.233
Jiangou coal mine in Xinjiang province
2.48
6.51
32.35
58.66
1.009
WJL[10] JG
3
33
1
Table 7
2
Predictive models based on the values at 30 °C for the four coal samples in other areas. Thermal diffusivity
Specific heat capacity
Coal sample Model
R2
Model
R2
BJG
D=1.95881·D30·T—0.19358
0.98934
c=c30·(0.9114+0.00349·T)
0.99793
CM
D=1.90947·D30·T—0.18524
0.99046
c=c30·(0.89356+0.00303·T)
0.99856
WJL
D=2.19448·D30·T—0.2202
0.97233
c=c30·(0.93023+0.00327·T)
0.99548
JG
D=1.84169·D30·T—0.17731
0.97419
c=c30·(0.93292+0.00348·T)
0.99325
3
34
1
Table 8
2
Predictive models based on values at different temperatures for the coal samples in Huainan mining area. Thermal diffusivity
Specific heat capacity
Temperature (°C) Model
R2
Model
R2
30
D=2.06896·D30·T—0.20791
0.97923
c=c30·(0.92198+0.00327·T)
0.98978
60
D=2.3116·D60·T—0.20794
0.98123
c=c60·(0.83261+0.00295·T)
0.99096
90
D=2.47886·D90·T—0.20795
0.98134
c=c90·(0.75578+0.00268·T)
0.99095
120
D=2.63701·D120·T—0.20794
0.98226
c=c120·(0.69619+0.00247·T)
0.99339
150
D=2.79002·D150·T—0.20794
0.9825
c=c150·(0.64766+0.0023·T)
0.9939
180
D=2.9398·D180·T—0.20793
0.98228
c=c180·(0.60509+0.00215·T)
0.99482
210
D=3.07613·D210·T—0.20796
0.98154
c=c210·(0.56982+0.00202·T)
0.99505
240
D=3.17977·D240·T—0.2079
0.98042
c=c240·(0.53999+0.00191·T)
0.99402
270
D=3.27317·D270·T—0.20795
0.98167
c=c270·(0.51025+0.00181·T)
0.99253
300
D=3.3369·D300·T—0.20794
0.98139
c=c300·(0.4917+0.0017·T)
0.99314
3
35
1
Table 9
2
Relationships between parameters in the models and temperatures. Parameter
Formula
R2
k
k=1.8627+0.0076·T-8.89154E-6·T2
0.99901
a
a=1.00001-0.00302·T+4.47391E-6·T2
0.99778
b
b=0.00353-1.03808E-5·T+1.46465E-8·T2
0.99661
3 4
36