South African Journal of Education Copyright © 2006 EASA Vol 26(2)229–252
Predictors of learner performance in mathematics and science according to a large-scale study in Mpumalanga Kobus Maree, Colleen Aldous, Annemarie Hattingh, Andre Swanepoel and Mike van der Linde
[email protected] Eight hundred and ninety-nine (431 male, 467 female and one missing value) Grade 8 and 9 (n = 184 and 713, respectively, with two missing values) learners from secondary schools in Mpumalanga completed a science and mathematics questionnaire. Student's t tests showed that male and female, as well as language groups' scores, differed significantly. Stepwise non-linear regression shows that a combination of factors contributes significantly to learner, science and mathematics performance (R2 = 25%, 20%, and 11%, respectively).
Introduction Since the consequences of the former apartheid education system in South Africa are still "catastrophic" (Kahn, 2004:149) and seriously hamper the career prospects of (especially) black learners, education and training is being transformed and reorganised. These changes have been prompted by a number of factors. The Third International Mathematics and Science Study Repeat Survey (TIMMS-R) of the worldwide trends in respect of scholastic performance in mathematics and science confirmed that South African mathematics learners' performance was significantly poorer than the vast majority of other participating countries in tests that measured basic mathematical skills (Howie, 2001:18). South Africa even fared significantly worse than the other two African countries that had participated in the survey, namely, Morocco and Tunisia. South African learners struggled especially to deal with problems involving language. In general learners experienced many problems communicating their answers in the language of the test (English) and they revealed that they did not have the basic mathematical knowledge that is required. The failure rate in mathematics at school remains unacceptably high (Maree, Pretorius & Eiselen, 2003; Steyn & Maree, 2003). In South Africa there is a vast gap between the quality of schooling provided for and the achievement of white and African students (Maree, Claassen & Prinsloo, 1997; Saunders, 1996). Since the Grade 12 national examination results still largely determine whether a learner will be accepted to sought-after fields of study at tertiary institutions (Sibaya & Sibaya, 1997), technological and scientific fields of study in particular are, by and large, out of reach for black learners. Research indicates that many learners in South African schools do not sufficiently master the knowledge and skills underlying learning and problem solving. Learners often acquire deficient, superficial, and rote knowledge of basic concepts (Maree & De Boer, 2003; Maree & Steyn, 2001). Several hypotheses have been proposed and investigated, including those of the following researchers: Arnott, Kubeka, Rice and Hall (1997), Howie (2001), Maree and Molepo (1999), and Reynolds and Wahlberg (1992). Poor socio-economic background of learners (poor incentive to study at home), lack of appropriate learner support materials, general poverty of school environment, general poor quality of teachers and teaching (including poor subject
230
Maree, Aldous, Hattingh, Swanepoel & Van der Linde
knowledge and poor motivation), language of instruction (often not the same as learners' mother tongue), and an inadequate study orientation. Despite the fact that mathematics and science are vulnerable to poor instruction (Freudenthal, in Maree, 1995), in South Africa mathematics is commonly presented at school and university level in a way that strongly encourages traits such as reticence, conformation to rules, and use of sophisticated language (Maree, 1999). Ramnarain (2003:33) argues that disadvantaged learners from seriously impoverished learning environments are lacking in the necessary informal mathematical knowledge prescribed by [the problem-centred approach to teaching and learning mathematics] to develop their own strategies for solving non-routine mathematical problems. Over the last few decades, a plethora of national plans have originated in developing countries to promote educational provision for economic development (Louw, 2003). South Africa too, as a result of the new political dispensation of 1994, has followed a similar trend and the problem-centred approach in mathematics has received attention as an alternative to the more traditional approach in South Africa. The latter is associated with rote learning, learning without the necessary insight, a lack of creativity, a tendency to be too teacher-orientated and a lack of learner activity (De Corte, 2000). The South African education system has been undergoing extensive restructuring since the advent of democracy. Coinciding with the formation of democracy in South Africa in 1994, an Outcomes-Based Education system was formulated. Introduced in 1998 and amended in 2001, this system asserts that all learners have the ability to succeed, and focuses on the acquisition of knowledge, skills, values, and attitudes, unlike the traditional practice that was based on content mastery only. According to this paradigm teachers are expected to introduce real-life mathematics into classrooms, and help learners acquire skills that will prepare them to become life-long learners and critical thinkers. According to McNeir (1993:1) "these outcomes are derived from a community vision of the skills and knowledge students need to be effective adults". In South Africa it was also envisaged that this new curriculum (colloquially referred to as Curriculum 2005, and abbreviated as C2005, modelled on principles which incorporate learner centredness, formative assessment, integration, and critical thinking that have gained much support and favour worldwide) should reflect the values and principles of the new democracy in South Africa. However the introduction of an Outcomes-Based Education system at present does not appear to be yielding satisfactory results. Recent research has revealed that the vast majority of Grade 6 learners in the Western Cape in South Africa (normally one of the top achieving provinces in South Africa) have not even mastered the literacy and numeracy levels expected of Grade 4 learners (Kassiem, 2004). Of the approximately 35 000 Grade 6 learners tested in the Western Cape in 2003, only 15.6% passed the numeracy test. Moreover the results confirmed the huge discrepancy between the achievements of former model C schools (with predominantly white learners) and those of previously disadvantaged schools (with black learners) (Dugmore, in Kassiem, 2004). Teachers throughout the country, who were in no way responsible for or involved in developing the new curriculum, agree that learners in the Further Education and Training Phase (Grade 10) achieve increasingly worse results, with unacceptably high percentages of learners failing mathematics, and dropping the subject in mid-year (Perry, 2003). In 2000 the Mpumalanga Department of Education began a three-way collaboration with
Mathematics and science predictors
231
the University of Pretoria and the Japanese International Co-operation Agency (including scholars from two Japanese universities) to optimize the achievements of learners in science and mathematics. In this article we reflect on the success ratio in learner performance in these two gateway subjects and report on the findings of this investigation into Grade 8 and 9 learner performances in mathematics and science (Aldous, Hattingh & Rogan, 2004). Hypotheses were that a) scores in science and mathematics tests would be correlated; b) a combination of subscale scores in the tests would best predict the aggregate scores of first-year engineering students; c) prediction models would be significant at the 0.05 level; d) the difference between the mean scores of the two tests for different language groups would be significant; and e) the difference between the mean scores of the two tests for different gender groups would be significant. Method Sample A purposely selected sample of 899 (431 boys, 467 girls and one missing value) Grade 8 and 9 (n = 184, and 713, respectively, with two missing values) learners from secondary schools in Mpumalanga reflected the full range of socio-economic types of schools in this region. Curriculum Implementers, also known as subject advisors, were, among others, used to gather the data. Most of the schools in the sample were rural schools with only black learners in attendance. Procedure The survey was conducted in May 2002. All learners completed the survey within the space of three days. Learners were asked to complete a questionnaire, which probed for learner background, attitudinal data, teacher practices, as well as basic knowledge and understanding of natural science and mathematics. The data on knowledge and understanding of natural science and mathematics were scored as a test. This score was used as a dependent variable in a regression analysis with all the other variables that had probed for learner background, attitudinal data, and teacher practices as the predictors. Ethical aspects Permission was requested and obtained in writing from the Mpumalanga Department of Education as well as from the students to conduct the research and publish the findings. The assurance was given that no individual would be identified. Limitations of the study This research was limited to science and mathematics learners in a single province in the Republic of South Africa. The instrument was administered in English, the language of instruction in all the schools in the sample. However English was the mother tongue of only 0.64% of the learners.
Maree, Aldous, Hattingh, Swanepoel & Van der Linde
232
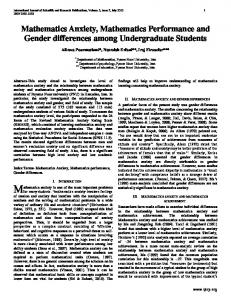
Measuring instrument The instrument consisted of five sections dealing with demographic data, learner background, learner attitude to science and mathematics, learners' perceptions of what was happening in the science and mathematics classroom, respectively, and a test (see Appendix A). The test required basic understanding of science and mathematics processes appropriate for the Grade 8 and Grade 9 level. It consisted of 15 multiple-choice questions, of which eight focused on skills required for natural science and seven on mathematical skills. All the questions in the questionnaire were aligned with the mathematics and science outcomes stipulated in C2005. The performance of the learners was measured by using three measures called the learner performance, the science performance, and the mathematics performance. The learner performance was calculated by adding all the questions that the learners had answered correctly in the test yielding a possible mark out of 15. The science performance was calculated by adding all the questions on science that the learners had answered correctly in the test yielding a possible mark out of 8. The mathematics performance was calculated by adding all the questions on mathematics that the learners had answered correctly in the test yielding a possible mark out of 7 (Table 1). Figure 1 shows the distribution of scores for learner performance for the entire sample of learners. Results
Figure 1
Histogram of learner performance scores (N = 899)
The Cronbach alpha reliability coefficient for the scores obtained from the administration of the mathematics and science questionnaire was calculated at 0.53. We readily admit that this internal consistency reliability score is low(ish), especially since, generally, researchers recommend an internal consistency score of 0.70 and higher (Thompson, 1994). The fact that
Mathematics and science predictors
Table 1
233
Descriptive statistics: learner, science, and mathematics performance (N = 899)
Descriptive measure Mean Median Mode Standard deviation Skewness Kurtosis Minimum Maximum Interquartile range
Learner performance (Max: 15)
Science performance (Max: 8)
Mathematics performance (Max: 7)
5.29 5.00 5.00 2.53 0.69 0.60 0.00 14.00 3.00
2.77 3.00 3.00 1.56 0.42 –0.03 0.00 8.00 2.00
2.51 2.00 2.00 1.56 0.50 0.03 0.00 7.00 3.00
most of the learners found the vast majority of the questions difficult no doubt contributed to this rather low score. As far as the validity of the instrument is concerned, we would like to confirm that the questionnaire was perused by several senior science teachers with many years of experience, who all agreed that the contents of the questions reflected, to a highly satisfactory degree, the essential skills required for natural science and mathematics, that all the questions in the questionnaire were aligned with the mathematics and science outcomes stipulated in C2005, and that, in order to achieve in the questionnaire, a basic understanding of science and mathematics processes appropriate for the Grade 8 and Grade 9 level was required. This act confirmed the face and, indeed, content validity of the questionnaire. The distributions of performance measures, in all cases, were positively skewed (all three Shapiro-Wilk tests yielded p values < 0.05). Regression models We looked specifically at models that could be used to generalize to the majority of schools in the study region. Regression models were calculated to determine the variables and models that could be used to best predict the learner, science, and mathematics performance (dependent variable). The Stepwise Selection method of SAS (1990) was used to determine the relevant variables from a number of identified variables (V8 to V49, independent variables, which questioned demographic data, learner background, learner attitude to science and mathematics, learners' perceptions of what was happening in the science, and mathematics classroom, respectively) (Tables 2 and 3). These models explained 25%, 20%, and 11% of the variation in the learner, science, and mathematics performance, respectively. The fact that all the learners performed poorly and scored very low marks (cluttered at the lower end of the scale) in their tests might have been the reason for the weak fit of the models and the resulting low R2s. Table 4 shows the probes for the variables indicated in the models and their correlations with the performance measures.
Maree, Aldous, Hattingh, Swanepoel & Van der Linde
234 Table 2
Anova results for models (N = 899) Source of variation
Degrees of freedom
Sum of Squares
Mean Squares
F value
Pr > F
Learner
Model Error Total
30 505 535
907.91 2728.03 3635.94
30.26 5.40
5.60