Nov 15, 2018 - elTorts lhave been made to predict hybrid performance (HP). b.y usirrg field data of ..... 1 x PCIR Buffer (Mg2+-free), and 0.5 lJ Taq DNA poly- mrerase .... LM methods, these mid-parent heterosis predictions were c,ombirred ...
Theor Appl Genet (2010)
DOI
1
l20tl5I46l
0. I 007/s00122-009 -1208 -x
P'redliction of hybrid performance in maize using molec marlkers and joint analyses of hybrids and parental inb 'Jens Miihring'Albrecht E. Melchinger' Barbara Kusterer Baldev S. Dhillon 'Hans-Peter Piepho ' Mlatthias Frisch T,obias A. Schrag
Receiveil: 31 May 2009i Accepted: 21 Octobel 2009/Published online: 15 November @ Sprinller-Verlag 2009
Abstra,ct The identification of superior hybrids is importa,nt for the success of a hybrid breeding program. However, field evaluatiorr of all possible crosses among inbred .lines requires extremely large resources. Therefore, elTorts lhave been made to predict hybrid performance (HP) b.y usirrg field data of related genotypes and molecular mrarkerr;. In the present st-udy, the main objective was to assess l.he usefulness of p,edigree information in combinati,on with the covariance botween general combining ability (iCA) and per se performance of parental lines for HP pr:ediction. In addition, we compared the prediction efficiency of AFLP and SSR. marker data, estimated marker effects separately for r,:ciprocal allelic configurations (eLmong; heterotic groups) of heterozygous marker loci in h'ybrids, and imputed nLissing AFLP marker data for marker-based HP predictirtn, Unbalanced field data of 400 nLaize dent
x flint hybrirperiment. By combining these data, an unbalanced factorieLl between 47 dent and 32 flint inbred parents was generated, comprising 4010 tested hybrids. The 79 inbred parents and 4l additional lines were evaluated for their por se performance in I I single trials, involving 3 years and 5 locations. All trials were carried out using adjacent a-designs with two-row plots, five plots per block, and two to three replicates. GY was recorded in Mg ha-r adjusted to 155 g kg I grain moislure, while GDMC was recorded inL
percr:nt,
IVlixed linear model analvsis
Data fcrr GY and GDMC from all experiments were analyzed udth mixed linear models. The 4l additional lines in thLe line per se experiment, which were not used as parents in factorials matings, were treated as checks. These and the check l'arieties in the experiments of the hybrids were used to, adjust for single trial etlfects, but were not used to estim,ate genetic variances. l)ummy variables were used to divide ,genotypes into hybdds, dent and flint parental lines, and checks. The model can be described in the syntax of Patterson (1997) by Y'
+ L + Y. L+ C..7, Y. L+ R.T, Y, L + B.R .T .Y .L+ C.L+ C.Y + C.Y 'L * G()Aa"6 I GCAyti* + sCA r line4",, I linefuint I G()Aa"r1' L I GCAltint' L + SCA' L I line4"n1' L
-l
I
G()A4",1
I I
lineltinr L ,
.Y + GCAfli,t .Y + SCA.Y
lineltirt
linea"nt
linea",l'Y
.Y
G()Aa,6. Y' L + GC'Lyint. Y . L
t
I
+
SCA. Y . L
'Y ' L + line11;r1 'Y ' L (r)
where lixed and random effects were separated by a colon and intoractions between two effects were denoted by a dot between the main effects. Main effects for the factors year ()), lor:ation (L), and check (C) were treated as fixed elTects, which allowed accounting for performance
djffererrces between single trials. Genotypic effects, all inLteractions, and effects of trials (Z), replicates (R) within trials, and incomplete blocks (B) within replicates were treated as random. Genotypic effects of the factorial crosses were partitioned into GCA effects of the parental dent and flint inbreds, and SCA effects of the crosses (Gardnr:r and Eberhart 1966). It was assumed that the
vector
of IGCA effects
was
variances Arozccea"r, and A2of
pools, respectively, where
.41
lly distributed with for the dent and flint A2 were the additi ve
relationship matrices for genoty They were computed from
of the respective pools.
among the inbred lines (Berna
2002). The vector of
SCA effects, was assumed to ha was a matriiK with elements eq coefficients of coancestrv.
(linep"n,) and flint
(linep11r1
of
coancestry
var\ance Dot ro, where D to the product of parenl.al
were divided into dent
lines with
variances
A, oTuorua"r, and Azozruorur,n
covariance between tlfre per se performance of an i and its conesponding GCA effect was considered in he model as follows. If GCA denotes a vector of GCA ts of all parents in one pool and PERSE denotes a of the corresponding effects of l:ine per se performa in the same pool and both vectors have the same of genotypes, then the covariance rcf both vectors can described by
/ cc'q \ tou\rrnsa/:
I
A'olr.
\a
' occArP, So A,
where A is the additive relat the covariance between GCA
lines,and2)isa2x2u ance structure was assumed for
effects for both dent and flint I actions wit.h location effects.
A ' occe,penso
\ A,o'rr*r, )
p matnx,
oGCA.qERSE
1S
per se effect of parental matrix. This covariin GCA and line per se as well as their inte,r-
other interactions of genetic effi:cts with year and location were assumod independent due to conv issues, which may result parent-by-year classi nfrom much stronser imbalance ion classifications. The cations than of parent-byresidual errrlr and the variance assumed to be specific for model used pedigree (P*) data i and considered covariance (C*) se perfdrmance, the model was Three additional models were covariance r;tructure. In the between line per se pe effect were dropped from the onal. In Model P-/c+, identity of 41, A2, and D. In Model P relationship matrices nor line per se performance models were compared on the likelihood l,Ls and the number by using Aliaike's information calculated as -2LLp + 2k, are preferable (Bozdogan I analyses wr:re performed with 2002). Coefficients of coancest SAS proceclure INBREED (
incomplete blocks were single trial. Since th,is the relationship matric;s n GCA and line per as
P*/C-l-
modt:|.
with varying variancr:-
P+lC- all covariances and corresponding GCA , so that X was diagices were used instead - neither pedigree-basr:d
between GCA aud considered. These four is of their restricted loeestimated parameters k
rion (AIC), which was models with lower AIC All mixed linear model
(Gilmour et
al.
were calculated using the Institute lnc. 2000). The
0
Sprin6;er
P+/C+ model was chosen as the underlying model to study the influence on prediction efflciency of using (n) SSI{ instead of AFLP markers, (2) marker effects that were eritimated separately for reciprocal allelic configurations o1 heterozygous maiker loci, and (3) imputed missing
Genet (2010) 120:451461
Theor
4:;4
(Robens et al. 200 r). ,ly for dent and flint
variable siz,e, uslnt NPUTE soft Imputations were carried out lines and fc,r each chromosome. Cross-validrrtion
A.FLP marker data. MolecuLlar data
The 47 dent and 32 flint lines were genotyped with AFLP arrd SSR markers. The AFLP analyses were carried out with 2t) primer-enzyme combinations (Vos et al. 1995), as described in detail by Schrug et al. (2006). Positions of 910 mapped AFLP bands were obtained from an integrated AFLP map (Vuylsteke et al. 1999). The SSR analyses were conducted with bulked samples of five plants per inbred line. Harvested leaves were freeze-dried and ground to powder'. Genomic DNA was extracted using a modified CTAB procedure (Saghai-Maroof et al. 1984). Analyses were carried out for 256 publicly available SSR markers, which rrere uniformly distributed across the genome. Map
positions (IBM2 2004 nr:ighbors) and primer sequences were obtained from Maize'GDB (http ://wrvw.maizegdb.olg). The primer pairs were synthesized by Sigma-Genosys (Siteinheim, Germany), with one primer of each pair being flruorescent labeled with indodicarbocyanine (Cy5) at the 5' performed in a total volume end. Ttre PCR reactions "r,ere pl olt 9.75 containing 60 ng of template DNA, 154 pM of each dNTP, 256 nM of each primer, 256 mM MgCl2, 1 x PCIR Buffer (Mg2+-free), and 0.5 lJ Taq DNA polymrerase (Invitrogen, Karlsruhe, Germany). Thermocycling consisted of an initial de,naturation step of the template DNA at 94oC for 150 s, followed by 33 cycles of 93oC for 4lj s, 51)-60"C (depending on the primer set) for 45 s, and 72"C for 45 s, with a flnrnl extension phase of l0 min at 72oC, l?or some primer riets, a touchdown step from in between 58 and 64oC do'ryn to 55'C was included in the pr:otoco,l. The resulting amplified DNA products were analyzed on polyacrylamide gels (Ultra Pure SequaGel-
XR; National Diagnosticr;, Atlanta) on an ALF Express DNA sequencer (Amersham Biosciences, UK). The DNA fragments were sized with ALFWIN v2 software, Molecullar markers were used for prediction if they were polynLorphic and exhibited lesr; than 307o missing observations, separatr:ly for dent and flint lines.
Irnputartion of missing A-FLP marker data
N[issinl; observations in lhe AFLP marker data set were replaced by predictions of marker genotypes, resulting in a complete marker data set,, which was denoted as AIILP{'. The missing genotypes were imputed based on measures of pair-wise haplotype dissinrilarity within sliding windows of
4)
Springer
Efficiency of prediction was ev with 300 randomized runs Schrag et al. (2009). For each 47 x 32 far:torial data set was set and a test set. In each c
parental lines from each assigned ar;'testcross-eva
uated by cross-validation
described in detail by cross-validation run, tlne vided into an estimation lidation run, half of tlhe ic group were randomly . The crosses betwe(ln the estimation set. The
testcross-evaluated lines remainins crosses formed test set, consisting of of the parents were 'Type 0' crosses, meaning that 'Type 1' crosse:s, for and evaluated testcross , parent for meaning that one was e uated testcross pe)rling of testcross data, the formance. In contrast to subsa per se performance data of all always remained in were estimatr:d the estimation set. Variance from the complete data set used for all cross-validation runs. For each run, the correlation coeffi-
cient betweren predicted and
performance was separately cletermined for Type and Type I hybrids in the test set, The median all runs of squared cc,r-
relation coofficients
(R') was
efficiency. lBoxplots of R2 val five number summary (Tukey
idered as prediction were based on Tukey's I
).
Prediction rnethods
were studied, two of six which were based on phenotypi and pedigree data (PI'), and molecular marker and four on phenotypic, pedi (Schralg et al. 2009). In t PP-GS method, HP was data predicted by BLUPs for GCA and SCA of the coretheir cross. estimated bv sponding dent and flint lines
For HP pr,ediction,
mixed linear model analysis estimation riet. If coefficients of
in the mixed linear model ana
for
testcross-unevaluated pare
the hybrids
in
tlre
ncestry were includod
s, the GCA estimates lines were obtainrld
from data of related testcross
luated inbred lines, and
the SCA e,stimates of un from related tested hybrids. average of BLUPs for per
hybrids were obtainr:d
the PP-L method,
the
performance of both parental lin,es was used as predi tor of HP. Marker-basod prediction rnethods were built either multiple linear of associated markets' regression (MLR) or 'total e ('TEAM'), both approaches bei described in detail bv Schrag et al. (2007). In short, for the MLR approach, rded as a function of tlhe performancr: of hybrids was at the marker loci in effects of their allelic confi
Theor Appl Genet (2010) 120:451461
the model. Variable sel(3ction of the marker loci was carried out by forward s,election based on the F-to-enter
Joint analvries of hvbrids and i
procedure. For the TEAI\4 approach, each marker locus u/as soparately tested for significant association with hybrid performance at a false discovery rate of 5Vo. The effects of the allelic configurations on hybrid performance were then estimated and summed up across all s;ignificant loci" resulting in the TEAM value and consridered as marker-based estimate of the genotypic value of a hybrid. In a simprle linear regression across all hybridr;, TEAM values were then used as predictors for hybrid performance (Schrag et al. 2007). In the MLR-H and TEAM-H methods, marker effects for HP were obtaine:d from the estimation set and used for prediction of HP in the test set, In the analogous rnanner, marker effects were computed for mid-parent hoterosis in the
The number of estimated
estimalion set, and usetl for prediction of mid-parent heterosis in the test set, For the MLR-LM and TEAM-
LM methods, these mid-parent heterosis predictions were c,ombirred with BLUPs of line per se performance, providing HP predictions of test set hybrids. l)istine;uishing identical nrarker alleles frorn different heterotic groups
of each hybrid was determined by the marker genotypes of its prrental inbred lines (Schrag et al. 2007). Given n matker alleles for a single locus, there are n2 possible combinations of parental alleles. These consist of n hcrmozygous and n2 - n heterozygous bybrid marker genotylpes, the latter comprising (n2 - n)/2 unique allele T'he marker genotype
crcmbinLations and their
(tf -
n)/2 altemate counterparts.
approach (Hetl), the reciprocal allelic configurations of heterozygous marker loci in hybrids were pooled togethe,r in the marker daLta as was done by Schrag et al. (:1001, 2009). In a secondl approach (Het2), the reciprocal allelic configurations wer,3 distinguished for estimation of marker effects.
In a first
k was 159 for P+iC+
and P-/C-l- models. and 155 for P*/C- and P-lC'gree-based relationstrip models. The models using matrices
(I'*)
showed lower
values (Table
l) than
those using identity matrices
(P-). Models including
covariance between GCA and
se oerformance of the AIC than those, in
parental lines
(C*)
resulted in
which this covariance was not quently, ther P*/C* model
P-lC-
model the highest. componentri for GCA ranged
Mg
ha-'
Estimates
higher
and 1.89-2.92 for G fbr GCA and SCA
for P*
models tn
SCA:GCA variance
c
idered
(C-).
Conr;e-
the lowest AIC and the
estimates
of
variance
0.175 to 0.226fotGY in
in percent (Table l). ance components w€)re cases. The ratio of for the model with the 0.29 for GY and 0,14 lbr
lowest AIC (P+/C+ model) GDMC. The diffrerences in efficienci between HP predicti,cn approaches that were based on the four models P+/C+, P+IC-, P -- lC+, and P-iC-, re largest for PP-GS and smallest forr TEAM-H 0able 2 The prediction efficien-
MLR-PM (not shown) cies were lower for MLR-H . However, the predicthan for TIIAM-H and TEAM(P+/C+, P+/C-, four tion efficiencies of the pattems for MLR-H P-lC+, P.-/C-) showed si ar versus TEAM-PM. Use versus TEAM-H and for MLRmatrices for GCA and of the pedigree-based rices increased R2 preSCA effects instead of identity dominantly for PP-GS. With the P-lC- model, BLUP lbr the lack of covariance GCA and IjCA were zero due genoty and, therefore, Type 0 information between the hybrids werre not predicted wi PP-GS. However, whiile for GY ther;e increases were lar for GDMC this was observed inclusion c,f covariance bet
in C+ and C- models. C- models only. The GCA and line per se
Rlesultr;
model enhanced R2 preperformance in the mixed li by PP-L and TEAM-LIvI. dominantly for PP-GS, follo however, not for TEAM-H. Thi increase in R2 of PP-GS than for GY. was more p'ronounced for
Marker data
Modifications of the marke
of the marke:r data for polymorphism and a maximum drop-out rate of 0.3 resulted in the retention of 732 markers in the AFLP data set, 891 markers in the
mid-parent heterosis lbr Markers associated with HP a GY and GDMC were selected ith the marker-based prediction methods (Table 1l). On t average across all runs, lected with TEAM than distinctly more markers were were applied to SSR data, with MLR. When MLR number of markers and very sma they selected only a y Distinguishing marker. in cases to select failed some marker heterozygous of reciprocal allelic configu (Het2 number of increased the vs. Hetl loci in hvbrids
A,ssessment
A.FLP* data set, and 179 markers in the SSR data set. The average numbers of allelic configurations at marker loci of hybrids for the AFLP data were 2.7 for Hetl and 3.5 for Fltet2, and these were very similar for AFLP*. The average numbers of allelic configurations for the SSR data set were 10.4 for Hetl and 12.2 fot Het2.
prediction methods
0
Sprinl;er
Theor
Table 1 Estimates of mixed linear model parameters from joint analyses of hybrids and parental lines for grain y matter content (in 70)
Trait/estimate
Genet (2010) 120:451461
(in Mg
ha-')
and grain dry
P+
c-
c+ Grain yield
LLn
-28,t14
-28,r28
-28,r52
-28,164
AIC
56,546
s6,566
56,622
56,638
0.175
+ 0.042 + 0.064 0.043 + 0.012
0.178
0.198
0.200
"^2CCAdenl
^2 "CCAnint USCA -2
+ + 0.061 +
+
0.226
0.069
0.185
0.192
0,074
0.t97 + 0.077
0,015
0.063
+
0.067
0.016
+
0.042
+ 0.043 +
0.064 0.012
Grain dry matter content
LLn AIC ^2 "GCAdent ^2 " GCAflint ^2 "scA
-8,394
-R 415
-8,491
-8,544
11,106
17, I 80
17,300
t'7,398
+ 0.51 2.00 + 0.59 0.28 + 0.04
2.36
+
1.89
+
0.s8
0.28
+
0.04
2.92
0;10
2;70
+
0.67
2.17
+ + 0.36 +
0.66
2.21
+
O.72
0.06
0.36
+
0.06
2.44
Restricted logJikelihood (LL;), Akaike's information criterion (AIC), and variance components (o2.1 of combining ability (SCA) and their standard errors are given. The analyses were penformed considering information @+/P-) in combination with or without modelline the covariance between l3CA and per se
setected markers for the T.EAM methods, but reduced it for MLR methods. For thr: imputed AFLP* data set, more mrarkers were selected than for the original AFLP data set. thLe
Prediction efficiencies ior GY were highest for PP-GS ('llable 4). For GY, the marker-based methods MLR-LM, TEAM--H and TEAM-LM were superior to PP-L, while for GDMC, only TEAM-LM resulted in similarly high ft2 as PIP-L. ]'he use of the SSR marker data set instead of AFLP fcrr MlR-based prediction changed R2 by -0.01 to +0.10 fcrr Type 0 hybrids, and by -0.13 to *0.03 for Type I hybrids. With TEAM approaches. R2 was increased by 0.03-0.04 for GY, but ofton reduced for GDMC (-0.05 to 0.02). Distinguishing identical marker alleles from different heterotic groups changed R2 by -0.01 to *0.03 (data not shown). With the impu,ted AFLP* data set, R2 of MLRH was up to 0.06 higher dhan with the original AFLP data set. For the remaining marker-based approaches, R2 changgd by -0,02 to *0.02 when based on AFLP*.
Discussiion
Joint analyses of hybrids and inbreds Our study was based on field data that were also used by Sr:hrag et al. (2009) for pnldiction of HP with mixed linear models, While performing the current analyses of the data we detected an incorrect ordering of columns and rows of the pedigree-based relatiotrship matrices for GCA and line per se performance in tht: previous study. Owing to the corrected covariance matrices and some minor changes of the moclel in the present study, for P+/C+, the estimates of
€l
Springer
0.49
(GCA) as well as specific nce and absence of pedigree of parental lines (C*/C -)
variance components and the GCA and line per se from the earlier results in
of prediction based
Bemardo (2004), who analy belonging tlo nine heterotic
22,714 single
on
differed considerably
et al. (2009), Variance components for GY in the present study were comparable to those reported Fischer et al. (2008) for period of 30 years in the breeding material that covered same breeding program. For , the variance coroponents were in good with Parisseaux and
components for the P+ mode models (Table l) may be due ships among parental lines were ieree-based covariance matri unrelated parental lines by usi explain larger variance com let us consider two genotypes b between them. Then, the A(1 - b)I I bJ, wherc 1 is an matrix with all entries equal constant effect for all genotypes overall mean of genotypes. For is an identity matrix 1. For equal for P* and P- models, 1t b)Iof,r :^Iof,-, and thus components, o;+ > o;_.
-
Pedigree-based relationship
cross,:s
s. Larger varianr:e in contrast to the Pthe reason that relatio.nidered by using perl-
instead
of
assuming
identity matrices. l'o
for the P+ models. ith positive correlation trix can be written ras ntity matrix and / is a l. In this case, b,/ is a and confounded with the - models, the A-matrix considered case, Ao2 is
which follows, that the estimated varian()e
were used
to
lines, both for the,ir model the covariance among i With these P-l- models. GCA and line per se performa R2 for HP prediction of GY was greatly improved for PIPand TEAM. These difGS, but only marginally for PP ferences we;re due to considering he untested parental lin,ls
Theor Appl Genet (2010) 120:451461
Table 2 Efficiency of prediction (R') of grain yield (GY) and grain dry matrrcr content (GDMC) of hybrids having no (Type 0) or one (llype 1 ) parental line evaluatr:d in testcrosses
Table
Trait/hybridtype
TraiVmarker
Method
Median
R2
c-
c+
Hybrid performance
Mid-parent heterosis
Hetl HeI2
Hetl
28t.6 344.6
16.8
2
Hetl
HeI2 Hetl
Het2
Grain yield
Type I
PP-GS
o,73 0,32 0.54 0.61 0.60
PP-L
0.2'7
PP-GS
PP-L TEAM-FI
TEAM-t,M Type [l
TEAM-FI TEAM-T,M
0.43 0.46
0.61
0.14 0.54 0.53 0.40
0.t4 0.44 0.39
0.53 0.23 0.s0 0.54 0.22 0.t7 0.36 0.37
0.39 0.13 0.50 0.50
NA 0.r2 0.37 0.35
Grain dry matter content
Type I
PP-GS
PP-L
TEAM-FI TEAM-T,M PP-GS
Ct
PP-L TEAM-FI
TEAM-t,M
0,87 0;77 0.43 0.80 0.79 0;75 0.23 0.75
0.61
0,64 0.43 0.72 0.32 0.64 0.24 0.6s
0.83 0.78 0.42 0.80 0.75 0.75 0.22 0.74
0.44 0.63
AFLP AFLP* ssR AFLP AFLP*
2.8
14r.8 189.9 14.'7 r8r.0 242.7 19.7
233.3 296.6 20.6
ssR
92.r 10r.0
2.6
confi gurations;
of
rC.1 12.4
76.t 82.4 2.1
2.5
Two methods (TEAM and MLR) sets, namely AFLP, AFLP* (AFLP tions), and SSR, to identify heterozygous
2.0
applied to three marker d:rta imputed missing obsenramarkers. Reciprocal allelic loci in hvbrids were oooled
(Hetl) or distinguished (Het2)
0.72
NA 0.63 0.23 0.6s
Table
4
Method
Grain yield
o.13
PP-L
0.32
I\FLP
0.38
I\FLP*
se
performance. Therefore, in our cross-validation approach, HP data were removed from the estimation sets, but data of line per se pedormance w,ore retained. The GCA effects of parental lines that were not evaluated in testcrosses were not estimable from field data, but could be predicted from related genotypes by us;ing pedigree-based covariance inLformation. In contrast, the PP-L approach was based on thre per se performance of lines, which was included in all estimation sets, resulting in only small additional beneflt if pedigree-based covariancr: information was utilized. For
P*
over P-- under the C* scenario, even for PP-GS. However, inr the C- case, where PP.-GS did not benefit from line per se GDIIC performance data, additional information from related genotypes via pedigree-based relationship matrices
the prediction efficiency of PP-GS. The P+ was often larger for Type 0 than
MLR-LM
TEAM-H
Grain dry mattgr cont(,nt
0
Type I
MLR-H
Cry
0) or one (Type 1) parental
lvlarker data Median R'
PP-GS
for line per
for grain yield and grain
Efficiency of prediction
matter content of hybrids having no line evaluated in testcrosses
NA not zrpplicable
innprov,ement in R2 of
102.9 108.9
300.3 381.1 26.0
general r;ombining ability and per se performance of parental lines (C+/C-). The median prediction efficiency (R') was obtained across 300 cross-validation runs
GDMC there were practically no positive effects of
lcr.O 1Cr.8
Grain dry matter content
ering presence and absence of pedigree information (P+/P-) in combination with or withour modeling the covariance between
as havirng no testcrosses but being evaluated
r3.J
329.6 402.9 16.9
252.8 313.8
365.6 442.0 2r.0 104.5 tr2.6 2.5
0.41
Plediction was based on phenotypic data (PP-GS, PP-L) or phenotypic and AFLP marker data ('I'EAM-H, TEAM-LM). The underlying joint anaLlyses of hybrids and parental lines were performed consid-
innprov,ed
for orediction of of grain yield and grrrin
selected
drv matter content
c-
Grain yield
'Iype
Average number of
data
P+
c+
3
hybrid perfonmance and mid-parent
Type I
Type 0
0.
0.87
0.79
0.
0.77
0.75
0.
0.31
0.06
0.44
0.31
0.09
SSR
0.36
0.
l8
0.06
I\FLP
0.54
0.
0.74
0.62
AFLP*
0.54
0,
0;7
|
0.60
SSR
0.49
0.
0;76
0.71
I\FLP AFLP*
0.54
0.43
o.23
0.54
0.43
0.25
0.57
0.42
0,
0.75
ssR TEAM-LM I\FLP
l9
0.61
0.80
I\FLP*
0.63
0.80
0.74
SSR
0.65
0.82
0;76
Prediction was based on phenotypic
typic and AFLP marker data (MLR-
LM). The marker-based methods sets, namely ,AFLP, AFLP* (AFLP tions), and SISR. Reciprocal allelic marker loci in hybrids were pooled^fr The median prediction efficiency (R')
ata (PP-GS, PP-L) or phenoMLR-LM. TEAM-H. TEAII. applied to three marker data
imputed missing obsen'agurations of heterozygous estimation of marker effects obtained across 300 cror;s-
validation runs
6
Spring;er
Genet (2010) 120:451461
for Type I hybrids, which was most evident with PP-GS. Since fbr Type 0 hybrids no testcross observations for the respective parental lines were available, the information gain due to the pedigree-based covariance matrix was more
e:ffective. advantage
For HP prediction, this demonstrated the of covariance information among parents, if
performance of parental lines. Enhancements of the marker-
testcroris information is lacking.
The correlation between the per se performance of parental inbred lines and their testcross performance is expected to be lower for heterotic traits, such as GY in maize, than for nonieterotic traits, such as GDMC (IJallaurer and Miranda Filho 1988). Accordingly, for the
C-
models, the R2 values of the PP-L approaches were among the lowest for Gl( and highest for GDMC. Consideration of covariance between GCA and per se performance of parental lines increased the efflciency of HP prediction for both traits and both PP-models, especially of GDMCI for PP-GS. In th,e basic P-/C- rrrodel, the effic;iency of the PP-GS method to predict GDMC of hybrids was much lower than for PP-L. Thus, for GDMC, PP-GS benefitr:d from PP-L by taking into account the covariance between GCA and line per se performanco, and in some cases even to such an e;(tent. that R2 with PP-GS were slightly' higher than with P'P-L. For Type 0 hybrids, no field data on testcrosses were available for estimation of GCA of ttre respective parental lines, so that pedigree-based relationship matrices and covariance between GCA and line per se performance were the only sources of information. This lar:k of other information may explain the fact that the beneficial effect of C+ fc,r GDMC prediction with PP-GS was larger for Type 0 hybrids than for Type t hybrids and allso larger,
were superior with respect to R . In summary, the results r of joint analyses of revealed the high predictive pedigree-based relaticnhybrids ancl lines, which utili ship matrices and covariance GCA and per se
if no pedigree-based relationship matrices
were
Among the four mixed linear
prediction methods the P+/C+ moclel
showed the lowest AIC for GY hnd GDMC. and therefc,re was chosen to further investigah the effects of modific:a-
tions
of the
marker-based
ion methods on thoir
llffi ciencies for
of HP using an AFI.P with that usine an SSiR marker data set were com marker datar set, but did not reve]al a general superiority of one over thr: other. Considering tfre use of mapped marke:rs were estimated to be in this study, the total marker comparable or slightly lower for AFLP than for SSR dala. The genome coverage in terms of the number of hybrid allele confilgurations across all lpci was similar for AFLP and hieher information and SSR. Due to hisher effi ciencv.
R2
used.
The use of pedigree-based relationship matrices and covariance between GC,{ and per se performance of parental lines enabled the exploitation of additional information from related gen,otypes and resulted in a better model frt to phenotypic data, indicated by the AIC values. In gen,eral, both enhancr:ments also improved the efficiencies
of HP prediction, yet to a
varying
degree,
depending on the prediction method, trait and type of hybrid. The prediction ap,proaches that were restricted to ttre use of phenotypic and pedigree data were more sensi-
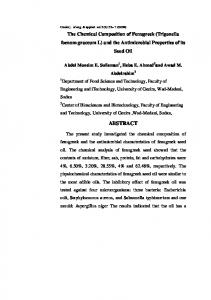
tive to the use of addilional information from related genotypes than those basod on markers (Fig. 1). For GY, ttre marker-based TEAM prediction approaches were often superior or at least similar to the PP approaches for their R2, if n,o pedigree-based relationship matrices were used. In the P+/C- case, the TE1.M approaches were comparable to PP-GS and clearly superior to PP-L. With the P+/C+ model, however, PP-GS achieved the highest R2. For the predictiion of GDMC basod on C- models, the TEAM-L (marker-based) and PP-LM (not marker-based) methods
4) springer
PtlC+ P+IC- P-/C+ P-IQ- P+/C+ P+/C- P-lC+ P-/QTEAM-H PP-GS Fig.
I
Efficiency ofprediction (R')
no or one oarr:ntal line evaluated in on estimates of general and specific
combinins abilities and AFLP
lying joint analyses of hybrids and considering prresence or absence of
grain yield for hybrids having Prediction was based ability (PP-GS) or data (TEAM-H). The und,:rtal lines were performed
information (P*/P-) in ine the covariance between without of parental lirLes general combining ability and per se (C+/C-). Ear:h of the eight boxplot nn^s corresponds to a specific R'values, which in cro;sprediction scenario and comprises and predicted performance of validation wene obtained from
combination with
hybrids
or
Theor Appl Genet (2010) 120 451461
content per SSR marker locus, the initial number of a'vailable SSR markers was lower than for AFLP markers. Consequently, fewer ma'kers were found to be significantly associated with the traits under study. Markers with missin6l observations in the respective data sample had to be excluded from the MILR analyses. This reduced the number of available SSIR markers approximately by a factor of ten (data not shown), which can be the reason for the very low numbers of selected SSR markers for MLR. Whe:n estimating the r:ffects separately for reciprocal
alllelic configurations of heterozygous marker loci in hybrids, a reduced estimation error of marker effects and irnproved efficiency for EtP prediction would be expected under the assumption that heterotic groups differ in their linkage disequilibria betw,een marker and QTL alleles. The advantage of such a fine distinction of allelic configurations is assor:iated with the disadvantage of higher numbers of configurations, Given n allleles for one locus, the maximum numbel of hybrid marker tgenotypes is (n2 + n)12 for Hetl, and a higher number of rr2 configurations for Het2. Consequenily, an increase of the average number of conflgurations was observed, resulting in a reduced number of observations per configuration. For the TEAM approaches, each rnarker was tested separately, so that the adverse effects on prediction may lrc smaller, However, in the MLR approach, all markers included in the model were fitted simultaneously. This could explain the considerable reduction in the numbt:r of selected markers. Both, advantage and disadvantage together, may explain the small differences in R2 belween Hetl and Het2. Population substructure within heterotic pools, e.g., Iodent and StiffStalk subgroups within ttLe dent pool, may be important. Howev,gr, such further differentiation of alleles and their effects would aggravate the problem of large numbers of allelic configurations. An,other problem when identifying mLarkerl associated with HP is the relationship among inrdividuals. The true number of uncorrelated observations and therefore the degrees of freedom remain veiled, which mray lead to false-positive marker associations in the MLR
or TEA.M approaches. Missring marker observations in the AFLP data set were
innputed using NPUTE sc,ftware (Roberts et al. 2007). In thLis imputed data set AFLP* with no missing observations, thLe nurnber of markers rt:tained after assessment of data quality was higher (891 rLnstead of 732). The number of rnarkers that were selectr:d by TEAM or MLR for their association with GY and CIDMC was increased by a similar degree. However, R2 values of TEAM differed only marginally between the imputation approach (AFLp*; and the originalL approach (AFLP), which substituted missing estirnates of marker effects with average values. This indicated that bol,h approaches were comparable in their potential to handle missing observations in the analyzed marker data
set of AFLP markers. For the approach, howevr:r, markers cannot be used for HP tion if one or more observations are missing. Thu improved R2 were especially expected for the MLR if applied to the for hybrid GY preAFLP* datia set. This was diction wittr MLR-H only, howe , not in the other cast:s. Altogether, the effects of imputi missine observations on HP prediction were small. W a drop-out rate of 7-3Vo expected proportion of and N: /!t genotyped inbreds, usable marlkers is 9-457o. whi is similar to what was observed for MLR in the curren study (data not shown). ing programs with very However', in commercial large numb,er of analyzed lines, this limitation will roD-out rate of 0.5Vo u:rd be even more severe. With a I only 0.7Vo of all marker with N: 1,000 genotyped I h is a highly inefficient loci would be usable for MLR, use of marlker data. Thus. with an increasing amount of genotyping data, imputing mi ing marker observations seems to remain an issue. Also. for higher map densitios, the efficiency of predicting mi ins marker observations ly linked markers is flrom observed genotypes of expected to increase due to the h
The ioint effect of two modi guishing rer:iprocal allehc con marker loci in hybrids (Het2) observations in marker data ( increase of R' for prediction of general, however, the modifica approaches had no clear effect ( Conclusions for the application
r linkage disequilibrl a. ons, namely (l) distinurations of heterozygous (2) imputing missing resulted in a slight Y mainly for MLR-H. In
of the marker-based o)\
breeding programs
of hybrids, the PP-GS For the predtiction of GY and G approach was superior to PP-L nd marker-based approaip measures and covaiches, if pedligree-based relati performance were used. ance between GCA and line per
The choice of model for analv had a considerably higher i cations of rnarker-based a that owins 1,o the relatedness in
the relationship between eration of pedigree information resulted in the highest prediction
the non-marker approaches untested hybrid, phenotypic
of the phenotypic data on R2 than the modifl. It was demonstrated, breedine materials and
and inbreds, the consid-
f) and per se data (C-F) fflciencies, especially for -GS and PP-L. For iln of its parents per se p€:r-
formance o.r of hvbrids sharine
common parenl can
regarded as estimators for the evant genes in that hybrid. that share one of the parents of and also no per se performance
I effects of all trait-rel-
then markerr-based approaches
the potential to improve
the
superior hybrids, Molecular
l)e
r, if no hybrids exir;t, hybrid to be predicted, its parents is available, prediction of HP ha've fficiency of identifying data may substitute
fl
Spring;er
Theor Bemardo R (1999) Marker-assisted single-cross performance. Crop Bernardo R (2002) Breeding for Press. V/oodburv Bozdogan H. (1987) ModeJ criterion (AIC): the general
Dudley JW, Saghai Maroof MA markers and grouping of Crop Sci 3l:718J23 Fischer S, M