Proceedings of the ASME 2007 International Design Engineering Technical Conferences & Computers and Information in Engineering Conference IDETC/CIE 2007 September 4-7, 2007, Las Vegas, Nevada, USA
DETC2007-35580
PREFERENCE INCONSISTENCY IN MULTIDISCIPLINARY DESIGN DECISION MAKING Erin MacDonald* Ph.D. Candidate Department of Mechanical Engineering
Richard Gonzalez Professor Department of Psychology
Panos Papalambros Professor Department of Mechanical Engineering
University of Michigan Ann Arbor, Michigan 48109 *Corresponding author email:
[email protected]
ABSTRACT Research from behavioral psychology and experimental economics asserts that individuals construct preferences on a case-by-case basis when called to make a decision. A common, implicit assumption in engineering design is that user preferences exist a priori. Thus, preference elicitation methods used in design decision making can lead to preference inconsistencies across elicitation scenarios. This paper offers a framework for understanding preference inconsistencies, within and across individual users. We give examples of three components of this new framework: comparative, internal, and external inconsistencies across users. The examples demonstrate the impact of inconsistent preference construction on common engineering and marketing design methods, including discrete choice analysis, modeling stated vs. revealed preferences, and the Kano method and thus QFD. Exploring and explaining preference inconsistencies produces new understandings of the relationship between user and product. Keywords: customer preference; preference construction; context effect; utility theory; multidisciplinary design; decision making; Kano; discrete choice analysis; conjoint analysis; preference model 1. INTRODUCTION A common, implicit assumption in engineering design is that user preferences exist a priori: preferences exist as a “database” in the users’ mind which they query when making product-related decisions. While designers cannot directly
access such a database, they can create models derived from it. For example, utility methods for estimating preferences are sometimes used as if such a database exists and has a particular structure. Products are then designed and optimized using these measurable user preference models. Research in behavioral psychology over the past thirty years has challenged this view of user preferences, finding instead that people construct preferences as needed on a case-by-case basis in response to the decision at hand. The phenomenon is referred to as preference construction [1]. Such research has shown violation of the utility theory assumptions, such as rationality, and that preferences can change in response to question phrasing. In certain decision scenarios with a choice between two outcomes, question phrasing has triggered shifts in preference from one option to the other, termed a preference reversal [1]. Survey design plays a large role in preference outcome, and important decisions of juries and doctors are prone to inconsistencies based on the context in which their preferences are elicited [2, 3]. As multidisciplinary design increasingly integrates engineering models with models from other disciplines, including marketing, sensitivity to the limitations of models is increasingly warranted, so that better design insights can be gained. Preference construction theory has yet to be incorporated into the preference elicitation models and methods used in engineering design. Within the preference elicitation tools that product designers currently use, preference construction can lead to preference inconsistency. It is important to emphasize that preference inconsistency is symptomatic of two or more
1
Copyright © 2007 by ASME
different preference constructions, and, in order to identify a preference inconsistency, at least two measurements of customer preference must be performed using separate preference elicitation methods. This paper suggests a new framework for understanding preference inconsistencies and gives three examples of different preference inconsistencies important in engineering design. The examples also serve to demonstrate the research potential of incorporating preference construction theory into engineering design research. We begin by introducing a new conceptual framework that helps categorize the research in construction of preferences from other fields, and subsequently allows us to apply this research within engineering design. We define two general types of preference inconsistency. The first is within-user inconsistency, in which a user may construct preferences with dependence on, for example, mood or amount of time available to interact with the preference elicitation tool. This type of inconsistency manifests, for example, in measured properties of error and/or variance in consumer preference models. The second type is the across-user inconsistency, wherein a group of users are all inconsistent in their preferences in a similar and explainable manner. This type of inconsistency manifests in the estimated parameters of the model, and may also contribute to within-user inconsistency. Note that this is different from preference heterogeneity, in which model parameters account for differences in preferences between users or groups of users. To further explain the concept, we define three different types of across-user inconsistency that are useful in engineering design work: comparative, external, and internal. We define a comparative inconsistency as an inconsistency identified by comparison of preference constructions from different groups of users in response to very similar preference elicitation procedures. It is termed comparative because it requires comparisons of preferences between sets of users. We define an external inconsistency as occurring when a group of users exhibits a mismatch between stated preferences in a preference elicitation procedure and revealed preferences gathered from purchase history. It is termed external because it requires the examination of preferences determined outside of the preference elicitation process to identify the inconsistency. We define internal inconsistency as occurring when a preference structure determined for a group of users in one part of a preference elicitation procedure fails to explain or is contradictory to the preference behavior demonstrated separately by the same group of users in another part of the preference elicitation procedure. It is termed an internal inconsistency because it is identified by examining results of one preference elicitation procedure, e.g., a survey, without using outside information, such as different versions of the same elicitation procedure or purchase information. The paper offers one example each of our categorizations of comparative, external, and internal inconsistencies. Each example comes from a different form of preference elicitation: Kano category classification, capturing the voice of the customer in Quality Function Deployment; discrete choice
survey analysis, with small manipulations in survey formulation causing large inconsistencies in preference; and a combination approach, where discrete choice survey analysis, buy/not buy scenarios, and past purchase information are all used to demonstrate inconsistency in preference construction. In all three examples, inconsistent preference construction does not serve to discredit the method at hand, but instead adds increased insight to design knowledge. The first example shows that consumers perceive a strong relationship between ‘quilting’ and absorbency in paper towels. In a previous publication, the approach was generalized to a methodology that detects the “sentinel/crux” attribute relationship in products [4]. The second example demonstrates that a large market potential for eco-friendly paper towels could be created through the activation of a particular preference construction for a group of users. The third example suggests it is more difficult for people to consistently imagine necessity than it is for people to consistently imagine delight. 2. LITERATURE REVIEW 2.1 Behavioral Psychology, Economics, and Marketing Researchers have repeatedly used context effects, a particular type of across-user comparative preference inconsistency, to discredit theories and assumptions of psychology and economic behavior. For excellent literature reviews, refer to Slovic, who cites over forty papers on the subject, and Kagel and Roth’s Handbook of Experimental Economics, which devotes several chapters to related work from a variety of fields [1,5]. The phenomenon of preference reversal has been well-documented with the help of context effects, observed when different phrasings of a choice question are shown to result in different experimental outcomes. If a user appeals to an internal database through a query, then the same preference should emerge independent from particular contextual variables. The finding that different choices result from manipulations of context is taken as evidence that users do not query a database but rather construct their preferences. A classic example is that “it is possible to construct pairs of lotteries with the property that many people, when asked at what price they would be willing to sell (or buy) the lotteries, put a higher price on one, but when asked to choose which they would prefer to participate in, choose the other” [5]. Display effects, such as horizontal vs. vertical positioning of choice sets have also been demonstrated [5]. In multiple choice surveys, such as discrete choice, it has been found that “how one feels about an attribute level (say, 35 mpg) depends critically on the competing levels of the other alternatives (say, 30 or 40 mpg)” and “continuous attributes are biased upward compared with categorical attributes” [6]. The experimental economics community has demonstrated that willingness to pay, and thus utility theory, is contingent upon different context effects and preference constructions. Tversky and Kahneman employed context effects to discredit
2
Copyright © 2007 by ASME
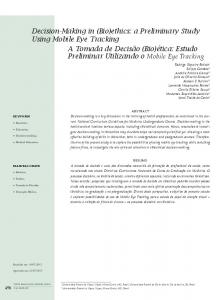
Figure 1: Propagation of preference construction through Michalek’s engineering/marketing ATC Formulation
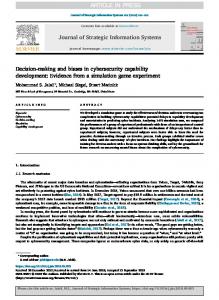
Figure 2: Propagation of preference construction through Wassenaar et al.’s decision-based-design flow chart rational choice behavior modeling [5, 7]. The experimental economics community has documented violations of both “description invariance” and “procedure invariance,” which claim that despite different representations and elicitation procedures, the same choice problem should always result in the same preferences. Camerer an experimental economist, explains: “Invariance violations are especially troublesome for utility theories… The most famous violations of description invariance are “framing effects.” Reversals of preference are induced by changes in the reference points… the most pressing question is whether framing effects are systematic and predictable. The evidence is mixed” [5].
2.2 Decision-Based-Design Within-user preference inconsistency, which can manifest as preference model variance, has been addressed previously by Luo et. al., and Besharati et. al.[8, 9], They use robust design to address the variance of consumer preference parameters in an interdisciplinary marketing/engineering design optimization. As many engineering design frameworks accept variance in parameters, within-user inconsistency can be dealt with in this fashion. This approach cannot address across-user inconsistencies, as these inconsistencies manifest not necessarily in model variance, but instead in model parameters, with potential implications in variance and error terms as well. This will be demonstrated in the discrete choice analysis example in Section 3.
3
Copyright © 2007 by ASME
Pullman et. al. notice the effects of across-user inconsistency, without noting it as such, in their comparison of preferences elicited from QFD and conjoint analysis, stating that optimal products designed using the two different preference elicitation processes varied on important features. They claim the difference stems from “what customers say they want and what managers think will best satisfy customer needs,” which is another way of stating that managers are attempting to compensate for preference inconsistencies between point of evaluation, purchase and use [10]. The effects of across-user preference construction are highlighted in the grey overshadow of two design methodology frameworks proposed by Michalek and Wassenaar illustrated in Figures 1 and 2 [11, 12]. These figures serve to demonstrate how preference inconsistencies become involved in and propagate through design processes. Michalek’s framework only takes one measurement of customer preference, so inconsistencies will not be identified or addressed. Wassenaar’s generalized framework includes three sources of preference construction, and these constructs will interact in the framework. In this framework, there is potential for the identification of external inconsistencies with modifications to the framework, for example by comparing collected customer preferences and existing market data. Designers also experience preference construction in their design decisions. In deciding between conflicting preferences, preference structure inconsistencies may lead to different products. Preference construction research has shown that rewording questions can change indifference points between two alternatives, and can change preference for one alternative over another, impacting design decisions that use the hypothetical equivalents/inequivalents approach [13]. See et al. state that “a designer’s stated preferences may result in intransitive preference structures.” This a typical result of the context effect experiments mentioned previously. It may seem viable to combat intransitivity or dampen preference inconsistency by asking designers to explain their preferences, but this leads to confirmation bias and bolstering, in which people reconstruct their preference structures after making a decision in order to substantiate their choice [14, 15]. Kulok and Lewis develop a method to correct for this within-user (in this case, within-designer) preference inconsistency without, necessarily, input from the designer [16]. Interestingly, Gurnani and Lewis found that relaxing the assumption of rationality by introducing error into a model of designer decisions (the construction of preferences) leads to convergence and optimality in decentralized design [17]. Survey used in Sections 3 and 4: Components of a 217-respondent survey on paper towels are used to demonstrate comparative and external inconsistencies. The six-part survey was administered by Luth Research [18] via the internet. Respondents received one dollar for participating. The survey was designed and the results were analyzed using Sawtooth Software [19]. The
survey structure is summarized in Table 1. Results from Part I were presented at ICED2007 and are summarized in Section 3 to demonstrate a comparative inconsistency [4]. This paper and [4] were written in tandem. This paper serves to define a framework of preference inconsistencies and discuss illustrative examples, while [4] concentrates on introducing a new methodology based on the identification of comparative preference inconsistency. Results from Parts II, IV, and V are analyzed in Section 4 as new contributions and an example of external inconsistency. Table 1: Overview of paper towel survey Part I Discrete Choice I 3 versions
Part II Discrete Choice II 1 version
Part III Rate Brand PerformAnce
Part IV Past Purchase Info.
Part V Buy/Not Buy Scenarios
Part VI Demographics
3. COMPARATIVE INCONSISTENCY IN DISCRETE CHOICE ANALYSIS In Part I, three different groups of approximately 70 users were given a discrete choice survey and chose between paper towels with the different attributes and levels as described in Table 2. An example question from survey Part I, version A, is shown in Figure 3. Group A took survey version A, which did not mention towel absorbency, softness, or strength. Group B took survey version B, which was slightly ‘manipulated’: absorbency, softness, and strength were mentioned as product attributes but with exactly the same “average” level of 2 out of 3 across all possible answers. Note that this “average” level information was identical across all profiles, all respondents, and all choice tasks. Group C took survey version C, in which absorbency, softness, and strength were presented with varying levels, like the other towel attributes: softness (rating of 1, 2, 3 out of 3), absorbency (rating of 1, 2, 3 out of 3), and strength (rating of 1, 2, 3 out of 3). Note that these rating scales were not purely ordinal, as the survey began with descriptions of each rating, i.e., “Absorbency: A rating of 1 out of 3 can absorb a 2.5 inch water spill (About the same size around as a tomato slice).” These rating descriptions were available as a pop-up window with every question. A multinomial logit model (McFadden's Conditional Logit) was fit to each group’s answers using Sawtooth CBCHB [20]. This model allows us to obtain estimates of preferences for each individual and relies on Bayesian estimation techniques [21]. The estimated parameters were normalized using the “full factorial marketplace normalization technique,” an original method of the authors explained in more detail in [4], in order to compare the different models, because utility measurements cannot be compared directly across models due to scaling effects. In the full factorial market, part worth utilities are used to predict the choice share of every possible product (every combination of attribute/levels), assuming every possible product is available for selection. Full factorial choice shares are calculations of the utility of each product in the marketplace divided by the sum of utility of all possible products. While
4
Copyright © 2007 by ASME
Table 2: Attributes and Levels Present in Versions A, B, and C of survey Part I Attribute Version A N=70 Version B N=73 Version C N=74
Strength
Softness
Absorbency
2 out of 3
2 out of 3
2 out of 3
1,2, or 3 out of 3
1,2, or 3 out of 3
1,2, or 3 out of 3
Quilting
Recycled Paper Content
Packaging
Pattern
Quilted or Not Quilted Quilted or Not Quilted Quilted or Not Quilted
0, 30, 60, or 100%
1,2,or 3 Rolls
0, 30, 60, or 100%
1,2,or 3 Rolls
0, 30, 60, or 100%
1,2,or 3 Rolls
Patterned or Not Patterned Patterned or Not Patterned Patterned or Not Patterned
Figure 3: Example questions from survey Part I, versions A
Figure 4: Aggregated Full Factorial Market Shares across survey versions utility between separate model estimations cannot be compared, full factorial marketplace measures can. The full factorial marketplace includes all possible levels of all attributes in all possible combinations, thus avoiding related model artifact problems. Full factorial choice shares are aggregated across all products that contain a particular attribute/level, to create a measurement we term the aggregated full factorial market share. As with utility part worths, a higher aggregated full factorial market share means a higher preference, and a larger spread between aggregated market shares for the levels of one attribute means that attribute is more important in the choice decision than others.
Figure 4 shows the aggregated full factorial market shares for the attributes and levels of quilting, pattern, packaging, and recycled paper content across the three groups. Group A, which knew nothing about the towels’ absorbency, had a high preference for quilted paper towels. Absorbency was included as average across all choices for Group B, and their preference for quilting was significantly less. For Group C, which saw varying levels of absorbency in their available towel choices, quilting approaches the importance of the more trivial attributes of pattern and packaging. This difference in preference structure between versions A and B is particularly interesting because these versions shared exactly the same choice options.
5
Copyright © 2007 by ASME
Figure 5 shows the estimated part worths for quilting in more detail, with standard error bars. If Besharati et al.’s [9] integrated marketing and design robust optimization approach had been used with version A of this survey, it would have found that quilting was an important attribute in the design of the paper towel, but not so for versions B and C. Since the across-user preference inconsistency affects the parameter and potentially also variance and error, their approach would lead to different robust optima dependent on the construction of preferences.
Figure 5: Preference for quilted over not quilted A main effects analysis was also performed using Sawtooth’s SMRT ‘Counts’ interface [22]. The independent variables were the attributes, and the dependent variable was choice. In version A, Recycled Paper Content and Quilting were significant predictors of choice (p