Conceptual Model of Net Infiltration for the Death Valley Region. ..... 3. Precipitation and recharge estimates for 36 hydrographic areas and subareas in the Great Basin located ..... The authors wish to thank many individuals who provided ...
Preliminary Estimates of Spatially Distributed Net Infiltration and Recharge for the Death Valley Region, Nevada–California By JOSEPH A. HEVESI, ALAN L. FLINT, and LORRAINE E. FLINT
U.S. GEOLOGICAL SURVEY Water-Resources Investigations Report 02-4010
Prepared in cooperation with the
7218-32
NEVADA OPERATIONS OFFICE, U.S. DEPARTMENT OF ENERGY, under Interagency Agreement DE-AI08-96NV11967
Sacramento, California 2002
U.S. DEPARTMENT OF THE INTERIOR GALE A. NORTON, Secretary U.S. GEOLOGICAL SURVEY Charles G. Groat, Director
The use of firm, trade, and brand names in this report is for identification purposes only and does not constitute endorsement by the U.S. Geological Survey.
For additional information write to:
Copies of this report can be purchased from:
District Chief U.S. Geological Survey Placer Hall, Suite 2012 6000 J Street Sacramento, CA 95819-6129
U.S. Geological Survey Information Services Box 25286 Federal Center Denver, CO 80225
CONTENTS Abstract .................................................................................................................................................................................. Introduction ........................................................................................................................................................................... Study Area Description................................................................................................................................................ Geographic Setting ............................................................................................................................................ Climate............................................................................................................................................................... Hydrogeology .................................................................................................................................................... Surface Water..................................................................................................................................................... Ground Water..................................................................................................................................................... Soils ................................................................................................................................................................... Vegetation .......................................................................................................................................................... Previous Work.............................................................................................................................................................. Acknowledgments ....................................................................................................................................................... Conceptual Model of Net Infiltration for the Death Valley Region....................................................................................... Processes Controlling Net Infiltration ......................................................................................................................... Development of a Conceptual Model of Net Infiltration............................................................................................. Precipitation................................................................................................................................................................. Evapotranspiration....................................................................................................................................................... Surface Water and Infiltration...................................................................................................................................... Shallow Infiltration ............................................................................................................................................ Surface Water (run-on/runoff) ........................................................................................................................... Redistribution and Net Infiltration..................................................................................................................... Processes at the Soil–Bedrock Interface............................................................................................................ Estimation of Net Infiltration................................................................................................................................................. Overview of Preliminary Net Infiltration Model (INFIL) ........................................................................................... Model Grid .................................................................................................................................................................. Model Inputs................................................................................................................................................................ Precipitation....................................................................................................................................................... Spatially Distributed Basin Properties............................................................................................................... Soils ......................................................................................................................................................... Rocks ....................................................................................................................................................... Model Calculations...................................................................................................................................................... Energy Balance Calculations............................................................................................................................. Solar Radiation ........................................................................................................................................ Air Temperature....................................................................................................................................... Calculation of Evapotranspiration ..................................................................................................................... Calculation of Net Infiltration Using a Root-Zone Water Balance Model ........................................................ Overview of the Root-Zone Water Balance............................................................................................. Daily Water-Balance Calculations........................................................................................................... Soil and Bedrock Properties Used to Calculate Net Infiltration .............................................................. Assumptions and Model Limitations........................................................................................................................... Model Results ........................................................................................................................................................................ Description of Preliminary Net Infiltration Model Results ......................................................................................... Comparison of Preliminary Net Infiltration Model Results with Estimates of Spatially Distributed Recharge ......... Comparison of Preliminary Net Infiltration Model Results with Previous Basinwide Estimates of Recharge........... Summary................................................................................................................................................................................ References Cited....................................................................................................................................................................
Contents
1 1 3 3 3 5 5 5 5 5 8 8 9 9 10 10 11 11 11 12 12 13 13 13 14 14 14 15 15 15 15 15 15 16 16 17 17 17 19 20 20 20 22 26 33 34
III
FIGURES 1. Death Valley region study area location and regional ground-water model area..................................................... 2. Average annual precipitation estimated for the Death Valley region....................................................................... 3. Generalized surface geology and corresponding saturated bulk hydraulic conductivity for the Death Valley region ............................................................................................................................................................ 4. Soil classes for the Death Valley region................................................................................................................... 5. Water-balance processes controlling net infiltration................................................................................................ 6. Estimates of percentage cover of vegetation in the Death Valley region ................................................................. 7. Simulated net infiltration for 1980–1995 for the Death Valley region..................................................................... 8. Modeled net infiltration using INFIL, and estimated recharge using the Maxey–Eakin modified method and cokriged precipitation ....................................................................................................................................... 9. Comparison of recharge estimated using INFIL and the modified Maxey–Eakin model both with the 1980–1995 precipitation estimates .......................................................................................................................... 10. Selected hydrographic areas of the Great Basin ...................................................................................................... 11. Comparison of modeled net infiltration and estimated recharge volumes with precipitation volumes for areas receiving at least 200 millimeters average annual precipitation within hydrographic areas of the Death Valley region........................................................................................................................................ 12. Comparison of modeled net infiltration and estimated recharge to previous estimates of recharge........................
2 4 6 7 9 18 21 23 27 29
30 33
TABLES 1. Properties of soils used in model ............................................................................................................................ 2. Summary of precipitation, modeled net infiltration, and estimated recharge using Maxey–Eakin methods for the area of the Death Valley region ground-water flow model.......................................................................... 3. Precipitation and recharge estimates for 36 hydrographic areas and subareas in the Great Basin located within or adjacent to the Death Valley region......................................................................................................... 4. Estimated precipitation and recharge volumes for areas within the 200-mm average annual precipitation isohyet, obtained for 21 hydrographic areas and subareas using cokriged estimates of average annual precipitation and the modified Maxey–Eakin model.............................................................................................. 5. Estimated precipitation and net infiltration volumes for areas within the 200-millimeter per year average annual precipitation isohyet, obtained for 21 hydrographic areas and subareas using 1980–1995 modeled precipitation and net infiltration..............................................................................................................................
CONVERSION FACTORS, VERTICAL DATUM, AND ABBREVIATIONS AND ACRONYMS Multiply
millimeter (mm) meter (m) kilometer (km) square kilometer (km2) millimeter per year (mm/yr) millimeter per day (mm/d) cubic meter per year (m3/yr) bar
By
0.03937 3.281 0.6214 0.3861 0.00328 0.00328 0.0008107 0.1
To Obtain
inch foot mile square mile inch per year inch per day acre-foot per year megapascal
Temperature is given in degrees Celsius (°C) which can be converted to degrees Fahrenheit (°F) by the following equation: °F =1.8(°C) + 32.
IV
Contents
15 25 28
31
32
Vertical Datum Elevation, as used in this report, refers to the altitude of the ground surface above sea level, where sea level refers to the National Geodetic Vertical Datum of 1929 (NGVD of 1929)—a geodetic datum derived from a general adjustment of the first-order level nets of both the United States and Canada, formerly called “Sea Level Datum of 1929.”
Horizontal Datum All map units and projections in this report are in the Universal Transverse Mercator system, North American Datum of 1927 (NAD27), zone 11, in meters.
Abbreviations and Acronyms ENSO
El Niño Southern Oscillation
CMB
chloride mass balance
DEM
digital elevation model
GIS
geographic information system
INFIL
Net Infiltration Model
NTS
Nevada Test Site
USGS
U.S. Geological Survey
UTM
Universal Transverse Mercator
Contents
V
Preliminary Estimates of Spatially Distributed Net Infiltration and Recharge for the Death Valley Region, Nevada–California By Joseph A. Hevesi, Alan L. Flint, and Lorraine E. Flint ABSTRACT A three-dimensional ground-water flow model has been developed to evaluate the Death Valley regional flow system, which includes ground water beneath the Nevada Test Site. Estimates of spatially distributed net infiltration and recharge are needed to define upper boundary conditions. This study presents a preliminary application of a conceptual and numerical model of net infiltration. The model was developed in studies at Yucca Mountain, Nevada, which is located in the approximate center of the Death Valley ground-water flow system. The conceptual model describes the effects of precipitation, runoff, evapotranspiration, and redistribution of water in the shallow unsaturated zone on predicted rates of net infiltration; precipitation and soil depth are the two most significant variables. The conceptual model was tested using a preliminary numerical model based on energy- and water-balance calculations. Daily precipitation for 1980 through 1995, averaging 202 millimeters per year over the 39,556 square kilometers area of the ground-water flow model, was input to the numerical model to simulate net infiltration ranging from zero for a soil thickness greater than 6 meters to over 350 millimeters per year for thin soils at high elevations in the Spring Mountains overlying permeable bedrock. Estimated average net infiltration over the entire ground-water flow model domain is 7.8 millimeters per year. To evaluate the application of the netinfiltration model developed on a local scale at
Yucca Mountain, to net-infiltration estimates representing the magnitude and distribution of recharge on a regional scale, the net-infiltration results were compared with recharge estimates obtained using empirical methods. Comparison of model results with previous estimates of basinwide recharge suggests that the net-infiltration estimates obtained using this model may overestimate recharge because of uncertainty in modeled precipitation, bedrock permeability, and soil properties for locations such as the Spring Mountains. Although this model is preliminary and uncalibrated, it provides a first approximation of the spatial distribution of net infiltration for the Death Valley region under current climatic conditions.
INTRODUCTION The Death Valley regional ground-water flow system received attention in the late 1980’s because of its contribution to the ground-water flow system of the Nevada Test Site (NTS) and Yucca Mountain, Nevada, centrally located in the Death Valley regional groundwater flow system (Bedinger and others, 1989). The boundary used for the net-infiltration model in this study that provides the upper boundary condition to the ground-water flow model is referred to in this study as the Death Valley region (fig. 1). Besides being applicable to investigations regarding radioactive contaminant transport at Yucca Mountain, a potential high-level waste repository, the Death Valley regional ground-water flow system is of interest to investigations of potential contaminant transport in ground water beneath the NTS.
Introduction
1
Figure 1. Death Valley region study area location and regional ground-water model area.
2
Preliminary Estimates of Spatially Distributed Net Infiltration and Recharge for the Death Valley Region, Nevada–California
The U.S. Geological Survey (USGS) is developing a regional saturated-zone ground-water flow model for the Death Valley region (D’Agnese and others, 1997), for which the quantity and spatial distribution of net infiltration and the response to potential future climatic conditions are needed. The purpose of this report is to present a conceptual model of net infiltration in the Death Valley region under current climatic conditions, to represent the conceptual model of net infiltration with a preliminary numerical model that estimates the quantity and spatial distribution of net infiltration in the Death Valley region, and to compare estimates of net infiltration from the model with estimates of recharge obtained using empirical methods and previous estimates of recharge in the Death Valley region. The conceptual model is a regional extension of the conceptual model of net infiltration for Yucca Mountain (Flint and others, 2000, 2001a,b; Hevesi, 2001) and describes the effects of precipitation, overland flow, evapotranspiration, and redistribution of water in the shallow unsaturated zone on predicted rates of net infiltration. The preliminary numerical model of net infiltration for the Death Valley region is an extension of the numerical model of net infiltration for the Yucca Mountain site, first developed and applied in 1996 and used in subsequent applications to help define upper boundary conditions for unsaturated zone flow and transport models (Flint and others, 2000, 2001a,b; Hevesi, 2001).
Study Area Description Geographic Setting
The Death Valley region is in the southern Great Basin, in the Basin and Range physiographic province (Grayson, 1993). The Basin and Range is characterized by linear mountains and broad valleys with a distinct north-to-northwest trend. This physiography is dominantly the result of normal faulting in response to east-west extensional tectonics. The southern and central parts of the Death Valley region are in the northern Mojave Desert, and the northern part extends into the Great Basin Desert. Elevations range from 86 m (meter) below sea level at Death Valley to 3,600 m above sea level in the Spring Mountains. The relief between valleys and adjoining mountain locally exceeds 1,500 m (Bedinger and others, 1989). The mountain ranges occupy only about 25 percent of the landscape in the study area (fig. 1), with the remainder occupied by broad intermountain basins filled with alluvium and some interbedded volcanic deposits (Peterson, 1981).
The Death Valley region consists of many topographically closed basins and surface water drainages. The lowest elevations of the basins and valley bottoms tend to be broad and have nearly flat surfaces. The Amargosa River, an intermittent stream in the Amargosa Desert (fig. 1), is the largest surface water drainage system in the Death Valley region with a drainage basin encompassing approximately 15,000 km2 (square kilometer). The Amargosa drainage basin discharges into the south end of the Death Valley saltpan, which forms the largest playa lake in the Death Valley region (Hunt and others, 1966). Playas, common to arid environments, occur at the lowest elevations of closed basins in the Death Valley region and act as catchments for surface-water runoff (Grose and Smith, 1989). The playa lakebeds are usually dry, but may contain shallow, temporary lakes during wetter than average years. Climate
The climate in the Death Valley region is arid to semiarid. The northern part of the region is in the Great Basin Desert, and is characterized by warm, dry summers, and cold, dry winters. The southern part of the region is in the Mojave Desert, and is characterized by hot, dry summers and warm, dry winters. The central part of the region includes the area around the NTS, about 48 km (kilometer) northeast of Yucca Mountain (fig. 1). This area has been called the Transition Desert (Beatley, 1976), and represents a gradational zone between the Great Basin and Mojave Desert climates. Weather patterns in the Death Valley region vary seasonally. Summer precipitation primarily comes from the south and southeast. Winter winds carrying precipitation flow from the west, resulting in a regional rain shadow east of the Sierra Nevada. The average annual precipitation for the Death Valley region is 190 mm/yr (millimeter per year). However, orographic effects cause substantial spatial variability in precipitation. Precipitation averages 125 to 150 mm/yr or less on the valley floors of the Amargosa Desert, 100 to 125 mm/yr for basins at lower elevations in the southern part of the region, and 50 to 75 mm/yr for the bottom of Death Valley. Average precipitation at higher elevations in the mountains is greater than 200 mm/yr (fig. 2). In the Sheep Range and Spring Mountains (fig. 1), the highest ranges in the region, precipitation is greater than 450 mm/yr (fig. 2). The mean annual freewater surface evaporation for the region ranges from 1,250 mm/yr in the mountains to greater than 2,500 mm/yr in the playas (Bedinger and others, 1989).
Introduction
3
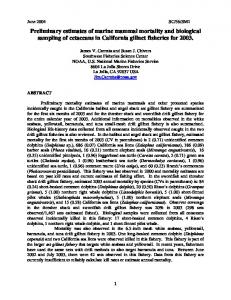
Figure 2. Average annual precipitation estimated for the Death Valley region. (Black circles represent locations of precipitation stations). mm/yr, millimeter per year.
4
Preliminary Estimates of Spatially Distributed Net Infiltration and Recharge for the Death Valley Region, Nevada–California
Hydrogeology
The hydrogeology of the Death Valley region has been described in detail by D’Agnese and others (1997). Primarily using relative differences in saturated hydraulic conductivity, geologic units were generalized by D’Agnese and others (1997) and Turner (1996a) into 10 hydrogeologic units (fig. 3) that have considerable lateral extent and reasonably distinct hydrologic properties. Estimates of saturated hydraulic conductivity used in this study range from a minimum of 0.4 mm/yr for granitic intrusives to a maximum of 700,000 mm/yr for valley fill deposits (fig. 3). Consolidated hydrogeologic units having high saturated hydraulic conductivity include the Paleozoic carbonates (36,000 mm/yr) and Mesozoic sandstones (18,000 mm/yr). Consolidated units having low saturated hydraulic conductivity include Precambrian metamorphics (20 mm/yr) and rhyolitic ash flow tuffs (40 mm/yr). Surface Water
Perennial surface water is sparse in the Death Valley region. Several perennial streams, however, originate from snowmelt in the high elevations of the Spring Mountains and have highly variable flows during wet years, and almost imperceptible flows during dry years. Streams fed from large-discharge springs along the middle sections of the Amargosa River in the Amargosa Desert (fig. 1) have the most consistent perennial flow. Temporary playa lakes form in some basins in response to runoff during wetter than average years, but are depleted by evaporation during average and drier than average years.
precipitation or snowmelt. Precipitation and runoff at the lower elevations generally do not recharge the system owing to lower precipitation and higher potential evapotranspiration rates. Discharge from the ground-water system, as flow from springs or as evapotranspiration from shallow water tables, occurs in several areas within local and subregional flow systems in response to topographic, stratigraphic, and structural controls. In general, the most significant locations of ground-water discharge occur at relatively low elevations in the Amargosa Desert and Death Valley. Soils
Soils in the Death Valley region can be grouped into upland soils on the mountains and in areas characterized by rugged topography; valley fill soils on alluvial fans and terraces; playa soils on valley bottoms and playa basins; and channel soils in active stream channels (fig. 4). Upland soils are usually less than 1 m thick, exhibit a coarse texture with little moistureholding capacity, and have high permeability. The valley fill and playa soils are much thicker than the upland soils, and medium- to coarse-textured, and highly permeable, whereas playa soils have finer grained soils characterized by a high percentage of clays or evaporites that include silicified hardpans (Beatley, 1976) and a much lower permeability than valley fill and upland soils. Soils in active channels tend to be coarse-textured and more permeable than the soils of the surrounding terraces and interchannel areas of alluvial fans. Vegetation
Ground Water
The predominant direction of flow for both surface water and ground water in the region is generally from north to south, the direction of average elevation loss in the southern Basin and Range physiographic province. In contrast to surface-water flow patterns, the regional ground-water flow patterns do not coincide with topographic basins (D’Agnese and others, 1997). The regional ground-water flow system is compartmentalized into local and subregional flow systems because of interactions between the regional carbonate rock aquifer (the Paleozoic carbonate unit shown in figure 3), complex geologic structure, and shallow local flow systems that are controlled by recharge and discharge locations. Most of the groundwater recharge in the region occurs at higher elevations by direct infiltration of precipitation or snowmelt or by infiltration of surface water originating as runoff from
A map of the Death Valley region showing the spatial distribution of nine vegetation communities, as well as the distribution of bare soil or rock, is in D’Agnese and others (1997). The nine vegetation communities are described as homogeneous units, although their natural distributions are commonly heterogeneous with variable species densities (Munz, 1974). These communities are coniferous forests, pinyon–juniper woodland, sage-dominant areas, mixed shrub transition, fan piedmont-mixed shrub, fan piedmont–creosote, alluvial flat-saltbush, phreatophytes, and agriculture. Plant associations within the Death Valley region include the creosote–bursage, the salt desert shrubs, and the sagebrush associations. The creosote–bursage association occupies the largest area relative to other vegetation associations in the region. Coniferous forests and pinyon-juniper woodlands occur as relatively
Introduction
5
Figure 3. Generalized surface geology and corresponding saturated bulk hydraulic conductivity for the Death Valley region. (Values in parenthesis indicate estimated saturated bulk hydraulic conductivity, in millimeters per year).
6
Preliminary Estimates of Spatially Distributed Net Infiltration and Recharge for the Death Valley Region, Nevada–California
Figure 4. Soil classes for the Death Valley region.
Introduction
7
denser vegetation cover at higher elevations where precipitation is higher and air temperature is lower.
Previous Work Net infiltration and recharge have been estimated for locations and basins in the Death Valley region using methods appropriate for arid environments such as water balance (for example, basinwide estimates of discharge or numerical models accounting for all significant components of the water balance), soil physics, geochemistry, and empirical relations based on other variables (such as precipitation). Empirical relations defining recharge as a percentage of precipitation generally are based on water-balance studies, and have been widely used in the Death Valley region. Winograd and Thordarson (1975) estimated that 3 percent of precipitation became recharge in the area of Yucca Mountain on the basis of analysis of measurements of discharge from springs in the Amargosa Desert. The Maxey–Eakin method of estimating recharge to ground-water basins in Nevada (Maxey and Eakin, 1950) was developed using basinwide water-balance studies for several study areas in central, eastern, and southern Nevada, and is the most commonly used empirical method of estimating recharge in the Death Valley region (Watson and others, 1976; Dettinger, 1989; D’Agnese and others, 1997). The Maxey–Eakin method, referred to in this study as the original Maxey–Eakin method, classifies areas of a basin into five recharge zones based on average annual precipitation: 0 percent recharge for less than 203 mm (millimeter) average annual precipitation, 3 percent for 203 to 304 mm, 7 percent for 305 to 380 mm, 15 percent for 381 to 507 mm, and 25 percent for 508 mm or greater (Maxey and Eakin, 1950). Modified versions of the original Maxey–Eakin method have also been used for estimating recharge in the Death Valley region. For example, D’Agnese and others (1997) used an expanded form of the Maxey–Eakin method that included variables such as slope, aspect, and vegetation, in addition to precipitation, for defining the spatial distribution of recharge zones in the Death Valley region. Hevesi and Flint (1998) developed a modified version of the Maxey–Eakin method (referred to in this study as the modified Maxey–Eakin method) that used an exponential curve to define recharge as a continuous function of precipitation (rather than the step function as defined by the original Maxey–Eakin method). The modified Maxey–Eakin method provided an improved fit to field estimates of recharge at Yucca Mountain and at two high-elevation study sites in the central Nevada region (Lichty and McKinley, 1995). 8
Net infiltration and recharge estimates for basins in Nevada also have been obtained using chloridebalance calculations. Dettinger (1989) applied this method to 16 basins in Nevada; the estimates were similar to those obtained using the Maxey–Eakin method and the water-balance calculations. Dettinger (1989) concluded that the chloride mass-balance (CMB) method is applicable for estimating approximate average rates of recharge for many desert basins of the western United States, but may not be applicable for fractured rock under shallow soils because the method assumes piston flow in porous media. Lichty and McKinley (1995) analyzed recharge using both CMB and water-balance modeling for two analog basins in central Nevada. The CMB method equates chloride in recharge water and runoff to chloride deposited in source areas by precipitation and dry fallout. Lichty and McKinley (1995) indicated recharge rates of 10 to 30 mm/yr for a drainage basin with an average annual precipitation of 270 mm, and 300 to 320 mm/yr for a drainage basin with an average annual precipitation of 640 mm. They determined that the CMB method was the more robust for estimating basinwide recharge for the two study basins. The higher degree of uncertainty associated with the waterbalance model result was primarily associated with uncertainty in model inputs, such as uncertainty in the spatial distribution of precipitation and snow depth. Soil-physics techniques have been applied for estimating net-infiltration rates in the Death Valley region at locations having thick soil cover. These methods require knowledge of the soil properties and ambient soil moisture conditions, and assume steadystate conditions. Using soil-physics techniques, Winograd (1981) estimated a net infiltration of about 2 mm/yr through the thick soil in the northern part of the NTS (fig. 1). Nichols (1987) used water-potential measurements and a numerical model for waterbalance calculations of the unsaturated zone in the northern Amargosa Desert near Beatty, Nevada, about 30 km west of Yucca Mountain. Nichols (1987) estimated a net infiltration of 0.04 mm/yr through the thick soil at the Amargosa Desert study site, where the measured precipitation is lower than that of the northern NTS.
Acknowledgments The authors wish to thank many individuals who provided important contributions to the development of this report. Frank D’Agnese and Claudia Faunt of the USGS provided support and expertise in geographic information system (GIS) applications for the development of model inputs. Diane Rewis, William
Preliminary Estimates of Spatially Distributed Net Infiltration and Recharge for the Death Valley Region, Nevada–California
Dudley, Peter Martin, and Devin Galloway (USGS) provided technical reviews of the manuscript. Technical reviews were also provided by Rick Waddell and Guy Roemer of GeoTrans Inc. Glenn Schwegmann and Kristina Pruett (USGS) provided editorial reviews of the manuscript. David Uyematsu (USGS) contributed to the development of illustrations. James Baker (USGS) finalized the manuscript for publication.
CONCEPTUAL MODEL OF NET INFILTRATION FOR THE DEATH VALLEY REGION Processes Controlling Net Infiltration Water-balance processes that control net infiltration are shown on figure 5. Water from precipitation or runoff infiltrates the soil or bedrock across the air–soil or air–bedrock interface and then percolates down from the interface. Percolation is
defined as the downward or lateral flow of water in the unsaturated zone. Redistribution is the continued movement of water (in all directions) through soil or rock after water has stopped infiltrating at the ground surface. Net infiltration is percolation flux, or flow rate, at a depth where evapotranspiration no longer affects the downward movement of infiltrated water. The netinfiltration boundary (fig. 5), the approximate depth at which net infiltration occurs, is variable in both space and time. For most locations, net infiltration eventually becomes recharge. When net infiltration occurs, water continues to percolate through the deep unsaturated zone and, in most cases, reaches either a locally perched or a regional water table. At the water table, ground-water flow from the unsaturated zone to the saturated zone is recharge. Water that has become recharge to a perched saturated zone has a greater potential for lateral flow and may contribute to local discharge. Net infiltration and recharge to the regional saturated zone in the Death Valley region are not necessarily equivalent at a
Figure 5. Water-balance processes controlling net infiltration.
Conceptual Model of Net Infiltration for the Death Valley Region
9
given location and time because the infiltrating water may take hundreds or thousands of years to move through the thick unsaturated zone to the water table (Flint and others, 2000). For the very thick unsaturated zones throughout much of the Death Valley region, ground-water flow may be under transient conditions because of the combination of climate variability and very long ground-water traveltimes. Net infiltration is usually episodic and infrequent for most locations in the Death Valley region, typically occurring during and after periods of high-volume winter precipitation when evapotranspiration is low. An indication of episodic infiltration into fractured bedrock in response to winter precipitation has been shown with field studies using water-potential and water-content measurements at Yucca Mountain (Flint and Flint, 1995; Flint and others, 2001c). For lower elevations (less than 1,500 m) in the Death Valley region, net infiltration is likely to take place only during wetter than average winters. For higher elevation locations (more than 2,000 m), net infiltration in response to snowmelt is likely to be a more consistent, seasonal process.
Development of a Conceptual Model of Net Infiltration Conceptual models of net infiltration provide a qualitative description of the processes controlling the spatial and temporal distribution of net infiltration. For this study, the conceptual model of net infiltration for the Death Valley region was developed from field studies at Yucca Mountain during 1980 through 1995. A primary component of the conceptual model of net infiltration is the conservation of mass, or the water balance, which designates that the sum of all inputs, outputs, and changes in storage in the hydrologic system equal zero. Major components of the water balance in arid to semiarid environments such as the Death Valley region are precipitation, infiltration, runoff, run-on (overland flow and streamflow), evaporation and transpiration (which are combined as evapotranspiration), redistribution, and net infiltration (fig. 5). These water balance components are restricted to the surface and shallow (less than about 6 m) subsurface. Net infiltration rates can be calculated when measurements of these components, and the approximate depth of the root zone in soil or bedrock, are available. On a regional scale, however, the components are difficult to measure and vary over time and space. For locations with thick unsaturated zones, redistribution beneath the root zone and recharge at the water table (fig. 5) may be affected by climate
10
variability and transient ground-water flow. For arid to semiarid environments, an additional difficulty in calculating net infiltration using the water balance method is that the magnitude of measurement error associated with one or more of the water balance components can be greater than the magnitude of net infiltration. Water-balance calculations can be applied to calculate net-infiltration rates and the spatial distribution of net infiltration by using (1) conceptual understanding of the physical processes involved; (2) deterministic or stochastic numerical models approximating each of the physical processes; (3) direct or indirect measurements of the water-balance components; (4) the inclusion of controlling factors within the water balance, such as soil and bedrock permeability and the approximate depth of the root zone; and (5) comparison of results obtained using the water balance with results from alternative methods, such as the chloride mass-balance method. If adequate data are available to define the spatial distributions of climate, physiography, and basin properties affecting the processes controlling net infiltration, the conceptual information and measured data can be applied in a numerical model to estimate the spatial and temporal distribution of net infiltration over the study area.
Precipitation Precipitation is the primary component of the water balance in the Death Valley region. The average position of the jet stream determines the seasonal precipitation frequency for the Death Valley region and may depend strongly on global circulation patterns such as the El Niño Southern Oscillation (ENSO) (Philander, 1990), the mechanics of which are not yet fully understood. On average, winter precipitation represents the greater part of total annual precipitation in the Mojave Desert (Hevesi and Flint, 1998). In contrast to summer precipitation, winter precipitation tends to occur as lower intensity, longer-duration (several hours to several days) frontal storms. Winter precipitation is often in the form of snow, especially at higher (more than 2,000 m) elevations. Summer precipitation in the southwestern United States (southern Great Basin and Mojave Deserts) is controlled primarily by the southwestern summer monsoon (Houghton, 1969; Pyke, 1972). Summer precipitation tends to occur as isolated storms that affect smaller areas relative to winter precipitation, and is characterized by higher intensity, shorter duration (1–2 hours) precipitation often accompanied by lightening and hail. Orographic influences tend to have
Preliminary Estimates of Spatially Distributed Net Infiltration and Recharge for the Death Valley Region, Nevada–California
a pronounced effect on the spatial variability of both summer and winter precipitation throughout the Death Valley region (French, 1983), generally resulting in an increase in the frequency and amount of precipitation at higher elevations.
Evapotranspiration Evapotranspiration is the second dominant component of the water balance in the Death Valley region. Evapotranspiration is the combined process of evaporation and plant transpiration. In arid regions, vegetation usually does not cover the ground completely and bare-soil evaporation can exceed transpiration; in temperate regions, transpiration from the vegetative cover usually dominates. The general theory of evapotranspiration indicates that the availability of moisture, and the availability of energy for evapotranspiration and transport of water vapor away from the evaporating surface, are the most important controlling factors. In much of the Death Valley region, the availability of moisture is less than the availability of energy for evapotranspiration and transport of water vapor. However, because of the temporal and spatial distributions of precipitation over short time intervals, precipitation can easily exceed the water equivalent of the available energy for evapotranspiration, and part of the precipitation can reach the deeper soil layers. Thus, the timing and rate of precipitation, in addition to the total amount of precipitation, are important factors controlling both evapotranspiration and net infiltration in arid lands (Flint and others, 2000).
Surface Water and Infiltration In the Death Valley region, runoff is episodic and infrequent and, for most locations, occurs only during wetter than average winter or high-intensity summer storms. Runoff also can occur as snowmelt, but this tends to be limited to the higher mountain ranges (elevation higher than 2,000 m). Most of the precipitation infiltrates into the soil or exposed bedrock at the point where the precipitation falls (fig. 5), and the infiltrated precipitation is eventually returned to the atmosphere through evapotranspiration. Some of the precipitation becomes overland flow that either infiltrates into thick soils or permeable bedrock downslope (where the soil aggregates) or reaches channels and becomes streamflow. The amount of water that can infiltrate before runoff is generated depends on three controlling factors: infiltration capacity (how quickly the soil or bedrock can take on
water), the total storage capacity (how much water the soil or bedrock can hold), and the antecedent conditions affecting the available storage capacity (how much water is still being stored from previous storms). Because the infiltration and storage capacity of bedrock tends to be much lower than soil, runoff tends to become more prevalent as the percentage of area covered by thin soils or exposed bedrock increase. During wet years when surface water discharges to the playa lakebeds, temporary playa lakes form and may become sources of recharge at locations where the water table is relatively deep (for example, playas located within and adjacent to the NTS). In general, however, playa lakes are not a significant source of recharge in the Death Valley region. Playa lakes tend to be very shallow and occur where potential evapotranspiration is relatively high. In addition, playa soils typically are fine grained with high water storage capacity and low permeability, being more conducive to evaporation while being less conducive to deep percolation. Most playas in the Death Valley region are the result of a seasonal or historical lakebed caused by a regional or locally perched water table that is relatively close to or at the ground surface. Playas formed by a shallow water table are locations of ground-water discharge, not recharge. The hydraulic gradient is upward, resulting in high evaporation and the formation of evaporites. Shallow Infiltration
A conceptual model of shallow infiltration processes was developed for Yucca Mountain using four infiltration zones based on defined topographic position and measured water-content changes with depth and time (fig. 5) (Flint and Flint, 1995). These zones show significant differences in infiltration (primarily the depth of penetration of the wetting front) due to the soil thickness and associated storage capacity, and the bulk permeability (matrix and fractures) of the underlying bedrock. For this study, the conceptual model of shallow infiltration processes developed for Yucca Mountain is assumed to be applicable to most locations in the Death Valley region because the climate and physiographic characteristics of Yucca Mountain are considered to be representative of most locations in the Death Valley region. The infiltration zones that are correlated with topographic position include the ridgetop, sideslope, alluvial terrace, and active channel (fig. 5). The ridgetop zone has thin soils (0.1- to 2-m thick) with exposed bedrock and a shallow root zone. Where the bulk permeability of the underlying bedrock is relatively high, this zone often produces a deeper
Conceptual Model of Net Infiltration for the Death Valley Region
11
wetting front compared with other zones. The sideslope zone is steep and commonly has thin to no soil cover and, thus, a relatively higher potential for generating runoff. In contrast to the ridgetop and sideslope zones, the alluvial terrace zone has thicker soils with a deeper root zone and a large storage capacity within the root zone. The potential for runoff is relatively low for the alluvial terrace zone because of the large storage capacity, and the wetting front generally penetrates to a depth of only about a meter before the evapotranspiration rate exceeds the downward percolation rate. Consequently, this zone which covers broad areas, including most of the alluvial basins and fans in the Death Valley region, contributes the least to total net infiltration. The active channel zone (fig. 5) is similar to the alluvial terrace zone in terms of a thicker soil and deeper root zone, but is restricted to localized, linear features that collect and concentrate runoff. The concentration of runoff as streamflow in channels, combined with coarser soils having high permeability, can result in a deep (greater than 10 m) wetting front. Because streamflow is infrequent in the region, and the active channels are a very small percentage of the total drainage basin area, infiltration from streamflow is not considered to be the primary component of net infiltration in the Death Valley region.
this study, net infiltration along active stream channels is not considered a significant component of the overall net infiltration because the area affected by active channels is small relative to the interchannel areas affected by direct infiltration of precipitation and snowmelt. In rainfall-infiltration-runoff relations, the rainfall intensity, duration, and history of the change in soil-water content are important factors in determining infiltration and runoff. For example, during most periods of rainfall at the Yucca Mountain site, runoff did not occur and the infiltration rate was equal to the rainfall rate because the rainfall rate was less than the saturated hydraulic conductivity of the soil (Hevesi, 2001). However, even when the rainfall rate is greater than the saturated hydraulic conductivity, runoff may not occur when the rainfall duration is short. Previous studies on infiltration have shown that for ponding and runoff to take place, the rainfall intensity must be greater than the saturated hydraulic conductivity of the soil, and the rainfall duration must be greater than the time required for the soil to become saturated at the surface (Freeze and Cherry, 1979). Thus, in addition to rainfall intensity and duration, ponding and the subsequent generation of runoff is dependent on the initial water content of the soil. Soils that are initially wetter reach saturation more rapidly, and have a greater potential to generate runoff.
Surface Water (run-on/runoff)
In many arid and semiarid environments, such as the Death Valley region, streamflow is intermittent and occurs predominantly as runoff from precipitation or snowmelt (fig. 5). Sustained streamflow from discharging ground water is limited to a few isolated springs. For the current arid climate, runoff during most years in the Death Valley region generally is in the higher elevation headwater drainages and in the downstream areas of rugged terrain with thin soils underlain by relatively impermeable bedrock. The infrequent, severe storms of high intensity rainfall can also result in widespread overland flow and flash flooding, even for lower elevations with thick soils. If overland flow occurs, the path by which the water reaches a channel and the rate and magnitude of streamflow generation depend upon precipitation intensity and duration, topography, geology, soils, vegetation, roughness characteristics of the ground surface, and stream channel geometry. The routing and concentration of overland flow into channels causes streamflow and can result in a high volume of infiltration along permeable sections of the channel, potentially resulting in high rates of net infiltration at some locations. For the conceptual model applied in
12
Redistribution and Net Infiltration
Redistribution, a three-dimensional groundwater flow process governed by water-potential gradients and gravity drainage, is the continued movement of water through soil or rock after infiltration has stopped at the ground surface. It is an important process that controls the amount of water percolating below the zone of evapotranspiration and becoming net infiltration (fig. 5). Redistribution occurs in response to both gravitational and capillary (matric) potentials, and includes upward flow in response to capillary suction, downward flow in response to both gravity drainage and capillary suction, and lateral flow in response to both capillary potential and heterogeneity in the soil or rock. The initial redistribution in wet soils generally occurs as gravity drainage. Gravity drainage can be relatively rapid when soils are fully saturated, but decreases by up to several orders of magnitude as the soil drains to a subjectively defined water content, referred to as field capacity. Field capacity represents the approximate water content at which the capillary potential holding water in the soil under suction is significant relative to gravitational potential (causing gravity drainage to be
Preliminary Estimates of Spatially Distributed Net Infiltration and Recharge for the Death Valley Region, Nevada–California
very slow) and is a conceptual term used to characterize the water holding capacity of a given soil. Field capacity is usually defined by the water content of the soil following a specified period of drainage (from full saturation) or when the drainage rate becomes negligible (Campbell, 1985). In this study, the negligible drainage rate that defines field capacity is assumed to occur when the water potential of the soil has reached –0.1 bar, and is based on analysis of fitted moisture retention curves for soils sampled at Yucca Mountain (Flint and others, 2001a,b; Hevesi, 2001). In general, the lower the permeability and the higher the field capacity for a given soil, the greater the potential that water infiltrating the soil will eventually be removed by evapotranspiration before it can percolate through the root zone to a depth where it becomes net infiltration. Thicker soils (more than 3 m) may reach field capacity from infiltrating water near the surface, but the water supply may not be enough to move the wetting front below the root zone, which may be several meters deep. During water limited conditions, deep penetration of the wetting front will more likely occur at locations with shallow root zones in thin soils overlying fractured (or relatively permeable) bedrock than at locations with thick soils having a large storage capacity and deep root zones. In active channels where water is concentrated during episodic streamflow, water availability may not be a limiting factor, and wetting fronts can penetrate to depths greater than 10 m (Flint and Flint, 1995). Under these conditions, downward percolation is rapid enough to allow the infiltrated water to penetrate below the root zone and thus become net infiltration, even at locations with thick soils and relatively deep root zones. Once water has percolated below the root zone, upward vapor flow, lateral flow, and exfiltration resulting from the existence of an upward potential gradient may occur, but these processes would likely be secondary to downward percolation caused by a unit or near-unit gradient, unless low permeability layers were present in the soil profile. In arid environments, caliche (cemented horizons of carbonate) can form in soils within several meters of the surface when calcite in pore waters precipitates because of evaporation and exsolution of carbon dioxide. The secondary calcite in these horizons is finely grained, reducing gas and water permeability. These layers are frequently found in washes, and may cause lateral redistribution or simply prevent deeper infiltration by maintaining the water within the root zone where it can be transpired. Because of this stratification and vertical heterogeneity in soil material, the occurrence of surface-water flow along a
given channel does not guarantee deep infiltration throughout the length of the channel. Processes at the Soil–Bedrock Interface
For locations with thin soils, redistribution across the soil-bedrock interface is an important process controlling net infiltration when the root zone reaches the soil-bedrock interface or extends into fractured bedrock (Flint and Flint, 2000; Flint and others, 2000). The volume of infiltrated water that reaches the soil-bedrock interface is determined by the balance between the timing of evapotranspiration and gravity drainage in the soil profile. Periodic occurrences of high-frequency, high-magnitude winter precipitation, combined with sparse vegetation and a thin soil cover over fractured or relatively permeable bedrock, provide conditions that can lead to a substantial volume of water penetrating across the soilbedrock interface and percolating below the zone of evapotranspiration. An important factor facilitating net infiltration at locations with thin soils is that the soil-water content at the soil-bedrock interface tends to approach or reach saturation with heavy or long-term precipitation because the hydraulic conductivity of the bedrock matrix is, in most cases, several orders of magnitude less than that of the soil. Net infiltration tends to occur as fracture flow, which is initiated when the soilbedrock interface reaches saturation or near-saturation (Flint and Flint, 1995). Net infiltration also may occur primarily through fractures filled with mineral deposits and (or) through the bedrock matrix if the water potential at the soil-bedrock interface is not high enough to initiate flow in open fractures (Flint and others, 2001c).
ESTIMATION OF NET INFILTRATION Overview of Preliminary Net Infiltration Model (INFIL) The conceptual model of water-balance processes and net infiltration in the Death Valley region is based on components of the mass-balance (also referred to as the water-balance) equation and is represented by a preliminary numerical model, INFIL. The preliminary numerical model is an initial application of the local-scale net-infiltration model developed for the Yucca Mountain site (Flint and others, 2000; Hevesi, 2001) to the regional scale of the Death Valley ground-water flow system. This preliminary model uses water-balance processes,
Estimation of Net Infiltration
13
spatially distributed daily precipitation and air temperature, topography, and spatially distributed hydrologic properties, and provides daily estimates of water-balance components, including evapotranspiration and net infiltration. The routing of surfacewater flow and the simulation of snowmelt (all precipitation was treated as rain) were not incorporated into the model. The water-balance equation must be applied over an arbitrary time interval (in this case, 1 day) and some arbitrary volume or depth in the soil. This equation is based on the principle of the conservation of mass for water: D = P + R on – R off – ∆W s – ET
(1)
where D is net infiltration (deep drainage or percolation), P is precipitation, Ron is water entering the arbitrary area as surface water run-on, Roff is water exiting as surface water runoff, ∆Ws is change in soil water storage, and ET is evapotranspiration. The waterbalance equation often can be simplified by assuming one or more of the terms to be negligible. For this study, P was measured at some sites and estimated for the entire study area, and ∆Ws and ET were estimated. Measurements of ∆Ws and ET were made in some locations to verify the estimates for the entire study area. Runoff was calculated by the model, but run-on was assumed negligible. Runoff was removed from the system, rather than being routed to adjacent cells. Precipitation (P) is input as a daily value and extrapolated in space using an elevation correlation; evapotranspiration (ET) is simulated within a solar radiation subroutine; and the change in soil water storage (DWs) incorporates an infiltration subroutine and the physical and hydrologic properties of the site, such as soil-moisture conditions and properties, soil depth, and the saturated hydraulic conductivity of the geologic formation underlying the root zone. The geologic formation underlying the root zone was a consolidated rock type (bedrock) for all locations having upland soils, and the root zone depth was assumed equal to the estimated soil thickness for these locations. The saturated hydraulic conductivity used for consolidated rock types represents the bulk permeability of the combined rock matrix and fractures. For all locations having alluvial fan and basin, playa, or channel soil types, the soil thickness was estimated to be equal to or greater than 6 m, and the depth of the root zone was assumed to be 6 m. For these locations, unconsolidated deposits of valley fill were assumed to underlie the root zone. 14
Model Grid The numerical model grid for INFIL was defined using the digital elevation model (DEM) developed by Turner (1996a) for the Death Valley region and used by D’Agnese and others (1997) for the Death Valley regional ground-water flow model. The DEM encompasses an area of 91,810 km2 and includes the entire Death Valley region (fig. 1). The DEM grid consists of 1,203 rows (from north to south) and 984 columns (from east to west), with an equivalent grid spacing of 278.5 m in the north-south and east-west directions. The 1,183,752 grid locations are defined by the Universal Transverse Mercator (UTM), zone ll, NAD27 projection (North American Datum). The vertical geometry of the model was defined using a single root zone layer based on the estimated soil thickness at each grid cell.
Model Inputs Precipitation
Historical records of daily precipitation are available for many locations in the Death Valley region. Precipitation records at measurement sites can be used to statistically characterize the spatial and temporal distribution of precipitation over an area. Correlations with other parameters, such as elevation or geographic location, can be analyzed and defined using statistical and geostatistical models that can be applied to estimate precipitation at locations between measurement sites (Hevesi and others, 1991). For the preliminary version of INFIL used in this study, daily precipitation was distributed spatially over the Death Valley region using available precipitation records and a precipitation-elevation correlation model (Hevesi and others, 1991). Daily precipitation values estimated for Yucca Mountain were scaled for each INFIL model grid location using the grid elevation (defined by the DEM) and a fitted regression curve defining the precipitation-elevation correlation. The scaling provided a spatial distribution of daily precipitation over the entire Death Valley region consistent with the observed correlation of average annual precipitation and elevation (Hevesi and Flint, 1998). Daily precipitation was estimated at Yucca Mountain for the period starting on January 1, 1980, and ending on September 30, 1995. Yucca Mountain is located in the approximate center of the Death Valley region, and was considered an appropriate location for representing the occurrence and average magnitude of daily precipitation over the region. Daily precipitation at Yucca Mountain was estimated using an
Preliminary Estimates of Spatially Distributed Net Infiltration and Recharge for the Death Valley Region, Nevada–California
inverse-distance-squared interpolation of daily precipitation records from a network of 14 stations located in the general area of Yucca Mountain and the NTS. The inverse-distance-squared interpolation was scaled to account for spatial variability caused primarily by orographic effects. The scaling was performed using the ratio of average annual precipitation for a 7-year (1988–1995) record of daily precipitation measured at Yucca Mountain and average annual precipitation obtained for surrounding locations, many having continuous records of 30 years or longer. The estimated time series provided a continuous record of daily precipitation for a period of about 16 years. Spatially Distributed Basin Properties Soils
The Death Valley region was divided into four soil types (upland, valley fill, playa, and channel soils), which are based on the basis of geology and hydrographic features (fig. 4). A generalized geologic map of the Death Valley region (fig. 3) was obtained as digital data from D’Agnese and others (1997) and used to define the areal distribution of the soil types. Upland soils were assumed to be associated with consolidated rocks, valley fill soils with valley fill deposit, and playa soils with playa deposits. Channel soils were assigned to all locations defined as stream channels on the basis of digital hydrographic data from D’Agnese and others (1997) and Turner (1996b). For all locations of valley fill, playa, or channel soil, model cells were assigned a thickness of 6 m, which is based on the estimated root-zone thickness for these soil types. Below the root zone, underlying geologic material was designated as valley fill. For all locations designated as having the upland soil type, estimates of soil thickness were refined using vegetation zones in the Death Valley region (D’Agnese and others, 1997) and assigned to model cells as follows: bare soil and rock zones, 0.05-m thick; montane coniferous forest zones, 1.0 m; pinyonjuniper woodland zones, 0.5 m; all remaining zones, 0.3 m. The depth of the root zone was assumed equal to the estimated soil thickness. For this model, the root zone does not extend into the underlying bedrock. Soil properties assigned to the four soil types for the Death Valley region include field capacity, residual water content, porosity, and saturated hydraulic conductivity (table 1). Properties of the upland and the valley fill soil types were estimated through field and laboratory analyses of soils around Yucca Mountain (Flint and others, 2001c). Playa and channel soil
Table 1. Properties of soils used in model. [v/v, dimensionless volume; mm/d, millimeter per day] Soil type
Field capacity (v/v)
Residual water content (v/v)
Porosity (v/v)
Upland Valley fill Playa Channel
0.2 .3 .4 .15
0.03 .05 .1 .01
0.3 .35 .5 .32
Saturated hydraulic conductivity (mm/d)
500 1,000 10 5,000
properties were estimated using assumptions relative to the Yucca Mountain soils. Playa soils tend to be fine grained with a high percentage of clays and silts. Thus, porosity, field capacity, and residual water content for playa soils were assumed higher than Yucca Mountain soils, whereas saturated hydraulic conductivity was assumed lower. Channel soils, in contrast, tend to be coarse grained with a high percentage of sand and gravel. For these soils, estimates of porosity, field capacity, and residual water content were based on coarse-grained soils at Yucca Mountain, whereas the saturated hydraulic conductivity was assumed higher than Yucca Mountain soils. Rocks
The spatial distribution of 10 hydrogeologic units in the Death Valley region (referred to in this study as the generalized geology for the Death Valley region, fig. 3) was obtained as digital data from D’Agnese and others (1997). Because of the scarcity of measured saturated hydraulic conductivity on rocks in the Death Valley region, estimates for most of the hydrogeologic units defined as consolidated rocks were based on saturated hydraulic conductivity ranges provided by Bedinger and others (1989)(fig. 3). The only measured saturated hydraulic conductivity values available were those based on measurements for volcanic rocks and for valley fill (alluvium) from Yucca Mountain, and were used for that rock type and for valley fill throughout the region (Hevesi, 2001).
Model Calculations Energy Balance Calculations Solar Radiation
INFIL uses a solar radiation subroutine as the main component for modeling spatially distributed potential evapotranspiration. The subroutine is similar to the model SOLRAD (Flint and Childs, 1987) and Estimation of Net Infiltration
15
calculates daily solar radiation using National Weather Service monthly regional atmospheric properties and detailed site geometric properties. The atmospheric properties are monthly averages of ozone, precipitable water, atmospheric turbidity, circumsolar-diffuse radiation, and ground albedo. Site geometric properties include latitude, longitude, slope, aspect, elevation, and the blocking angles above a horizontal surface for direct-beam and diffuse sky radiation. Slope and aspect were calculated for the model using standard GIS applications in ARCINFO. The blocking angles define the effects of shading caused by the surrounding topography. For example, a location at the bottom of a steep, narrow canyon or valley will be shaded more often from direct-beam radiation, and diffuse sky radiation will be reduced on the basis of the net effect of the surrounding terrain in blocking out the sky. A FORTRAN program, SKYVIEW, was used to calculate the blocking angles (also referred to as blocking ridge angles) above horizontal for each of thirty six 10-degree horizontal arcs around every grid cell (blocking ridge angles). Calculations in SKYVIEW were made using the DEM as input and a technique for approximating the 10-degree horizontal angles based on northing and easting grid cell distances (Flint and Childs, 1987). To model solar radiation, the position of the sun is calculated every hour, starting at sunrise on each day. Direct-beam and diffuse sky radiation are calculated using the atmospheric properties and applied to the surface on the basis of slope, aspect, and the amount of sky and sun that would be blocked by the surrounding topography. Ground-reflected radiation is added on the basis of the area of the surrounding topography, the ground albedo, and the direct-beam and diffuse sky radiation that reflects from the surrounding topography. Air Temperature
Average daily air temperature, in degrees Celsius, was calculated in INFIL using: T = T1 – T2 { Sin [ ( D ⁄ N yr )2π + 1.3 ] }
(2)
where T is the modeled daily air temperature, T1 is the mean annual air temperature, T2 is the mean seasonal variation of average daily air temperatures above the mean during summer and below the mean during winter (the half amplitude of the sine wave), D is the day of year, and Nyr is the total number of days for a
16
given year. T1 and T2 were calculated as 15.0 and 11.7ºC, respectively, using measured air temperature data from Yucca Mountain weather stations. The modeled daily air temperature values were distributed spatially across the Death Valley region using the adiabatic lapse rate for a central location at Yucca Mountain using the following regression model: T3 = T + 0.0098 ( 1524 – E )
(3)
where T3 is the estimated air temperature for a given grid cell, T is the modeled daily air temperature obtained from equation 2, the value 0.0098 is a fitted coefficient (obtained using air temperature data in the Death Valley region) representing the adiabatic lapse rate for a given change in elevation, and E is the grid cell elevation, in meters. Calculation of Evapotranspiration
Evapotranspiration can be estimated using the equation developed by Priestley and Taylor (1972): S λE = α ------------ ( R n – G ) S+γ
(4)
where α, an empirical coefficient, is 1.26 for freely evaporating surfaces (Priestley and Taylor, 1972; Stewart and Rouse, 1977; Eichinger and others, 1996). λE is the latent heat flux, with λ the latent heat of vaporization and E the rate of evaporation. The available energy is Rn – G, with Rn equal to net radiation, and G equal to soil-heat flux; S/(S+γ), the slope of the vapor density deficit curve, is derived from the temperature used to convert available energy into potential evapotranspiration (Campbell, 1977, table A.3). Net radiation, Rn (in watts per square meter), is calculated using simulated solar radiation (obtained by the SOLRAD subroutine discussed in the previous section). The slope of the vapor density deficit curve, S/(S+γ), is defined using simulated air temperature (obtained by equations 2 and 3), and the soil-heat flux, G (in watts per square meter), is calculated using an empirical function developed from field data collected at Yucca Mountain. The Priestley–Taylor equation was modified to relate the empirical coefficient, α, to seasonal changes in soil-water content (Davies and Allen, 1973; Flint and Childs, 1991; Hevesi and others, 1994). This modified version has been successfully used in arid
Preliminary Estimates of Spatially Distributed Net Infiltration and Recharge for the Death Valley Region, Nevada–California
and semiarid environments (de Bruin, 1988; Stannard, 1993). When correlated to changes in soil-water content, α is replaced with α':
Calculation of Net Infiltration Using a Root-Zone Water Balance Model Overview of the Root-Zone Water Balance
βΘ
α′ = α ( 1 – e )
(5)
where α is 1.26, β is a fitting parameter initially set to -1.5 and Θ is relative saturation. Relative saturation is defined as: ( θ – θr ) Θ = ------------------( θs – θr )
(6)
where θ is soil-water content, θs is porosity, and θr is residual soil-water content for plant transpiration (soilwater content at –60 bars water potential), which is the approximate potential at which desert plants no longer transpire. The α and β parameters were determined using evapotranspiration and soil-water measurements at Yucca Mountain (Flint and others, 2001c). For this study, the amount of potential evapotranspiration (in millimeters), was calculated by INFIL on an hourly basis and summed over the period of 1 day to obtain an estimate of total daily potential evapotranspiration. To calculate daily evapotranspiration from the root zone at each grid cell, the relative saturation of the root zone was updated at the beginning of each 24-hour time step using the known root-zone water content of the previous day and estimated infiltration (in response to rain) for the current day. Evapotranspiration then was calculated by applying equation 6, and the coefficient α' was adjusted on the basis of estimates of vegetation cover percentages. The scaling involved increasing the absolute value of α' with an increase in vegetation cover, and was used to account for an assumed increase in root density with an increase in vegetation cover. Vegetation cover percentages were estimated (fig. 6) using the vegetation zones described in D’Agnese and others (1997). The preliminary estimates of percentage vegetation cover used in this study were 50 percent cover corresponding to the montane coniferous forests zone and the phreatophytes or agriculture zone, 30 percent cover corresponding to the pinyon-juniper woodland zone, 0 percent cover corresponding to the bare soil or rock zone, and 15 percent cover corresponding to all remaining vegetation zones.
For the preliminary version of the net-infiltration model used in this study, the occurrence and magnitude of daily net infiltration was dependent on the integration of factors affecting the root zone, including daily precipitation, soil-saturated hydraulic conductivity, antecedent soil-water content, soil thickness, residual soil-water content, soil field capacity, soil porosity, evapotranspiration, and the saturated hydraulic conductivity of the geologic unit underlying the root zone. In this preliminary model, the root zone was defined as a single layer system restricted to soils (the root zone was not extended into consolidated bedrock), and was represented as a simple water storage component in the soil profile. Water was added to or subtracted from the soil-water content storage term, and the total amount of water stored in the root zone was calculated using soil thickness. A second soil-water storage component, referred to as the “bucket,” was used to calculate the amount of water in the root zone available for net infiltration. Water was added to the bucket only when the soil-water content was greater than field capacity. As long as water was available in the bucket, it was decreased by both evapotranspiration and net infiltration on a daily basis. A 2-mm residual storage term was included in the bucket storage component to represent saturated conditions (or the ponding of water) at the soil-bedrock contact, which defined the bottom of the root zone for locations with thin soil underlain by consolidated bedrock. Daily Water-Balance Calculations
Water-balance calculations for the root zone, including evapotranspiration, the change in soil-water storage, and net infiltration, were made using a twostep algorithm applied to each daily time increment of a continuous, multiyear time series. In the first step of the algorithm, infiltration of precipitation into the soil, evapotranspiration, the initial soil drainage amount, and the initial runoff amount were calculated using precipitation, soil properties, modeled potential evapotranspiration, and an initial soil-water content. The initial soil-water content was the final soil-water content calculated from the preceding day. Infiltration of precipitation was calculated by comparing the precipitation rate against the soil saturated hydraulic conductivity. If the precipitation rate exceeded the saturated hydraulic conductivity, the infiltration rate
Estimation of Net Infiltration
17
Figure 6. Estimates of percentage cover of vegetation in the Death Valley region.
18
Preliminary Estimates of Spatially Distributed Net Infiltration and Recharge for the Death Valley Region, Nevada–California
was set equal to the saturated hydraulic conductivity, and the excess precipitation was added to the runoff component. The precipitation rate was estimated as a uniform daily rate based on an assumption of a 24-hour storm duration. The infiltrated precipitation amount was added to the initial soil-water content, and evapotranspiration was estimated using equations 4 through 6. If the water content was equal to or less than the residual water content for the soil (the wilting point water content), evapotranspiration was set to zero. If the water content was greater than the residual water content, the soilwater content was decreased by the estimated evapotranspiration rate. If the water content was still greater than the soil field capacity water content after water was removed by evapotranspiration, redistribution of water in the soil profile was represented as piston-flow drainage. The amount of initial soil-water drainage was calculated as the difference between the soil-water content and field capacity water content. In this simplified representation of unsaturated flow through the root zone, the hydraulic conductivity at field capacity was assumed to be equivalent to the saturated hydraulic conductivity. The amount of water drained from the soil was added to the bucket storage component. The amount of water stored in the bucket defined the amount of water potentially available for net infiltration. In the second step of the algorithm, net infiltration, the final change in soil-water storage, and the final runoff amount were calculated. Net infiltration was calculated using a potential net infiltration defined as the amount of water available in the bucket, minus the 2-millimeter residual water content. The 2-millimeter residual water content amount was used in the bucket to maintain saturated conditions at the soil-bedrock interface for locations having thin, upland soils because net infiltration into consolidated rock was assumed to occur primarily as saturated fracture flow. Although the amount of water in the bucket available to net infiltration was restricted to the amount exceeding the 2-millimeter residual term, all water in the bucket was available for evapotranspiration. If the amount of water in the bucket exceeding 2 mm was greater than the maximum daily drainage amount defined by the saturated hydraulic conductivity of the geologic unit underlying the root zone (either consolidated or unconsolidated rock types), the drainage amount, or net infiltration, was set equal to the maximum daily drainage amount. If the amount of water in the bucket exceeding 2 mm was less than or equal to the maximum daily drainage amount, net infiltration was calculated as the amount
of water in the bucket exceeding 2 mm. The amount of net infiltration was then subtracted from the bucket term. If the sum of the amount of water left in the bucket and the soil profile exceeded the total storage capacity of the soil, as defined by the soil porosity multiplied by the soil thickness, the amount of excess water was subtracted from the bucket and added to the runoff term to calculate the final runoff amount. The final soil-water content was defined as the sum of the soil-water content calculated in step 1 and the amount of water remaining in the bucket in step 2. This water content defined the initial conditions for the next day of the time series. Precipitation, evapotranspiration, change in soil-water content, runoff, and net infiltration were calculated for all grid locations and summed through the daily time series to calculate time-averaged rates for each component of the water balance. Initial conditions for the first day were defined using estimated or assumed soil-water contents for all grid locations. For the preliminary model, the initial soil-water content for a given model grid cell was set to 20 percent above the residual water content of the soil type for that grid cell. Soil and Bedrock Properties Used to Calculate Net Infiltration
Root-zone properties used in the daily calculation of net infiltration included the thickness, porosity, field capacity, residual water content, and saturated hydraulic conductivity of the soil, and the saturated hydraulic conductivity of the hydrogeologic unit underlying the root zone. For all locations having the upland soil type, the root-zone depth was set equal to the soil thickness, and thus the amount of water in the bucket represented the amount of water ponded at the soil-bedrock interface (the saturated hydraulic conductivity of all consolidated rock types was less than the saturated hydraulic conductivity of upland soils). For locations having valley fill, playa, or channel soils, the valley fill geologic unit underlay the 6-m-deep root zone. For channel soils, ponding at the bottom of the root zone could occur because the estimated soil-saturated hydraulic conductivity [5,000 mm/d (millimeter per day)] was greater than the saturated hydraulic conductivity of the valley fill (approximately 2,000 mm/d). Thus, for locations having either upland or channel soils, daily net infiltration was limited by the saturated hydraulic conductivity of the underlying geologic unit and the availability of water in the bucket. For locations having valley fill or playa soils, the amount of water draining into the bucket could not exceed the maximum net infiltration limit defined by the saturated hydraulic conductivity of the underlying
Estimation of Net Infiltration
19
valley fill. For these locations, all water in the bucket was removed at the end of each daily time step (except for the 2-millimeter residual term). The final soil water content was never greater than the field capacity storage term, and runoff was generated only when the precipitation rate exceeded the saturated hydraulic conductivity of the soil. For these locations, net infiltration was limited primarily by evapotranspiration and the relatively large storage capacity of the 6-meterthick soil profile.
Assumptions and Model Limitations A general assumption applied in this study was that the use of a distributed-parameter, water-balance model for estimating net infiltration is appropriate for a regional-scale application to estimate recharge for the Death Valley region. Although the water-balance method required many simplifying assumptions concerning the physics of unsaturated flow, this approach allowed for a relatively dense model grid consisting of 1,203 rows and 984 columns. The dense grid provides a detailed representation of the spatial distribution of parameters controlling net infiltration, such as topography and geology. Examples of previous applications of distributed-parameter water-balance models, requiring similar assumptions concerning unsaturated flow, are documented in Hatton (1998). For the preliminary version of the net-infiltration model, snowfall and snowmelt were not included, and thus it was assumed that all precipitation occurred as rain. This assumption increases model uncertainty at higher elevations where there is significant snowfall. For the preliminary model, it also was assumed that the effect of surface-water run-on on net infiltration is negligible in the Death Valley region. Although runoff was calculated in the water balance, surface-water runon was not routed to adjacent downstream cells. This assumption increases model uncertainty for all active channel locations. Additional assumptions applied in the water-balance model calculations used in the netinfiltration model include the assumption that the process of vapor flow and the temperature effects on water density are negligible. Water density was assumed constant so that the governing equations used to calculate net infiltration in the water-balance model could be applied as a volume balance, rather than as a mass balance. Within each grid cell of the model domain, water was assumed to move vertically downward in soil and bedrock, and lateral inflow or outflow between grid cells was assumed zero. Net infiltration was assumed as saturated, or near-saturated, flow into the underlying bedrock and downward percolation
20
through the root zone was assumed to occur only when the water content of the soil profile exceeded the soil field capacity. The preliminary version of the net-infiltration model used in this study is an extension of a local-scale model calibrated to the Yucca Mountain site. It was assumed that conditions at the Yucca Mountain site to which the local-scale model was field calibrated, and from which the precipitation was distributed, was representative of conditions throughout the Death Valley region. The preliminary model is uncalibrated for the Death Valley region as a whole, and model uncertainty is assumed to increase with increasing differences in climate, physiography, geology, soils, and vegetation relative to conditions at the Yucca Mountain site. Important sources of model uncertainty include input parameters such as hydraulic conductivity of bedrock, soil thickness, soil hydrologic properties, and vegetation cover. Another important source of model uncertainty is due to limitations in representing the spatial and temporal distribution of precipitation using available climate records. Results obtained from this preliminary, uncalibrated model can be interpreted as a single realization of an output distribution that was not fully quantified. It was assumed, based on sources of model uncertainty, that the output distribution obtained from multiple stochastic realizations would be relatively wide. Thus, the level of uncertainty associated with these results is relatively high, and must be considered in any application of these results.
MODEL RESULTS Description of Preliminary Net Infiltration Model Results An initial application of the regional netinfiltration model, INFIL, was used to develop a preliminary estimate of spatially distributed net infiltration and potential recharge for the Death Valley region (fig. 7). The net-infiltration estimate is based on the average daily net-infiltration rate modeled for the period 1980 through 1995. Daily net infiltration was calculated for all grid locations and summed through the daily time series to calculate average annual netinfiltration rates at each grid location. The preliminary net-infiltration estimate is considered a potential recharge estimate representative of current climate conditions based on simplifying assumptions, including steady-state conditions and vertical,
Preliminary Estimates of Spatially Distributed Net Infiltration and Recharge for the Death Valley Region, Nevada–California
Figure 7. Simulated net infiltration for 1980–1995 for the Death Valley region.
Model Results
21
one-dimensional percolation through the unsaturated zone. Results are considered preliminary because model inputs were preliminary, and model calibration had not been completed. For the 91,810-square kilometer area of the netinfiltration model grid, the preliminary model results (fig. 7) include a spatially averaged net-infiltration estimate of 6.4 mm/yr and an average annual precipitation rate of 187.2 mm/yr (based on the modeled 1980–1995 daily precipitation input). For the 39,556-square kilometer area of the Death Valley ground-water flow model (figs. 1 and 8A), the results include a spatially averaged net-infiltration estimate of 7.8 mm/yr. The maximum net-infiltration rate for both areas is 363 mm/yr, corresponding to a maximum estimated precipitation rate of 765 mm/yr for the summit location of the Spring Mountains (figs. 1 and 2). The dominant factor contributing to the locations of maximum net infiltration is the increased daily precipitation estimated for the higher elevations using the precipitation elevation correlation model. In general, locations of high net infiltration (greater than 100 mm/yr) are at elevations greater than 2,700 m (9,000 ft), and include the summit areas of prominent mountain ranges such as the Spring Mountains and the Sheep Range (fig. 1). The second dominant factor controlling net infiltration is soil thickness. For the preliminary model, net infiltration exceeded 0.1 mm/yr only in upland soils. The preliminary model does not simulate localized net infiltration and recharge along active channels, which is likely to include valley fill soils with thicknesses greater than 6 m. However, model results obtained using the local-scale Yucca Mountain model, which included surface-water flow, indicate that net infiltration along active channels did not provide a significant contribution to the total netinfiltration volume because of the small area occupied by channels (Hevesi, 2001). This characteristic is assumed to be applicable to the regional scale under current climate conditions. A third important factor controlling regional net infiltration (fig. 7) is bedrock permeability (fig. 3). Comparison of the net-infiltration results with figure 3 indicates that relatively high net-infiltration rates (greater than 50 mm/yr) tend to occur at locations underlain by the more permeable Paleozoic carbonates. These locations include less prominent mountain ranges to the east of the NTS and the mountainous areas bounding the eastern side of Death Valley. In general, locations with high net-infiltration rates have the combined characteristics of sufficient precipitation, thin soils, and high permeability bedrock. In comparison, locations underlain by low-
22
permeability granites have net-infiltration rates of only 0.01 to 1 mm/yr. The low rates of net infiltration in granites are simulated even in mountainous locations characterized by thin soils and higher precipitation.
Comparison of Preliminary Net Infiltration Model Results with Estimates of Spatially Distributed Recharge The preliminary net-infiltration model results from INFIL were compared with spatially distributed recharge estimates calculated using the original and modified Maxey–Eakin methods. The comparison was used to help evaluate the appropriateness of applying simulated net infiltration as an indicator of current climate recharge. The Maxey–Eakin recharge estimates were calculated using two different estimates of average annual precipitation: (1) the regionally distributed 1980–1995 modeled daily precipitation record used as input for INFIL, and (2) a geostatistical model developed for the Death Valley region (Hevesi and Flint, 1998). Results obtained by both the preliminary netinfiltration model and the Maxey–Eakin method generally are consistent in terms of the spatial distribution of relative magnitudes. The two methods indicate that major sources of recharge tend to be at higher elevations [such as the Spring Mountains and the Sheep Range (figs. 1 and 8)]. Potential recharge estimates obtained as simulated net infiltration from INFIL are in good general agreement with the modified Maxey–Eakin model, indicating maximum recharge rates of about 200 to 363 mm/yr in the Spring Mountains (fig. 8). Although these maximum recharge rates are greater than estimates of 100 to 175 mm/yr obtained by the original Maxey–Eakin model, the higher rates are supported by recharge estimates of 300 mm/yr for a high-elevation watershed in central Nevada that receives about 600 mm/yr precipitation (Lichty and McKinley, 1995). In addition, the preliminary net-infiltration and modified Maxey–Eakin models both indicate net-infiltration/recharge rates of 1 to 5 mm/yr for Yucca Mountain (fig. 8), which is in good agreement with recent local-scale estimates of net infiltration obtained at Yucca Mountain using a variety of methods (Flint and others, 2001c). Major differences in recharge estimates between the preliminary net-infiltration model (INFIL) and the Maxey–Eakin model occur throughout the Death Valley region for specific locations where the underlying bedrock is estimated to be either highly permeable Paleozoic carbonates or highly
Preliminary Estimates of Spatially Distributed Net Infiltration and Recharge for the Death Valley Region, Nevada–California
Figure 8. Modeled net infiltration using INFIL (A), and estimated recharge using the Maxey–Eakin modified method and cokriged precipitation (B).
Model Results
23
impermeable granitic intrusives and rhyolitic ash flow tuffs (fig. 3). For example, estimates of potential recharge (net infiltration) from INFIL are relatively high compared with the Maxey–Eakin results for mountainous locations bordering Death Valley and throughout the region to the east of the NTS (fig. 8). These locations consist of bedrock mapped as the Paleozoic carbonate aquifer, and are assigned the highest saturated hydraulic conductivity (36,000 mm/yr) for a consolidated rock type (fig. 3). In contrast, estimates of potential recharge from the netinfiltration model are low relative to recharge estimates from the Maxey–Eakin model for locations in the northern part of the NTS and for other locations having hydrogeologic rocks with relatively low saturated hydraulic conductivity (40 mm/yr for welded, fractured ash flow tuff or 0.4 mm/yr for granitic intrusives). In addition to the effect of saturated hydraulic conductivity on estimated net infiltration, major differences between the deterministic, process-based net-infiltration model and the empirical, precipitationbased Maxey–Eakin model are caused by the effect of soil thickness and the total soil-storage capacity. For example, the Maxey–Eakin model indicate recharge estimates of 1 to 5 and 5 to 10 mm/yr for large areas in the northern part of the model domain because of the higher estimates of precipitation in higher elevation basins. The net-infiltration model indicates that areas of potential recharge are restricted to upland soils throughout the Death Valley region, including the higher elevation basins in the northern part of the model domain. In general, the importance of the total soilstorage capacity and hydraulic conductivity of bedrock is well represented by the spatial distribution of results from the net-infiltration model, whereas the Maxey–Eakin results only reflect the spatial distribution of precipitation. For example, the Maxey–Eakin model estimates recharge at about 6 mm/yr for all locations receiving approximately 200 mm/yr [(8 in./yr (inch per year)] precipitation, regardless of soil thickness, soil properties, or underlying bedrock properties. The net-infiltration model predicts that potential recharge in response to 200 mm/yr precipitation occurs only for locations with thin soils. Where thin soils are combined with high permeability bedrock, such as the Paleozoic carbonate aquifers, relatively high net-infiltration rates (or potential recharge rates) are predicted. Where thin soils are combined with high permeability bedrock, high precipitation rates, and low air temperatures (such as the Spring Mountains), maximum potential recharge rates are predicted.
24
The potential recharge estimates obtained using INFIL (fig. 8A) and the recharge estimates obtained using the modified Maxey–Eakin model (fig. 8B) are both higher relative to recharge estimates obtained using the original Maxey–Eakin model. The net infiltration model and the modified Maxey–Eakin model are constrained by field measurements made at Yucca Mountain, which indicated that low recharge rates of 1 to 5 mm/yr are possible for upland locations with thin soils receiving less than 200 mm/yr (8 in./yr) precipitation, whereas the original Maxey–Eakin model defines recharge as zero for all areas receiving less than 200-mm/yr precipitation. Although the recharge rates below 200-millimeter per year are low, a large percentage of the total area modeled may be affected, resulting in a significant increase in the recharge volume relative to the original Maxey–Eakin method. The modeled regional distribution of the 1980–1995 Yucca Mountain precipitation record resulted in an average precipitation rate of 202 mm/yr for the 39,556-square kilometer2 area of the Death Valley ground-water flow model and a total annual precipitation input volume of about 8 billion m3/yr (cubic meter per year) (table 2). The total estimated net-infiltration volume obtained from the preliminary net-infiltration model for the area of the ground-water flow model is about 308 million m3/yr, or 3.9 percent of the precipitation input. In comparison, the modified Maxey–Eakin model (Hevesi and Flint, 1998) provides about 249 million m3/yr recharge using the 1980–1995 modeled precipitation record (table 2), whereas the original Maxey–Eakin model (Maxey and Eakin, 1950) provides about 188 million m3/yr recharge using the same precipitation model. A comparison of modeled net infiltration and recharge calculated using the Maxey–Eakin methods for the 1980–1995 modeled precipitation, and for estimates of average annual precipitation obtained using geostatistics (cokriging), was performed to evaluate the possible bias of the 1980–1995 modeled precipitation relative to average annual precipitation calculated from longer precipitation records. Average annual precipitation calculated using the cokriging method incorporated historical (1920 through 1993) precipitation records from a network of 114 precipitation stations within and adjacent to the Death Valley region (Hevesi and Flint, 1998). The cokriged average annual precipitation estimates are considered a more accurate representation of average climate than average annual precipitation estimates based on the 1980–1995 record. The cokriged estimates also are considered to be a more accurate representation of the spatial distribution of average annual precipitation.
Preliminary Estimates of Spatially Distributed Net Infiltration and Recharge for the Death Valley Region, Nevada–California
Table 2. Summary of precipitation, modeled net infiltration, and estimated recharge using Maxey–Eakin methods for the area of the Death Valley region ground-water flow model. [mm/yr, millimeter per year; m3/yr, cubic meter per year, —, no data] Average value Maximum value for area of for area of Death Valley Death Valley Precipitation Model Model Type ground-water ground-water flow model flow model (mm/yr) (mm/yr)
1980-1995 modeled precipitation
Minimum value for area of Death Valley ground-water flow model (mm/yr)
Total area volume (m3/yr)
765
76.0
7,977,847,038
7.8
363
.0
308,317,460
3.9
6.3
425
.0
248,747,681
3.1
4.8
191
.0
188,315,697
2.4
698
62.2
7,430,337,682
5.1
324
.0
201,946,907
2.7
3.7
175
.0
147,274,050
2.0
202
Model net infiltration Modified MaxeyEakin estimated recharge Original MaxeyEakin estimated recharge 1920-1993 cokriged precipitation
188
Modified MaxeyEakin estimated recharge Original MaxeyEakin estimated recharge
The comparison indicates that the modified Maxey–Eakin recharge estimates using the regionally distributed 1980–1995 modeled precipitation record are higher than results obtained using cokriged average annual precipitation rates (table 2, fig. 8B). The recharge estimated using the modified Maxey–Eakin model and cokriged precipitation is about 202 million m3/yr (or about 2.7 percent of the cokriged precipitation volume of about 7,400 million m3/yr), which is less than the recharge estimate of about 249 million m3/yr obtained using the 1980-1995 modeled precipitation record. The recharge estimated using the original Maxey–Eakin method and cokriged precipitation is about 147 million m3/yr (or about 2 percent of cokriged precipitation), compared to about 188 million m3/yr obtained using the 1980-1995 modeled precipitation record. Although the cokriged average annual precipitation is only slightly less than the 1980–1995 average annual precipitation, the differences in the recharge estimates are much greater, indicating the sensitivity of recharge obtained using
Net infiltration or recharge as a percentage of precipitation
—
—
the Maxey–Eakin models to the spatially distributed precipitation estimates. In general, the total infiltration volume estimated by the preliminary and uncalibrated net-infiltration model is about 50 percent higher than recharge obtained by the modified Maxey–Eakin method and cokriged average annual precipitation, and about double the recharge obtained by the original Maxey–Eakin method and cokriged average annual precipitation. Results from Maxey–Eakin methods using cokriged precipitation more closely match discharge measurements for the Death Valley regional ground water model area (D’Agnese and others, 1997). Therefore, the preliminary net-infiltration model, using the 1980–1995 modeled daily precipitation record, may overestimate recharge rates in the Death Valley region. However, the differences in the results are considered reasonable for an initial model application using preliminary model inputs, a preliminary model algorithm, and an incomplete model calibration.
Model Results
25
Comparison of Preliminary Net Infiltration Model Results with Previous Basinwide Estimates of Recharge A summary of previous basinwide recharge estimates for more than 100 hydrographic areas and subareas in the Great Basin (Harrill and Prudic, 1998), approximately one-third of which are within or adjacent to the Death Valley region, include a comparison of estimates using the original Maxey–Eakin method with estimates obtained using the chloride-mass-balance method for 16 hydrographic areas (Dettinger, 1989). That comparison indicates good agreement between the two methods, thus supporting the use of the empirical Maxey–Eakin method as a robust indicator of basinwide recharge (Harrill and Prudic, 1998). A comparison of modeled basinwide net-infiltration with the basinwide Maxey–Eakin recharge estimates in Harrill and Prudic (1998) was used to evaluate whether the preliminary net-infiltration estimates are appropriate for defining the magnitude and spatial distribution of recharge for the Death Valley regional three-dimensional saturatedzone ground-water flow model. The comparison includes estimates of recharge calculated using the original Maxey–Eakin method (Maxey and Eakin, 1950), as well as estimates calculated using the modified Maxey–Eakin method (Hevesi and Flint, 1998). The Maxey–Eakin methods were applied using two different estimates of average annual precipitation—the spatially distributed 1980–1995 precipitation estimates used in the net infiltration model and the 1920–1993 cokriged precipitation estimates. Recharge rates estimated using the preliminary net infiltration model (INFIL) and estimates using the modified Maxey–Eakin model, both as a function of precipitation rate (average annual precipitation) for the 1980–1995 modeled precipitation, are shown in figure 9. The figure shows precipitation, recharge, and net infiltration as basinwide average annual rates, rather than basinwide volumes, thus eliminating the effect of basin area. As indicated by the regression curves (power function), the relation between estimated recharge (net infiltration) and precipitation for the INFIL model is somewhat similar to the relation between estimated recharge and precipitation for the modified Maxey–Eakin model (fig. 9). The higher variability (scatter) of the INFIL (net infiltration) estimates is expected due to factors such as soil thickness and bedrock permeability, which are not accounted for in the modified or original Maxey–Eakin models. Relative to the Maxey–Eakin estimates, the INFIL estimates of recharge (net infiltration) are
26
higher in basins dominated by high permeability carbonate rock and lower in basins dominated by thick soils and lower permeability volcanic rock types. This is consistent with the qualitative comparison of the netinfiltration and recharge maps, again indicating that bedrock geology is a significant controlling factor. The results provided a qualitative indication of the sensitivity of the modeled net-infiltration estimates to soil thickness and bedrock hydraulic conductivity for a given precipitation rate. Table 3 shows precipitation and recharge (net infiltration) estimates using INFIL and the Maxey–Eakin methods for 1980–1995 annual precipitation within the 36 hydrographic areas and subareas (fig. 10) from Harrill and Prudic (1998). Tikapoo and Ivanpah Valleys are divided into north and south subareas in figure 10 and table 3. A comparison of the INFIL and modified Maxey–Eakin results indicates that the INFIL recharge (net infiltration) is, on average, greater even when expressed as a percentage of precipitation. In addition to the results in table 3, figure 11 shows a comparison of recharge estimates using the original Maxey–Eakin model and the 1980–1995 daily precipitation record, estimates from previous studies using the original Makey-Eakin model (Harrill and Prudic, 1998), and estimates using the modified Maxey–Eakin model and cokriged 1920-1993 average annual precipitation. All results were generated for the same 36 hydrographic areas and subareas relevant to the Death Valley ground-water flow model. The comparison shows that INFIL results are generally consistent with previous estimates of basinwide recharge for a given average annual precipitation. The annual precipitation and net-infiltration volumes in table 3 are based on the total area of the hydrographic areas. In all cases, recharge (net infiltration) estimates using INFIL are greater than the estimates of recharge presented in Harrill and Prudic (1998) (not included in table 3) and (with the exception of Mesquite Valley, the only basin from this area where the chloride mass-balance method was applied) the original Maxey–Eakin model. Results from the regional INFIL model included maximum netinfiltration of about 75 million m3/yr for Death Valley (5.1 percent of the total precipitation volume), about 35 million m3/yr for Pahrump Valley (7.1 percent of the total precipitation volume) (table 3), and about 30 million m3/yr for Tikapoo Valley (5.6 percent of the precipitation volume). These recharge estimates are considerably greater than the original Maxey–Eakin model estimates, which are 10 million m3/yr for Death Valley and 7 million m3/yr for Tikapoo Valley (Harrill
Preliminary Estimates of Spatially Distributed Net Infiltration and Recharge for the Death Valley Region, Nevada–California
and Prudic, 1998). The differences are partly due to differences in the spatially distributed precipitation used to obtain the Maxey–Eakin estimates. The original Maxey–Eakin model predicted recharge only for locations receiving at least 200-mm/yr (8-inches per year) precipitation, which makes the calculated recharge sensitive to the location of the 200-mm/yr isohyet. INFIL estimates (net-infiltration) show a fairly good agreement with the original Maxey–Eakin model recharge estimates as percentages of precipitation, rather than as absolute net infiltration and recharge.
For example, results from Harrill and Prudic (1998) indicate 5.7 percent of precipitation is recharge in the Death Valley hydrographic area, which compares well with the INFIL model result of 5.1 percent (table 3). In terms of absolute recharge volumes, however, the INFIL results were on average three to five times greater than the previous estimates of recharge. A comparison was also made between the INFIL model estimates using modeled 1980–1995 precipitation and the modified Maxey–Eakin estimated recharge using 1920–1993 cokriged average annual
Figure 9. Comparison of recharge estimated using INFIL and the modified Maxey–Eakin model both with the 1980–1995 precipitation estimates.
Model Results
27
Table 3. Precipitation and recharge estimates for 36 hydrographic areas and subareas in the Great Basin located within or adjacent to the Death Valley region. Hydrographic areas and number are from Harrill and Prudic (1998). [m3/yr, cubic meter per year]
Name of hydrographic area or sub-area
Hydrographic area number
1980–1995 precipitation (m3/yr)
Results obtained using the net infiltration model 1980–1995 net infiltration (m3/yr)
Results obtained using the modified Maxey-Eakin model Modified MaxeyNet infiltration as Modified MaxeyEakin as percentage of Eakin recharge percentage of 3 precipitation (m /yr) precipitation
Cactus Flat Sarcobatus Flat Pahrump Valley Amargosa Desert Groom Lake Valley
148 146 162 230 158A
261,617,832 445,090,878 490,701,342 502,352,813 399,326,229
2,428,726 9,022,921 35,076,528 10,026,975 15,924,253
0.9 2.0 7.1 2.0 4.0
11,800,722 10,996,492 21,783,292 2,764,233 14,254,118
4.5 2.5 4.4 .6 3.6
Papoose Lake Valley Indian Springs Valley Three Lakes Valley (North) Three Lakes Valley (South) Death Valley
158B 161 168 211 243
60,316,036 346,739,191 153,458,729 153,168,861 1,463,436,349
2,184,497 23,409,021 11,139,576 9,047,590 75,238,702
3.6 6.8 7.3 5.9 5.1
1,350,663 11,068,034 3,299,564 5,057,276 33,345,952
2.2 3.2 2.2 3.3 2.3
160 157 147 159 229
217,515,916 247,210,762 440,786,026 158,403,758 80,070,251
7,009,878 8,095,342 7,754,901 3,472,252 1,756,478
3.2 3.3 1.8 2.2 2.2
3,061,502 12,300,283 18,297,472 3,514,190 815,332
1.4 5.0 4.2 2.2 1.0
227A 227B 225 144 244
131,058,696 148,468,061 50,604,833 336,524,727 137,345,754
2,041,413 3,839,829 2,782,735 13,981,518 1,011,455
1.6 2.6 5.5 4.2 .7
1,866,258 6,062,564 617,974 13,063,808 700,618
1.4 4.1 1.2 3.9 .5
145 245 228 242 226
228,311,351 178,096,299 261,863,295 158,694,860 35,310,889
4,185,204 4,482,474 5,794,898 1,819,386 656,212
1.8 2.5 2.2 1.1 1.9
7,452,698 2,098,153 6,992,609 461,322 263,965
3.3 1.2 2.7 .3 .7
169B 169A 169 164A 164B
187,209,264 353,514,708 540,723,972 109,656,550 224,730,553
13,345,042 16,981,347 30,326,389 4,294,984 1,873,659
7.1 4.8 5.6 3.9 .8
4,154,367 11,129,708 15,284,075 1,459,209 2,631,017
2.2 3.1 2.8 1.3 1.2
Ivanpah Valley California Valley Mesquite Valley Chicago Valley Jean Lake Valley
164 241 163 240 165
334,387,102 54,566,777 189,357,989 38,739,969 40,787,549
6,168,643 1,678,769 8,259,395 1,113,834 267,666
1.8 3.1 4.4 2.9 .7
4,090,226 516,829 2,290,576 138,150 310,837
1.2 .9 1.2 .4 .8
Clayton Valley Hidden Valley (South) Alkali Spring Valley
143 166 142
350,934,263 13,336,407 189,740,369
17,696,766 34,537 4,371,460
5.0 .3 2.3
16,119,143 65,375 6,435,076
4.6 .5 3.4
Frenchman Flat Kawich Valley Gold Flat Yucca Flat Crater Flat Jackass Flat Buckboard Mesa Mercury Valley Lida Valley Valjean Valley Stonewall Flat Shadow Valley Oasis Valley Lower Amargosa Valley Rock Valley Tikapoo Valley South Tikapoo Valley North Tikapoo Valley Ivanpah Valley North Ivanpah Valley South
28
Preliminary Estimates of Spatially Distributed Net Infiltration and Recharge for the Death Valley Region, Nevada–California
precipitation within the 200-mm/yr precipitation isohyet for 21 hydrographic areas and subareas (tables 4 and 5). This analysis provided a more direct comparison with the original Maxey–Eakin model (Harrill and Prudic, 1998) that considered recharge only if there was at least 200-mm/yr precipitation. For the modeled 1980–1995 average annual precipitation,
the area within the 200-mm/yr isohyet is about 12,000 km2, the precipitation volume is about 3,100 million m3/yr, and the net infiltration volume is about 190 million m3/yr (table 5). For 1920–1993 cokriged average annual precipitation, the area within the 200-mm/yr isohyet is about 8,000 km2, the
Figure 10. Selected hydrographic areas of the Great Basin (from Harrill and Prudic, 1998).
Model Results
29
precipitation volume is about 2,100 million m3/yr, and the recharge volume obtained using the modified Maxey–Eakin method is about 106 million m3/yr (table 4). These results indicate that the modeled 1980–1995 precipitation used as input for the INFIL model likely represents a wetter-than-average period for the Death Valley region, and thus may not be a good representation of longer-term average precipitation rates. Figure 12 shows a comparison of the INFIL model and the original and modified Maxey–Eakin recharge estimates calculated in this study (using both the 1980–1995 modeled precipitation and the cokriged average annual precipitation) with previous recharge estimates (Harrill and Prudic, 1998) for the hydrographic areas shown in figure 10. The comparison
illustrates the overestimation of both net infiltration (recharge) using INFIL and the various Maxey–Eakin estimates calculated in this study, relative to the previous recharge estimates from the original Maxey–Eakin model (fig. 12) (Harrill and Prudic, 1998). In addition, the Maxey–Eakin and INFIL estimates calculated in this study showed the same degree of scatter, relative to the previous Maxey–Eakin estimates (Harrill and Prudic, 1998). For many hydrographic areas, the INFIL results agreed with the Maxey–Eakin results calculated in this study, but neither the INFIL nor the calculated Maxey–Eakin results agreed well with the previous estimates (Harrill and Prudic, 1998). For some hydrographic areas, there is more than an order of magnitude difference between
Figure 11. Comparison of modeled net infiltration and estimated recharge volumes with precipitation volumes for areas receiving at least 200 millimeters average annual precipitation within hydrographic areas (see figure 10) of the Death Valley region.
30
Preliminary Estimates of Spatially Distributed Net Infiltration and Recharge for the Death Valley Region, Nevada–California
the estimates of recharge (net infiltration) in this study and the previous estimates. This strongly suggests that the precipitation estimates used in the previous Maxey–Eakin recharge estimates (Harrill and Prudic, 1998) were significantly different than either the modeled 1980–1995 average annual precipitation or the 1920–1993 cokriged average annual precipitation. The INFIL recharge (net infiltration) estimates are consistently higher than the previous estimates using the original Maxey–Eakin model (Harrill and
Prudic, 1998) partly because the precipitation estimates from the modeled 1980–1995 precipitation distribution are greater than those used to develop the previous recharge estimates. The INFIL model shows a better overall comparison to both the original and modified Maxey–Eakin recharge estimates when equivalent precipitation inputs are used. In general, variability in results for specific basins was expected because the preliminary netinfiltration model (INFIL) took many factors into
Table 4. Estimated precipitation and recharge volumes for areas within the 200-mm average annual precipitation isohyet, obtained for 21 hydrographic areas and subareas using cokriged estimates of average annual precipitation and the modified Maxey–Eakin model. [mm/yr, millimeter per year; m3/yr, cubic meter per year; km2, square kilometer] Area within 200-mm/yr Cokriged average annual Modified Maxey–Eakin Name of hydrographic area average annual Recharge as percentage precipitation estimated recharge or subarea precipitation isohyet of precipitation 3 3 (m /yr) (m /yr) (km2)
Cactus Flat Sarcobatus Flat Pahrump Valley Amargosa Desert Groom Lake Valley
759 200 798 64 1,013
176,781,407 47,633,374 255,012,536 14,410,770 251,334,292
6,290,758 1,687,403 28,712,994 400,882 10,723,893
3.6 3.5 11.3 2.8 4.3
133 500 279
32,875,996 131,237,551 67,841,510
751,191 7,725,298 2,807,405
2.3 5.9 4.1
209
59,191,101
4,434,368
7.5
1,410
358,241,411
18,293,772
5.1
Frenchman Flat Kawich Valley Yucca Flat Crater Flat Jackass Flat
219 931 303 28 131
47,792,494 229,456,022 72,016,847 5,995,956 29,261,893
1,166,874 9,238,780 2,624,850 143,084 810,398
2.4 4 3.6 2.4 2.8
Buckboard Mesa Mercury Valley Lida Valley Valjean Valley Stonewall Flat
478 22 288 71 197
114,145,191 5,101,682 66,603,094 17,006,016 44,597,775
4,146,966 155,419 2,185,730 646,345 1,281,588
3.6 3 3.3 3.8 2.9
Shadow Valley
237
54,651,887
1,754,011
3.2
8,268
2,081,188,804
105,982,007
Papoose Lake Valley Indian Springs Valley Three Lakes Valley (North) Three Lakes Valley (South) Death Valley
Totals
Model Results
31
account in addition to precipitation. However, the overall comparison between the two methods suggests that potential recharge estimated by the preliminary version of INFIL is higher than estimates using other methods, especially for basins receiving only moderate precipitation but containing a large percentage of upland areas underlain by highly permeable bedrock. Although preliminary, the estimates of average annual net infiltration obtained using INFIL provided a reasonable first approximation of the spatial distri-
bution of recharge under current climatic conditions and could be used as a first approximation of recharge for a regional saturated-zone flow model. The uncertainty in the net-infiltration estimates would likely be reduced if (1) uncertainty in input parameters, such as bedrock permeability, soil properties, and vegetation cover, was reduced; (2) uncertainty in the spatial distribution of daily climate input was reduced; (3) a longer period of time was modeled to better represent current climate conditions; (4) runoff was
Table 5. Estimated precipitation and net infiltration volumes for areas within the 200 millimeter per year average annual precipitation isohyet, obtained for 21 hydrographic areas and subareas using 1980–1995 modeled precipitation and net infiltration. [mm/yr, millimeer per year; m3/yr, cubic meter per year; km2, square kilometer] Area within 2001980–1995 modeled millimeter year Name of hydrographic average annual average annual area or subarea precipitation precipitation isohyet (m3/yr) (km2)
1980–1995 modeled net infiltration (m3/yr)
Net infiltration as percentage of precipitation
Cactus Flat Sarcobatus Flat Pahrump Valley Amargosa Desert Groom Lake Valley
1,023 1,013 717 146 1,294
261,615,365 240,944,673 216,305,870 32,840,225 316,877,825
2,429,960 8,396,312 31,561,104 2,175,862 15,751,565
0.9 3.5 14.6 6.6 5.0
Papoose Lake Valley Indian Springs Valley Three Lakes Valley (North) Three Lakes Valley (South) Death Valley
206 603 261 224 2,135
45,031,961 157,096,268 62,023,175 61,700,003 555,138,442
2,179,563 18,377,648 8,681,246 6,431,375 55,162,549
4.8 11.7 14.0 10.4 9.9
263 931 299 57 155
58,053,830 247,210,762 70,423,188 12,549,446 35,778,379
3,751,019 8,095,342 2,524,938 853,570 1,416,037
6.5 3.3 3.6 6.8 4.0
575 36 1,345 52 895
144,027,526 8,437,017 327,557,313 12,094,291 211,374,409
3,768,288 1,260,619 13,977,818 16,035 4,183,971
2.6 14.9 4.3 .1 2.0
118
27,019,423
2,590,312
9.6
12,348
3,104,099,391
193,585,132
Frenchman Flat Kawich Valley Yucca Flat Crater Flat Jackass Flat Buckboard Mesa Mercury Valley Lida Valley Valjean Valley Stonewall Flat Shadow Valley Totals
32
Preliminary Estimates of Spatially Distributed Net Infiltration and Recharge for the Death Valley Region, Nevada–California
Figure 12. Comparison of modeled net infiltration (results from INFIL) and estimated recharge (obtained in this study using various Maxey–Eakin models) to previous estimates of recharge (Harrill and Prudic 1998).
routed downstream and included as surface-water flow in the mass-balance calculations; (5) snowfall and snowmelt were included in the water-balance calculations; (6) the root-zone was discretized into multiple layers to better represent root density as a function of depth, bare soil evaporation, transpiration from fractured bedrock, and the redistribution of water in the root zone; and (7) deep percolation through thick unsaturated zones and lateral flow through perched saturated zones were included in the model.
SUMMARY A numerical water-balance model, INFIL, was used to provide preliminary estimates of net infiltration and recharge for the Death Valley region. The model is based on conceptual and numerical models developed
to estimate the distribution of net infiltration at Yucca Mountain, centrally located within the larger area of the Death Valley region. Model inputs defining physical basin characteristics were developed using a digital elevation model and information on soils, geology, and vegetation. Estimates of spatially distributed, daily precipitation for 1980–1995 were used to run the daily water-balance model and estimate the spatial distribution of average annual netinfiltration rates for current climatic conditions. Model results for this preliminary, uncalibrated application of INFIL over the 39,556-square kilometer area of the Death Valley regional ground-water flow model include an area-averaged net-infiltration rate of approximately 7.8 millimeters per year in response to an area-averaged precipitation input of about 202 millimeters per year. Estimates of net infiltration range from zero, for all locations that have soil thickness
Summary
33
greater or equal to 6 meters, to 363 millimeters per year at high elevations in the Spring Mountains, where precipitation is higher, soils are thin, and the underlying bedrock is permeable. Within the 36 hydrographic areas in the study area, INFIL results and recharge estimated using the modified Maxey–Eakin method showed general agreement (especially when using consistent precipitation estimates), providing confidence that net infiltration is a good indicator of recharge. However, when compared with previous estimates of recharge using the original Maxey–Eakin method, on average, recharge (net infiltration) was greater using INFIL. Maxey–Eakin recharge estimates using cokriged average annual precipitation for 1920–1993 were used to qualitatively analyze the sensitivity of netinfiltration and recharge estimates based on the modeled 1980–1995 precipitation at Yucca Mountain. This analysis indicated that much of the difference between results obtained in this study (both INFIL net infiltration and Maxey–Eakin recharge) and estimates of recharge from previous studies could be due to differences in precipitation input. In general, the INFIL net-infiltration model indicates a high variability in average annual net infiltration for the 36 hydrographic areas because of the effects of many controlling factors in addition to precipitation applied in the net-infiltration model, such as soil depth and bedrock permeability. The Maxey–Eakin recharge estimates show less variability because these estimates are a function of precipitation only. Although preliminary, the estimates of average annual net infiltration provide a reasonable first approximation of the spatial distribution of recharge under current climate and could be used as a first approximation of recharge for a regional saturatedzone flow model. Uncertainties in the net-infiltration estimates are due to uncertainty in critical model inputs such as precipitation, bedrock permeability, and soil properties. Comparison of model results with previous estimates of recharge suggests that the netinfiltration model might overestimate recharge due to uncertainty in model inputs such as bedrock permeability and soil properties. The uncertainty in the net-infiltration estimates would likely be reduced if uncertainty in model inputs was reduced, a longer period of time was modeled, additional components of the water balance (surface-water flow and snowmelt) were included in the model, and the root-zone was discretized into multiple layers. The uncertainty in the
34
use of net-infiltration estimates as recharge estimates would likely be reduced if deep percolation through thick unsaturated zones was included in the model.
REFERENCES CITED Beatley, J.C., 1976, Vascular plants of the Nevada Test Site and central-southern Nevada: Ecological and geographical distributions: U.S. Department of Energy Research and Development Administration Report TID26881, 308 p. Bedinger, M.S., Langer, W.H., and Reed, J.E., 1989, Groundwater hydrology, in Bedinger, M.S., Sargent, K.A., and Langer, W.H., eds., Studies of geology and hydrology in the Basin and Range Province, Southwestern United States, for isolation of high-level radioactive waste-Characterization of the Death Valley region, Nevada and California: U.S. Geological Survey Professional Paper 1370-F, 49 p. Campbell, G.S., 1977, An introduction to environmental biophysics (2nd ed.): New York, Springer-Verlag, 159 p. Campbell, G.S., 1985, Soil physics with BASIC: Transport models for soil-plant systems: Amsterdam, The Netherlands, Elsevier, Developments in Soil Science, no. 14, 150 p. D’Agnese, F.A., Faunt, C.C., Turner, A.K., and Hill, M.C., 1997, Hydrogeologic evaluation and numerical simulation of the Death Valley regional ground-water flow system, Nevada and California: U.S. Geological Survey Water-Resources Investigations Report 96-4300, 124 p. Davies, J.A., and Allen, C.D., 1973, Equilibrium, potential and actual evaporation from cropped surfaces in southern Ontario: Journal of Applied Meteorology, v. 12, p. 649–657. de Bruin, H.A.R., 1988, Evaporation in arid and semi-arid regions, in Simmers, I., ed., Estimation of natural groundwater recharge: Boston, Reidel Publishing Company, p. 73–88. Dettinger, M.D., 1989, Reconnaissance estimates of natural recharge to desert basins in Nevada, U.S.A., by using chloride-balance calculations: Journal of Hydrology, v. 106, p. 55–78. Eichinger, W.E., Parlange, M.B., and Stricker, H., 1996, On the concept of equilibrium evaporation and the value of the Priestley-Taylor coefficient: Water Resources Research, v. 32, no. 1, p. 161–164.
Preliminary Estimates of Spatially Distributed Net Infiltration and Recharge for the Death Valley Region, Nevada–California
Flint, A.L., and Childs, S.W., 1987, Calculation of solar radiation in mountainous terrain: Journal of Agricultural and Forest Meteorology, v. 40, p. 233–249. ———1991, Modification of the Priestley-Taylor equation for estimating evapotranspiration for soil water limited conditions: Journal of Agricultural and Forest Meteorology, v. 56, p. 247–260. Flint, A.L. and Flint, L.E., 2000, Near surface infiltration monitoring using neutron moisture logging, Yucca Mountain, Nevada; in Looney, B.B. and Falta, R.W., eds., Vadose zone science and technology solutions: Columbus, Ohio, Battelle Press, v. 1, p. 457–474. Flint, A.L., Flint, L.E., Bodvarsson, G.S., Kwicklis, E.M., and Fabryka-Martin, J.M., 2001a, Evolution of the conceptual model of vadose zone hydrology for Yucca Mountain: Journal of Hydrology, v. 247, no. 1–2, p. 1–30. ———2001b, Development of the conceptual model of vadose zone hydrology for Yucca Mountain, in Hsieh, P.A., Bahr, J.M., Doe, T.W., Flint, A.L., Gee, G.W., Gelhar, Solomon, D.K, van Genuchten, M. Th., and Wheatcraft, S.W., eds, 2001, Conceptual models of flow and transport in the fractured vadose zone, Washington, D.C., National Academy Press, p. 47–85. Flint, A.L., Flint, L.E., Hevesi, J.A., D’Agnese, F.A., and Faunt, C.C., 2000, Estimation of regional recharge and travel time through the unsaturated zone in arid climates, in Faybishenko, Boris, Witherspoon, P.A., and Benson, S.M., eds., Dynamics of fluids in fractured rock: Washington, D.C., American Geophysical Union Monograph series, no. 122, p. 115–128. Flint, A.L., Flint, L.E., Hevesi, J.A., and Hudson, D.B., 2001c, Characterization of arid land infiltration processes at Yucca Mountain, Nevada: in Evans, D.D., Rasmussen, T.C., and Nicholson, T.J., eds., Flow and transport through unsaturated fractured rock: Washington, D.C., American Geophysical Union Monograph series, no. 42, p. 135–149. Flint, L.E., and Flint, A.L., 1995, Shallow infiltration processes at Yucca Mountain—Neutron logging data, 1984-93: U.S. Geological Survey Open-File Report 95-4035, 46 p. Freeze, R.A., and Cherry, J.A., 1979, Groundwater: PrenticeHall, Englewood Cliffs, N.J., 604 p. French, R.A., 1983, Precipitation in southern Nevada; Journal of Hdraulic Engineering, v. 109, no. 7, p. 1023–1036. Grayson, D.K., 1993, The desert’s past - A natural prehistory of the Great Basin: Washington, D.C., Smithsonian Institution Press, 356 p. Grose, T.L., and Smith, G.I., 1989, Geology, in Bedinger, M.S., Sargent, K.A., and Langer, W.H., eds., Studies of geology and hydrology in the Basin and Range Province, southwestern United States, for isolation of
high-level radioactive waste: U.S. Geological Survey Professional Paper 1370-F, p. 5–19. Harrill, J.R., and Prudic, D.E., 1998, Aquifer systems in the Great Basin region of Nevada, Utah and adjacent states—Summary Report: U.S. Geological Survey Professional Paper 1409, 66 p. Hatton, T.J., 1998, Catchment scale recharge modeling: Melborne, Australia, CSIRO Publishing, Basics of Recharge and Discharge, pt. 4, 19 p. Hevesi, J.A., 2001, Simulation of net infiltration for modern and potential future climates: Las Vegas, Nevada, Office of Civilian Radioactive Waste Management, Analysis and Model Report ANL-NBS-HS-000032, 89 p. Hevesi, J.A., and Flint, A.L., 1998, Geostatistical estimates of future recharge for the Death Valley Region, in High Level Radioactive Waste Management, Proceedings of the Ninth Annual International Conference, Las Vegas, Nev., May 11-15, 1998: LaGrange Park, Ill., American Nuclear Society, p. 173–177. Hevesi, J.A., Flint, A.L., and Flint, L.E., 1994, Verification of a 1-dimensional model for predicting shallow infiltration at Yucca Mountain, in High Level Radioactive Waste Management, Proceedings of the Fifth Annual International Conference, Las Vegas, Nev., May 22-26, 1994: LaGrange Park, Ill., American Nuclear Society, p. 2323–2332. Hevesi, J.A., Flint, A.L., and Istok, J.D., 1991, Precipitation estimation in mountainous terrain using multivariate geostatistics: II. Isohyetal maps: Journal of Applied Meteorology, v. 31, no. 7, p. 677–688. Houghton, J.G., 1969, Characteristics of rainfall in the Great Basin: University of Nevada, Reno, Desert Research Institute, 205 p. Hunt, C.B., Robinson, T.W., Bowles, W.A., and Washburn, A.L., 1966, Hydrologic basin, Death Valley, California: U.S. Geological Survey Professional Paper 494-B, 138 p. Lichty, R.W., and McKinley, P.W., 1995, Estimates of ground-water recharge rates for two small basins in central Nevada: U.S. Geological Survey WaterResources Investigations Report 94-4104, 31 p. Maxey, G.B., and Eakin, T.E., 1950, Ground water in White River Valley, White Pine, Nye, and Lincoln Counties, Nevada: Nevada State Engineer, Water Resources Bulletin no. 8, 59 p. Munz, P.A., 1974, A flora of southern California: Berkeley, University of California Press, 1,086 p. Nichols, W.D., 1987, Geohydrology of the unsaturated zone at the burial site for low level radioactive waste near Beatty, Nye County, Nevada: U.S. Geological Survey Water-Supply Paper 2312, 52 p. Peterson, F.F., 1981, Landforms of the Basin and Range province defined for soil survey: Reno, University of Nevada, Nevada Agricultural Bulletin no. 28, 53 p.
References Cited
35
Philander, S.G., 1990, El Nino, La Nina, and the Southern Oscillation: New York, Academic Press, Inc., 291 p. Priestley, C.H.B., and Taylor, R.J., 1972, On the assessment of surface heat flux and evaporation using large-scale parameters: Manual Weather Review, v. 100, p. 81–92. Pyke, C.W., 1972, Some meteorological aspects of the seasonal distribution of precipitation in the Western United States and Baja California: University of California, Water Resources Center Contribution 139, 205 p. Stannard, D.I., 1993, Comparison of Penman-Monteith, Shuttleworth-Wallace, and the modified PriestleyTaylor evapotranspiration models for wildland vegetation in semi-arid rangelands: Water Resources Research, v. 29, no. 5, p. 1379–1392. Stewart, R.B., and Rouse, W.R., 1977, Substantiation of the Priestley and Taylor parameter α=1.26 for potential evaporation in high latitudes: Journal of Applied Meteorology, v. 16, p. 649–s650. Turner, A.K., 1996a, Digital Elevation Model (DEM) file of topographic elevations for the Death Valley Region of southern Nevada and southeastern California processed
36
from U.S. Geological Survey 1-degree digital elevation model data files: U.S. Geological Survey Open-File Report 95-287, 9 p. ———1996b, Digital hydrographic, land use/land cover, and hydrogeologic unit boundary files for the Death Valley Region of southern Nevada and southeastern California processed from U.S. Geological Survey 1:100,000, and 1:250,000-scale digital data files: U.S. Geological Survey Open-File Report 95-362, 21 p. Watson, P., Sinclair, P., and Waggoner, R., 1976, Quantitative evaluation of a method for estimating recharge to the desert basins of Nevada: Journal of Hydrology, v. 31, p. 335–357. Winograd, I.J., 1981, Radioactive waste disposal in thick unsaturated zones: Science, v. 212, no. 4502, p. 1457–1464. Winograd, I.J., and Thordarson, William, 1975, Hydrogeologic and hydrochemical framework, south-central Great Basin, Nevada-California, with special reference to the Nevada Test Site: U.S. Geological Survey Professional Paper 712-C, 126 p.
Preliminary Estimates of Spatially Distributed Net Infiltration and Recharge for the Death Valley Region, Nevada–California