37
Selected results of determining the friction interaction coeƥcient between crushed stone and polyester strip
The Mining-Geology-Petroleum Engineering Bulletin UDC: 550.8:552.1 DOI: 10.17794/rgn.2017.4.4
Original scientiƤc paper
Karolina Gradiški1; Mensur Mulabdi©2; Krunoslav Minažek2 1
University of Zagreb, Faculty of Mining, Geology and Petroleum Engineering (Pierottijeva 6, HR-10000 Zagreb, Croatia, PhD Student) Faculty of Civil Engineering Osijek (Vladimira Preloga 3, 31000 Osijek, Croatia, Full Professor) 3 Faculty of Civil Engineering Osijek (Vladimira Preloga 3, 31000 Osijek, Croatia, Assistant Professor) 2
Abstract In the past twenty years in Croatia, a number of reinforced earth constructions have been built, of which two reinforced earth walls stand out due to their dimensions: Striki©i and Sveta Trojica. In the building of these walls, polyester strips were used as reinforcement elements, whereas as Ƥll material crushed stone aggregate was used. For designing these constructions, knowledge about the interaction mechanisms between the polyester strip and the soil is required. So far, most of the published studies have been directed to the determination of the friction interaction coeƥcient of the polyester strip and the Ƥll material which was sand or gravel, whereas tests on the interaction between the geosynthetic strip and the crushed stone aggregate have not been performed. In order to determine the friction interaction coeƥcient between the crushed stone aggregate which is commonly used as Ƥll material and the geosynthetic strip, pull-out tests of the polyester strip were carried out. Apart from pull-out tests, large direct shear tests were performed to determine shear strength parameters of crushed stone strength. Predictions from the numerical model were compared to a series of pull-out tests, proving that the numerical model provides reasonable predictions of pull-out behavior.
Keywords Geosynthetic strip, crushed stone, pull-out test, large direct shear test, numerical analysis
1. Introduction The concept of earth reinforcement is not new: the inclusion of reinforcements to improve the stability of soil structures has been used by man for centuries. The oldest examples of reinforced earth constructions are Ziggurat Agar-Quf and the Great Wall of China where ¿brous plant, reed and wood materials were used as reinforcement. The modern concept of reinforced earth was invented by the French engineer Henry Vidal in the 1960s. Vidal developed a system of reinforced earth using Àat reinforcing strips laid horizontally in frictional soil. He described this material as “Reinforced Earth” and that term has become generic in many countries, being used to describe all forms of reinforced soil structures (Jones, 1988). Another term used for “Reinforced Earth” structures is Mechanically Stabilized Earth (MSE) structures. Nowadays thousands of MSE structures have been built around the world using different reinforcement materials, such as metallic or plastic strips, bars, sheets and grids. Reinforced earth constructions are widely used in civil engineering, geotechnics and mining because of its aesthetics, Àexibility, simple Corresponding author: Karolina Gradiški e-mail address:
[email protected] 37-43
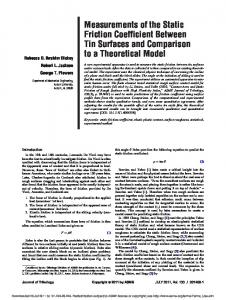
construction and the ability to adopt to different site conditions. Large settlements and differential rotations can be tolerated by reinforced soil without damage. A very common use of MSE is in the construction of gravity walls, where the wall is constructed using layers of compacted frictional ¿ll materials with the reinforcement placed horizontally at suitable vertical intervals and tied to interlocking precast reinforced concrete panels (see Figure 1). The ¿ll material must be a frictional to provide low deformability, drainage and adequate pull-out resistance between the soil and the reinforcement surface, whereby the reinforcement must have suf¿cient tensile stiffness. In comparison with conventional reinforced concrete walls for MSE walls savings of up to 20% - 30% can be obtained, especially for heights over 5 m (Clayton et al., 2013). In the past few years in Croatia, many MSE structure were built, but considering the dimension of construction two very tall walls can be selected, the Strikiüi (2006) and Sveta Trojica (2012) walls. The walls were built in the coastal region as part of a major highway construction project. To avoid metal in the construction of the wall (because of possible problems with corrosion – near sea area), strips made of polyester ¿bers coated with high density polyethylene were used as reinforcement. The back¿ll material was made of crushed rock
38
Gradiški, K.; Mulabdi©, M.; Minažek, K.
Figure 1: Section of Reinforced Earth (Clayton at al., 2013)
from the neighboring site and the wall facing was made of precast T-shaped reinforced concrete panels. Basic design criteria for these two and all other reinforced earth structures demand the checking of external and internal stability. The checking of external stability is assessed in the same way as for conventional gravityretaining walls, whereas the checking of internal stability is unique for each type of structure. The internal stability of the reinforced zone must be checked with respect to tensile rupture of the reinforcement and pull-out failure between the ¿ll and the reinforcement. Tensile failure depends on the tensile capacity in the reinforcement element. Pull-out failure depends on geometry and properties of the reinforcement, soil properties and the interaction between soil and reinforcement and it is often determined by pull-out tests. The pull-out resistance of polyester strips and crushed stone aggregates is the subject of this research. Previous research of pull-out resistance of polyester strips was conducted for sand and gravel (Lo, 1998 and Abdelouhab et al., 2009, 2010); there is no information about pull-out tests with crushed stone aggregate and polyester strips. To understand the interaction mechanism between polyester strips and crushed stone aggregate better, information about mechanical properties of the soil (fric-
tion angle, dilatancy and cohesion) and the results of the friction interaction coef¿cient from pull-out tests is required. To obtain information about mechanical properties of the soil, it is necessary to perform tests with the large direct shear testing (LDST) device, and to obtain information about the friction interaction coef¿cient, it is necessary to perform pull-out tests. Performing large scale pull-out tests to investigate the interaction between the geosynthetic strip and the soil, as well as the inÀuence of the boundary condition on the test results is a dif¿cult and time-consuming task. Therefore, it is advisable to use the numerical method as a tool to improve the understanding about what factors inÀuence the test results. In this paper, the preliminary results of the experimental and numerical investigation of the interaction between a polyester strip and crushed stone aggregate together with the interaction coef¿cients obtained from tests are shown.
2. Determination of the interaction coeƥcient The determination of the interaction coef¿cient included pull-out tests on strips and crushed stone aggregate, and large direct shear tests for the determination of the friction and dilatancy angle of crushed stone alone. Both of these types of tests were used in the experimental phase of the research, followed by an interaction investigation using FEM numerical analysis.
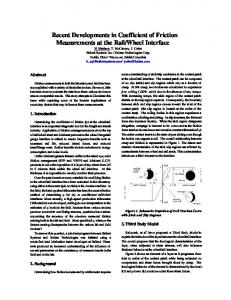
2.1. Determination of interaction coeƥcient from pull-out test The pull-out resistance of the polyester strip and the crushed stone aggregate was investigated using a large pull-out testing device developed at the Faculty of Civil Engineering in Osijek, Croatia. A series of tests with different grain size distributions of crushed stone were carried out, and the interaction coef¿cients between the polyester strip and the crushed stone aggregate were determined (Gradiški et al., 2016).
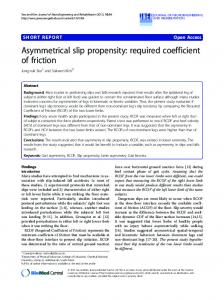
Figure 2: GFOS big pull-out testing device (Minažek, 2010) The Mining-Geology-Petroleum Engineering Bulletin and the authors ©, 2017, pp. 37-43, DOI: 10.17794/rgn.2017.4.4
39
Selected results of determining the friction interaction coeƥcient between crushed stone and polyester strip
2.1.1. ȹTesting equipment and program At the Faculty of Civil Engineering in Osijek, a large pull-out testing device (the GFOS pull-out device) was developed in 2002 (see Figure 2). The pull-out device consists of four 20 cm high horizontally set rectangular elements put one over the other and ¿rmly framed, so that the size of the GFOS pull-out device is L x B x H = 1.9 x 0.9 x 1.2 m (Minažek & Mulabdiü, 2013). The impact of the front wall was reduced by a 25 cm wide sleeve at the front wall and through this sleeve a polyester strip was threaded. The strip was connected to the piston load by a specially equipped ¿xing system, consisting of ¿ve fastening plates around which the strip was wrapped. The pull-out tests were carried out on a polyester strip placed on compacted crushed stone aggregate. The aggregate was placed in a box in 10 cm thick layers and compacted with a vibro-compactor until the height of 40 cm was reached after which the strip was placed at the center of the pull-out box. Four extensometers were used to monitor the displacements along the length of the polyester strip during pullout together with measurement of piston movement. The wires for extensometers were pulled through the metal protective tubes and the ends were attached to the strip at determined positions on the front, medium and rear part of the strip length. The pullout force was provided by a screw jack driven by an electric motor. Tests were carried out at a controlled displacement rate of 1 mm per minute and pullout force was measured by a load cell with a maximum capacity of 80 kN (Gradiški et al., 2016). Normal stress was applied using airbags placed between the top of the ¿ll and the cover plate. The tests were conducted with three different vertical stresses of 50 kPa, 100 kPa and 150 kPa.
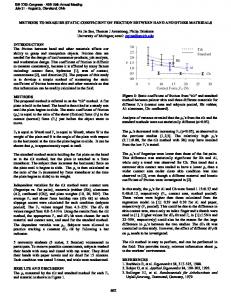
Figure 3: The displacement of the Ƥrst point in the pull-out box under diơerent conƤnement stresses
con¿nement stresses of 50 kPa, 100 kPa and 150 kPa. The test results showed an increase in the pull-out force with increased con¿nement pressure (see Figure 3). The interaction coef¿cient is an important parameter in the calculations of stability of MSE structures. This parameter quanti¿es interaction (the adherence) of the reinforcement and the soil. In dense and dilatant granular soils, as the strip is being “pulled out”, the soil in the vicinity of the strip will be subjected to considerable shearing. Shearing will lead to volumetric dilation when the granular soil is in a well-compacted state. However, this dilatancy of the soil in the vicinity of the strip is constrained, leading to an increase in the normal stress, ın and acting directly on the strip up to a value which exceeds the average overburden stress acting on the surrounding soil (Lo, 1998). The vertical stress applied on the strip becomes: (1)
2.1.2. Materials used in testing The ¿ll material used in the tests was crushed stone aggregate classi¿ed as GW according to ASTM D 24800 (2000). The material had 100% passing the 75 mm sieve and approximately 5% passing the number 200 sieve. The material was compacted with a vibratory compactor. The reinforcement element used in the tests was a strip made of discrete channels of closely packed high tenacity polyester ¿bers encased in a polyethylene sheath. In the test, strips with a tensile force of 100 kN were used. The strip was 90 mm wide and 6 mm thick. The length of the strip inside the pull-out box was 1.65 m, whereas the total length of the strip used in one test was more than 1.9 m.
2.1.3. Results of the pull-out tests The pull-out tests for the polyester strip and crushed stone aggregate were performed under three different
This phenomenon is named constrained dilatancy (Abdelouhab et al. 2010) and the real friction coef¿cient, f is expressed: (2) To include this phenomenon and the inÀuence of dilatancy in the design procedure, Schlosser and Bastick (1991) de¿ned the interaction coef¿cient fS/GSY: (3) Where: f – true coef¿cient of friction between soil and reinforcement ǻıv – increase of normal stress on the reinforcement due to restrained dilatancy. Since in this research the ǻıv around the strip was not measurable during the pull-out test, the friction interac-
The Mining-Geology-Petroleum Engineering Bulletin and the authors ©, 2017, pp. 37-43, DOI: 10.17794/rgn.2017.4.4
40
Gradiški, K.; Mulabdi©, M.; Minažek, K.
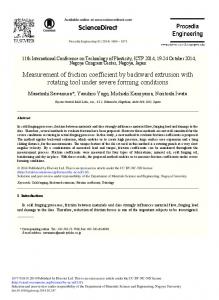
tion coef¿cient was calculated according to the formula given by Schlosser and Elias (1978) related to the apparent friction coef¿cient: (4) Where: Pmax – maximum tensile force measured at the head of reinforcement (kN) ıv – normal effective stress acting in the vertical direction at the reinforcing strip (kPa) b – reinforcement width (m) l – reinforcement length (m). The test results of the apparent friction interaction coef¿cient decrease as the con¿nement stress increases (see Figure 4).
Figure 5: Large direct shear testing (LDST) developed at the Faculty of Mining, Geology and Petroleum Engineering
tem. The large shear box has dimensions for the preparation of samples of 300×300×300 mm. The computerbased measurement system consists of the National Instruments LabVIEW computer program, data acquisition and signal conditioning system as well as displacement and pressure transducers.
2.2.1. Material used in testing
Figure 4: The apparent friction interaction coeƥcient for polyester strip and crushed stone aggregate
2.2. Determination of friction angle and dilatancy of crushed stone aggregate from large direct shear testing The large direct shear testing (LDST) device was developed at the Faculty of Mining Geology and Petroleum Engineering in Zagreb for direct shear testing of materials with a relatively large particle size, which cannot be tested with standard testing devices. The LDST device was developed in order to facilitate the testing of coarse/aggregate materials like gravel and crushed stone or materials obtained by recycling. The development of the device was partially ¿nancially supported by the University of Zagreb and mainly by the Geomechanical laboratory of the Faculty of Mining, Geology and Petroleum Engineering. The LDST device consists of a main steel frame, large shear box, two hydraulic columns, SBEL servo and an electrical hydraulic pump and computer based measurement system, as seen in Figure 5. Special attention was paid to the construction of the large shear box and the development of the computer-based measurement sys-
The ¿ll material used in pull-out tests was well-graded crushed stone aggregate. The material used in the large direct shear test is classi¿ed as GW according to ASTM D 248-00 (2000). Since the dimension of the direct shear box is 300 x 300 x 300 mm, the maximum particle size was limited to 31.5 mm. In the pull-out test, material with a maximum grain size of 60 mm was used, and in the large direct shear test a scalped sample, from which particles larger than 31,5 mm had been removed, was used. The coef¿cient of uniformity, Cu was 9.82, and D60 was 4.681 mm. The material was weighed before being placed inside the shear box, and the density was determined for each specimen. The density ranged between 2140 kg/m3 and 2163 kg/m3.
2.2.2. Results of testing The direct shear tests of crushed stone aggregate were performed under three different normal stresses: 85 kN/ m2, 150 kN/m2 and 215 kN/m2, whereas the shear stress was measured as a function of shear displacement. The secant friction angle for each specimen is calculated using the arctangent function of shear and normal stress ratio at the failure. The dilatancy angle is determined by applying the method of least square from the vertical displacement versus the horizontal displacement curve. The highest friction angle was determined for the lowest normal stress (85 kN/m2), and the lowest friction angle was determined for a normal stress of 215 kN/m2. The determined friction angles and dilatancy angles are presented in Table 1.
The Mining-Geology-Petroleum Engineering Bulletin and the authors ©, 2017, pp. 37-43, DOI: 10.17794/rgn.2017.4.4
41
Selected results of determining the friction interaction coeƥcient between crushed stone and polyester strip
Table 1: Secant friction angle and dilatancy for crushed stone aggregate
Normal stress kN/m2 85 150 215
Secant friction angle (°) 51.1 47.9 42.7
Dilatancy (°) 13.5 9.8 11.3
3. Finite element analysis In the pull-out tests, the deformations are highest at the leading part of the strip, reducing towards the rear of the strip. The pull-out force developed along the reinforcement mobilizes development of shear stresses in the soil, and as a consequence, the magnitudes and directions of the principal stresses in the soil are being continuously altered (Yogarajah & Yeo, 1994). Additional complication in the interpretation of the results arises from the stress-strain properties of the material, when polymeric reinforcements are used. This complex behavior makes the interpretation of pull-out results very dif¿cult (Yogarajah & Yeo, 1994). Numerical modeling can be very useful for overcoming this problem when analyzing the pull-out behavior of strip reinforcement in the soil. The very often used Plaxis software has proven to be a powerful and accurate tool to predict pull-out test results (Bergado et al., 2003, Abdi & Zandieh, 2014, Yu et al., 2015, Sukmak et al., 2016). Thus, the ¿nite element program Plaxis was used in the present study to simulate the pull-out test for a polyester strip and crushed stone aggregate. The ¿nite element analysis was performed in plane strain conditions using 15 node triangular elements and each element contains 12 stress points.
3.1. Geometry of the model To simulate the pull-out test in the numerical analysis, the pull-out box was modeled similar to the actual size of the test box (see Figure 6) with dimensions L x B x H = 1.65 x 0.9 x 0.7. Since the box was made of metal plates, it was reasonable to assume that soil particles
cannot move in the direction perpendicular to the boundary, so the bottom boundary was modeled by total ¿xity, and side boundary was ¿xed in the x-direction. The reinforcement, however, was allowed to move freely in the x – direction, whereas the displacement was simulated as horizontal nodal displacement at the leading edge of the strip. Displacement in the y – direction of the leading part was constrained and displacement was applied in the x-direction, which matches the conditions presented in the pull-out test. Normal pressure was applied on the top surface of the soil by a uniformly distributed load.
3.2. Material models and parameters The soil material used in pull-out tests was crushed stone aggregate, and in the numerical model it was modeled as a linearly elastic-perfectly plastic material with the Mohr-Coulomb (MC) failure criteria. The MC model requires a total of ¿ve parameters: Young’s modulus (E), Poisson’s ratio (ȣ), cohesion (c), internal friction angle (ij) and dilatancy angle (ȥ) (Plaxis 2016). These parameters are familiar to most geotechnical engineers and can be obtained through basic tests on soil samples. The internal friction angle and dilatancy angle were determined using large direct shear tests and pull-out tests. Douglas (2002) stated that the secant friction angle is most commonly quoted when test results are published. In the present analysis, the secant friction angle for the crushed stone aggregate was used. The secant friction angle was given for three different con¿ning stresses of 50 kPa (referred to as C1), 100 kPa (referred to as C2) and 150 kPa (referred to as C3). Young’s modulus was determined from in situ plate load tests on similar materials. The material properties of the crushed stone aggregate used in the test are shown in Table 1. The strip was simulated using Geogrid elements that are slender structures with axial stiffness but no bending stiffness. The basic material property for the Geogrid element is the axial stiffness EA (Plaxis, 2016), which was evaluated from Young’s modulus of the strip 2500 MPa and the transversal area of strip with a width of 90 mm and a thickness of 6 mm. The interaction between the soil and Ge-
Figure 6: Geometrical model in the Plaxis 2D 2016
The Mining-Geology-Petroleum Engineering Bulletin and the authors ©, 2017, pp. 37-43, DOI: 10.17794/rgn.2017.4.4
42
Gradiški, K.; Mulabdi©, M.; Minažek, K.
ogrid element was modeled by Interface element. These elements have the properties of Young’s modulus (E), Poisson’s ratio (ȣ), friction angle (ij), dilatancy (ȥ) and cohesion (c). The value of the interface element can be set using two options: a) by the reduction factor (Rint) applied to the soil material when de¿ning soil properties and b) by de¿ning different soil properties for the interface element. When the option of reduction soil properties Rint is selected, it is only possible to de¿ne values equal to soil properties or lower (Rint 1.0). In this analysis, the friction angle for material was increased to the value determined in the pull-out test. The dilatancy was determined from the relation recommended by Plaxis (2016), where dilatancy (ȥ) is equal to the friction angle (ij) minus 30°. Material parameters used in the analysis are presented in Table 2. Table 2: Model parameters for crushed stone aggregate
Parameter
Unit
Material model Young’s modulus (E) Poisson’s ratio (ȣ) Cohesion (c) Friction angle (ij) Dilatancy angle (ȥ)
kN/m2
C1 C2 C3 (50 kPa) (100 kPa) (150 kPa) MC MC MC 70 000
70 000
70 000
-
0.35
0.35
0.35
kN/m2 °
0.1 65
0.1 55
0.1 49
°
35
25
20
good agreement with the measured data. The tensile force determined through numerical analyses is slightly lower than the measured, see Figure 7. In the Plaxis 2D it is impossible to model the effect of constrained dilatancy which takes place in real pull-out force, which explains the lower pull-out force in the numerical analyses.
4. Conclusion In the experimental part of the study presented in this paper, the interface behavior of the polyester strip and crushed stone under various con¿nement stresses was measured and analyzed. The results of the experimental study show that the friction angle on the interface strip/ soil is higher than the friction angle of the soil alone, resulting in interaction coef¿cients which have values signi¿cantly higher than 1.0 for the lower values of con¿nement stress. The results also show that the interaction coef¿cient between the strip reinforcement and crushed stone aggregate decreases as con¿nement stress increases towards the value of 1.0 (for the con¿nement stress of 150 kPa). The results of laboratory pull-out tests and numerical simulations were also compared. The results of the numerical study show a slightly lower tensile force that can be explained by the effect of constrained dilatancy which is impossible to model in the 2D model. The pull-out of the polyester strip is a threedimensional problem, so that for a more accurate numerical analysis, it is advisable to perform the 3D numerical analysis.
3.3. Results of analysis
5. References
Numerical analyses were performed to simulate real pull-out tests with a polyester strip and crushed stone aggregate. The results of numerical analyses showed
Abdelouhab A., Dias D., Freitag N. (2009): Pull-out behaviour of geosynthetic strip reinforcements in coarse ¿ll physical and analytical modelling. GIGSA GeoAfrica 2009 Conference 2 - 5 September 2009, 1-9. Abdelouhab, A., Dias, D., Freitag, N. (2010): Physical and analytical modelling of geosynthetic strip pull-out behaviour. Geotextiles and Geomembranes, 28, 44-53. Abdi, M.R., Zandieh, A.R. (2014): Experimental and numerical analysis of large scale pull out tests conducted on clays reinforced with geogrids encapsulated with coarse material. Geotextiles and Geomembranes, 42, 494-504. ASTM D 248-00 (2000): Standard Practice for Classi¿cation of Soil for Engineering Purpose (Uni¿ed Soil Classi¿cation System), ASTM International, West Conshohocken, PA, www.astm.org, p. 1-12. Bergado, D.T., Youwai, S., Teerawattanasuk, C., Visudmedanukul, P. (2003): The interaction mechanism and behaviour of hexagonal wire mesh reinforced embankment with silty sand back¿ll on soft clay. Computers and Geotechnics, 30, 517-534. Brinkgreve, R.B.J., Kumarswamy, S., Swolfs, W.M. (2016): PLAXIS User’s Manual, Delft University of Technology and PLAXIS BV, Netherlands.
Figure 7: Pull-out force/displacement curve of polyester strip in crushed stone aggregate when comparing pull-out test and Plaxis
The Mining-Geology-Petroleum Engineering Bulletin and the authors ©, 2017, pp. 37-43, DOI: 10.17794/rgn.2017.4.4
43
Selected results of determining the friction interaction coeƥcient between crushed stone and polyester strip
Clayton, C.R.I., Woods, R.I., Bond, A.J. Milititsky, J. (2013): Earth Pressure and Earth-retaining Structures. Third Edition. Taylor & Francis Group, Boca Raton, 608 p. Douglas, K.J. (2002): The shear strength of rock masses. Thesis. School of Civil and Environmental Engineering. The University of New South Wales, Sydney, Australia, 545 p. Gradiški, K., Minažek, K., Mulabdiü, M., Kvasniþka, P. (2016): Preliminary results of soil - geosynthetic strip interaction in pullout. 6th European Geosynthetics Congress, Ljubljana, 1052-1060. Jones, C.J.F.P. (1985): Earth Reinforcement and Soil Structures. University of Newcastle upon Tyne, UK: Butterworth-Heinemann, 210 p. Lo, S.C.R. (1998): Pull-out resistance of polyester straps at low overburden stress. Geosynthetics International, 5(4), 361-382. Minažek, K. (2010): Modelsko ispitivanje interakcije geomreže i tla (Model testing of Geogrid-soil Interaction). Doctoral dissertation. University of Zagreb, Faculty of Civil Engineering, 296 p. (In Croatian)
Minažek, K. and Mulabdiü, M. (2013): A review of soil and reinforcement interaction testing in reinforced soil by pullout test. Graÿevinar, 65 (3), 235-250. Schlosser, F. & Elias, V. (1978): Friction in Reinforced Earth, Symposium on Earth Reinforcement, A.S.C.E. Pittsburgh, April 24-28., 735-763. Schlosser, F., Bastick, M. (1991): Reinforced Earth. In: Fang, H-Y. (eds.): Foundation Engineering Handbook Second Edition: Reinforced Earth. Springer Science + Business Media 778 – 795 p. Sukmak, K., Han, J., Sukmak, P., Horpibulsuk, S. (2016): Numerical parametric study on behaviour of bearing reinforcement earth walls with different back¿ll material properties. Geosynthetics International, 23 (6), 435-451. Yorgajah, I. & Yeo, K.C. (1994): Finite Element Modelling of Pull-Out Tests with Load and Strain Measurements. Geotextiles and Geomembranes, 13, 45-54. Yu, Y., Damians, I.P., Bathurst, R.J. (2015): InÀuence of choice of FLAC and PLAXIS interface models on reinforced soilstructure interactions. Computers and Geotechnics, 65, 164-174.
SAŽETAK Preliminarni rezultati odre¯ivanja koeƤcijenta interakcije lomljenoga kamena i poliesterske trake U Hrvatskoj je u posljednjih dvadesetak godina izgra¯eno više konstrukcija od armiranoga tla, pri «emu se po svojim dimenzijama isti«u dva zida od armiranoga tla, Striki©i i Sveta Trojica. U gradnji tih zidova kao armaturni elementi korištene su poliesterske trake, dok je kao materijal ispune korišten lomljeni kamen. Za projektiranje takvih konstrukcija potrebno je poznavanje mehanizma interakcije izme¯u poliesterske trake i tla. Dosadašnja ispitivanja koja su bila usmjerena na odre¯ivanje koeƤcijenta interakcije poliesterske trake i tla provedena su za slu«ajeve kada je kao materijal ispune korišten pijesak ili šljunak, dok ispitivanja interakcije armaturne trake i lomljenoga kamena nisu provedena. Kako bi se odredili koeƤcijenti interakcije izme¯u lomljenoga kamena i poliesterske trake provedena su ispitivanja izvla«enja poliesterske trake i lomljenoga kamena razli«itoga granulometrijskog sastava. Uz ispitivanja izvla«enja provedena su i ispitivanja izravnoga smicanja kako bi se odredili parametri «vrsto©e lomljenoga kamena, a rezultati laboratorijskih ispitivanja korišteni su za provedbu numeri«kih analiza izvla«enja trake iz tla.
Klju«ne rije«i: poliesterska traka, lomljeni kamen, ispitivanje izvla«enja, veliki izravni posmik, numeri«ke analize
Author(s) contribution Karolina Gradiški and Mensur Mulabdi© wrote the article and analysed the results of laboratory pullout test as well as the results of the numerical calculations. The main contribution of Krunoslav Minažek was the performance of all laboratory pullout tests and the analysis of test results.
The Mining-Geology-Petroleum Engineering Bulletin and the authors ©, 2017, pp. 37-43, DOI: 10.17794/rgn.2017.4.4