May 18, 2005 - My warm thanks are due to Claudia Schenk, Danuta Wyszynski and Inge Danialzik ...... observations were reported by P´erez and Frey [132].
Preparation and characterization of membrane adsorbers with tailored ion-exchange polymer brushes (Herstellung und Charakterisierung von Membranadsorber mit maßgeschneiderten Ionenaustausch Polymer-Bürsten)
By
Abdul Halim Bin Mohd Yusof From Melaka, Malaysia
Dissertation submitted to the Department of Chemistry of University Duisburg-Essen, in partial fulfilment of the requirements of the degree of Dr. rer. nat.
Approved by the examining committee on : 15 August 2008 Chair
:
Prof. Dr. Eckhard Spohr.
Advisor
:
Prof. Dr. Mathias Ulbricht.
Reviewer
:
Prof. Dr. Torsten C. Schmidt.
Essen, 2008
Abstract Preparation of novel separation membranes can be done very efficiently with controlled surface functionalization. Photo-initiated surface-selective graft copolymerization was performed using a recently developed entrapping method for the photo-initiator benzophenone (BP), and weak cation-exchange polymer brush structures on polypropylene membrane pore surfaces were obtained using acrylic acid (AA) as functional monomer. Effect of entrapping time, photo-initiator concentration, monomer concentration and UV irradiation time on membrane degree of grafting was investigated for optimization. The optimized method was obtained with 1 wt% BP, 60 min entrapping time, 15 min UV irradiation time.
Copolymerization of AA with “diluent” monomer acrylamide (AAm) and “cross-linker” monomer methylene bisacrylamide (MBAA) were done with optimized method for variations of the grafted layer. Membrane morphology and pore distribution was investigated using Scanning Electron Microscopy (SEM) and permporometry analyses. Graft copolymer composition analysis had been performed using FTIR-ATR spectroscopy. Performance characterizations had been done by measurements of membrane permeability at low and high pH as well as at different salt concentrations, by reversible binding of model proteins (Lysozyme (Lys), Bovine serum albumin (BSA) and Bovine immunoglobulin (IgG)), by inadvertent pH transient under membrane chromatography conditions, by breakthrough curves for system dispersion analysis and by preliminary separation of a model protein mixture (lysozyme-cytochrome c).
The SEM and permporometry show modification not significantly change the membrane morphology. The FTIR-ATR spectroscopy, permeability and inadvertent pH transient show graft copolymer are successfully grafted on the pore surface. Reversible binding of model protein, breakthrough curve and protein separation measurements reveal the graft copolymer structures have dominant influence on membrane adsorber performance. The most important result of this study is that chemical cross-linking within grafted layers with about the same amount of functional groups than those from linear grafted polymer leads to a significant improvement of porous adsorber performance because the protein separation factor and resolution is higher, the dynamic protein binding capacity can be
i
increased, the membrane permeability is significantly increased and it’s sensitivity to changes in eluent pH and salt concentration is much decreased, and consequently the solute dispersion within the membrane is reduced as indicated by significantly sharper breakthrough curves.
ii
Declaration This work was performed during the period from October 2003 to June 2008 at the Institute of Technical Chemistry II (Lehrstuhl für Technische Chemie II) Department of Chemistry University Duisburg-Essen under the supervision of Prof. Dr. Mathias Ulbricht.
I declare that this dissertation represents my own work except where due acknowledgement is made
(Abdul Halim Bin Mohd Yusof)
iii
For my family, who offered me unconditional love and support throughout the course of this dissertation
iv
Acknowledgement
After all those years, I've got quite a list of people who contributed in some way to this thesis, for which I would like to express thanks.
I would like to express my deep and sincere gratitude to my supervisor, Professor Dr. Mathias Ulbricht. His wide knowledge and logical way of thinking have been of great value for me. His understanding, encouraging, detailed and constructive comments, personal guidance and important support throughout this work have provided a good basis for the present thesis.
I would like to thank to my colleague Dr. rer. nat. Heru Susanto. He enthusiasm and integral view on research and his mission for providing high-quality work has made a deep impression on me. Beside helping in discussion and giving constructive criticism and continuous advice during the preparation of this thesis, he was as close as a brother to me.
I warmly thank to my other colleagues Kak Nadia Adrus (and family), Dr. rer. nat. Christian Geismann, Dr. rer. nat. Frank Schneider, Michael Belter, Dr. rer. nat. Uwe Langenhangen, Dimitrios Lazos, Melvy G. Chuquimia-Beltran, Dr. rer. nat. Abdus Salam, Dr. rer. nat. He Dong Ming, Mehmet Yavuz, Marcel Gawenda, Jun Wang, Rafael Tarnawski, Alexander Frieber, Haofei Guo, and Monica Belcea for their valuable advice. Their friendly and untiring help throughout my studies and especially during my difficult moments have been very helpful for this study.
My warm thanks are due to Claudia Schenk, Danuta Wyszynski and Inge Danialzik for their kind support and guidance have been of great value in this study.
I also wish to thank to Frau Barbara Steffens and Frau Roswitha Nordman-Silberg for their excellent references finding skills and secretarial work.
I am grateful to Mr. Mesut Acar, Mr. Arslan Yalcin, Mr. Yavuz to facilitate my early day here in Germany.
v
I appreciate many people concern, which their names are too many to mention, always stood by my side asking over and over again “When will you get it done? Next week? Next Month? When?”.
I owe my loving thanks to my father Hj Mad Yusap/Mohd Yusof Bin Hj Kamis and my mother Hjh Melah Bte Adam. They have lost a lot due to my research abroad. Without their encouragement and understanding it would have been impossible for me to finish this work. My special gratitude is due to my brothers Rasidi and Mohd Najib, my sisters Maznah, Massita, Siti Noraisah and Sakina and their families for their loving support.
My thanks go further to the Government of Malaysia (Public Service Department and Ministry of Higher Education), University Technology of Malaysia and University Duisburg-Essen for their financial support throughout my studies period.
Finally, I am grateful to God for everything. May your name be exalted, honour and glorify.
Essen, Germany, June 2008 Abdul Halim Bin Mohd Yusof
vi
Table of contents Abstract
i
Declaration
iii
Acknowledgement
v
Table of contents
vii
List of tables
xi
List of figures
xii
List of abbreviations and symbols
xxi
Chapter 1
Introduction
1
1.1
Background
1
1.2
Problem statement
3
1.3
Objective of the research
4
1.4
Scope of the research
5
Chapter 2
Literature Review
6
2.1
Research motivation
6
2.2
Liquid Chromatography
7
2.2.1
Qualitative Overview
7
2.2.2
Separation Mechanisms
7
2.2.2.1
Ion exchange
8
2.2.2.2
Reversed Phase
8
2.2.2.3
Hydrophobic interaction
9
2.2.2.4
Affinity
9
2.2.2.5
Size exclusion
10
2.2.3
Operation Modes
10
2.2.3.1
Differential
11
2.2.3.1
Batch adsorption
11
2.2.3.1
Displacement
11
2.2.3
Stationary phases
12
2.3
Conventional chromatography vs membrane
2.3.1
chromatography
12
System dispersion
14
vii
Table of contents
2.3.2
Membrane holder
16
2.3.3
Variations in membrane characteristics
19
2.3.4
Sorption kinetics
20
2.3.5
Solute size
20
2.4
Ideal adsorptive membranes
21
2.4.1
Polyolefine macroporous base membranes for membrane adsorber preparation
22
2.5
Surface functionalization of membranes
23
2.5.1
‘Grafting-to’ reactions
26
2.5.2
‘Grafting-from’ reactions
26
2.6
Polyelectrolytes
29
2.6.1
Polyelectrolytes at solid surfaces
30
2.6.1.1
‘Weak’ polyelectrolyte brushes
32
2.6.1.2
‘Strong’ Polyelectrolyte brushes
34
2.6.1.3
Neutral Polymer Brushes
34
2.6.2
Applications of polyelectrolytes
35
Chapter 3
Material and methods
41
3.1
Materials
41
3.2
Membrane functionalization via surface-initiated photograft copolymerization
3.3
Membrane permeability
3.3.1
Brief about membrane permeability and mechanism
41 43
involved
44
3.4
Visualisation/Imaging
44
3.5
Permporometry: Pore size distribution of the membrane
44
3.5.1
Background of permporometry
45
3.6
FTIR-ATR
45
3.7
Membrane adsorber evaluation in chromatography
46
3.7.1
Reversible protein binding capacity and protein separation.
46
3.7.1.1
Background about the dynamic capacity of membrane adsorber
47
3.7.1.2
Protein separation using chromatography techniques
48
3.7.1.2.1
Distribution of analytes between phases
49
viii
Table of contents
3.7.1.2.2
Resolution
51
3.7.2
Inadvertent pH transient
51
3.7.2.1
Background about Inadvertent pH transient
52
3.7.3
System Dispersion
53
3.7.3.1
Background about system dispersion and their analyses
53
3.7.3.1.1
The breakthrough curve (BTC)
53
3.7.3.1.2
Retention Time Distribution (RTD)
54
Chapter 4
Results and discussions
56
4.1
Membrane adsorber preparation: investigation effect of photo grafting conditions
56
4.1.1
Variation of entrapping time
57
4.1.2
Variation of functional monomer concentration.
58
4.1.3
Variation of UV grafting time
59
4.1.4
Loading in pre-grafting period and variation of photoinitiator concentration
4.2
61
Variation of grafted layer structure by ‘grafting-from’ copolymerization
65
4.2.1
Degree of grafting
66
4.2.2
Visualization of pore structure
67
4.2.3
Pore size distribution
70
4.2.4
The FTIR-ATR spectra
71
4.2.5
Membrane permeability
73
4.2.6
Dynamic protein binding capacity
78
4.3
Inadvertent pH transient- an alternative determination of ion-exchange capacity
79
4.3.1
Variation of functional monomer concentration
80
4.3.2
Variation of brush structure (Mixture of functional monomer and diluent or functional monomer and crosslinker)
81
4.4
System dispersion
83
4.4.1
Acetone as a tracer at different flow rate: Breakthrough curve investigation
84
ix
Table of contents
4.4.2
Acetone as a tracer at different flow rate: Residence time distribution (RTD) analysis
4.4.3
Lysozyme at variation of flow rate: Breakthrough curve investigation
4.4.4
87
90
Lysozyme as a tracer at variation of flow rate: Residence time distribution (RTD) analysis
95
4.4.5
Acetone vs lysozyme: Breakthrough curve investigation.
97
4.4.6
Variation of lysozyme concentration: Breakthrough curve investigation
4.4.7
Variation of protein size (Lysozyme, BSA, IgG): Breakthrough curve investigation
4.5
101
103
Dynamic evaluation of protein binding capacity based on breakthrough curve
110
4.5.1
Variation of flow rate
110
4.5.2
Variation of protein concentration
113
4.5.3
Variation of protein size
114
4.5.4
Modified membrane adsorber performance with lower protein excess
116
4.6
Protein separation - Cytochrome c and lysozyme mixture
119
4.6.1
Separation attempt: gradient slope variation
119
4.6.2
Effect of different brush structure on protein mixture separation
123
Chapter 5
Conclusion
126
Chapter 6
References
129
Appendix A
System dispersion
147
Appendix B
Residence time distribution (RTD) analysis
155
Appendix C
Protein separation
163
Appendix D
List of award, papers, posters and conferences during
Appendix E
doctoral study
166
Curriculum Vitae
169
x
List of tables Table 2.1
Different separation mechanisms in chromatography.
Table 3.1
Monomer mixtures (in pure water as a solvent) for preparation of
8
PP-based membrane adsorbers with varied grafted functional polymer layer structure. Table 3.2
Chromatography program for reversible protein binding capacity and protein separation.
Table 4.1
43
47
Comparison of PP-based membrane adsorbers, prepared using 15 g/L AA and 15 min UV time with different photo initiator concentration for pre-coating.
Table 4.2
63
Degree of grafting (DG) of modified polypropylene membranes grafted with mixture of monomer functional-cross-linker or diluent (60 min. entrap time, 1 wt% BP, 15 min. UV time).
Table 4.3
67
Water and buffer permeability at different pH and salt concentration for different membrane adsorbers.
76
Table 4.4
Binding capacity for lysozyme of PP-based membrane adsorbers.
78
Table 4.5
Mean residence time of acetone molecule in different module at different flow rate.
Table 4.6
The chromatography unit Peclet number (Per)of acetone in different module at different flow rate.
Table 4.7
96
The chromatography unit Peclet number (Per) of lysozyme in different module at different flow rate.
Table 4.9
Different types of protein: size and isoelectric point (pI).
Table 4.10
Effect of gradient slope variation on separation factor for mixture
Table 4.11
90
Mean residence time of lysozyme molecule in different module at different flow rate.
Table 4.8
89
97 104
cytochrome c and lysozyme.
122
Effect of different brush structure on protein mixture separation.
125
xi
List of tables
Table C-1
The effects of AA brush structure on separation factor and resolution of mixture cytochrome c and lysozyme at different gradient slope.
Table C-2
164
The effects of AAAAm brush structure on separation factor and resolution of mixture cytochrome c and lysozyme at different gradient slope.
Table C-3
164
The effects of AALMBAA brush structure on separation factor and resolution of mixture cytochrome c and lysozyme at different gradient slope.
Table C-4
164
The effects of AAHMBAA brush structure on separation factor and resolution of mixture cytochrome c and lysozyme at different gradient slope.
165
xii
List of figures Figure 1.1
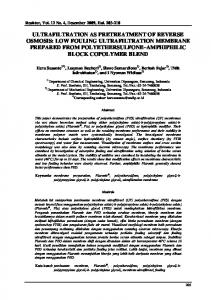
The inverse relation of feed concentration versus product price, which holds over 12 orders of magnitude, implies that isolation is the key in the separation.
2
Figure 2.1
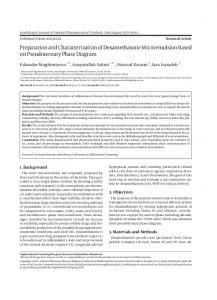
Schematic of the three operating modes of chromatography.
10
Figure 2.2
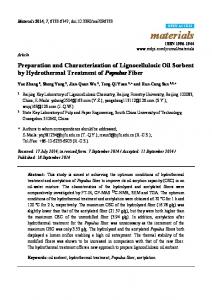
Transport phenomena involved in chromatographic beads and membrane adsorbers.
13
Figure 2.3
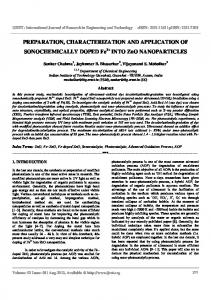
Dispersion in tubular reactor.
15
Figure 2.4
Flowsheet used for the system dispersion model.
15
Figure 2.5
Feed flow distribution and effluent collection in membrane adsorbers.
Figure 2.6
17
Convective Interactive Media disk housing(CIM ®) a) Component inside b) From outside appearance.
18
Figure 2.7
Diagram of membrane module based on new design.
19
Figure 2.8
Surface modification of membranes: a thin functional layer (green).
23
Figure 2.9
Heterogenous radical graft copolymerizations (grafting-from) of functional monomers on membrane polymers can be initiated via: (a) degradation of the membrane polymer (b) decomposition of an initiator in solution and radical transfer (c) adsorption of a type II photo-initiator.
Figure 2.10
27
Schematic description of the conformation of surface attached polymer molecules attached at one end to a surface. For strong adsorbing polymers and low grafting density the macromolecules assemble in ‘pancake-like’ conformation (A). For weakly adsorbing polymers a ‘mushroom’ conformation is found for low grafting densities (B), and if the grafting density is high, chain crowding at the surface leads to a stretching of the polymer molecules normal to the surface, resulting in a ‘brush’ conformation (C).
Figure 2.11
32
Membrane adsorber brush behaviour during filtration at a) pH 10 and b) pH 2.
34
xiii
List of figures
Figure 2.12
Different types of layer functionality attached on membrane adsorbers pore a) Ion exchange b) (Bio) affinity c) MIP affinity; only a) have polyelectrolytes structures.
Figure 2.13
37
Schematic illustration of the conformation of graft chain in relation to adsorption processes of protein. In the adsorption stage, the graft chain shows extended conformation under lower ionic strength conditions; thus protein can diffuse without any restriction for adsorption in the graft chains; the brush shrink as a result of multipoint binding of protein.
Figure 2.14
38
Schematic illustration of the conformation of graft chain in relation to elution processes of protein. In the elution stage, the graft chain shows a shrinking conformation under higher ionic strength conditions; thus the protein departing from the ion-exchange group through the graft chains.
Figure 3.1
40
Typical chromatogram for the evaluation of reversible protein binding to photofunctionalized PP membrane adsorbers.
48
Figure 3.2
Quantitative attempt to interprate chromatography evaluation.
50
Figure 4.1
Influence of entrapping time onto grafting on PP pore surface and protein binding capacity, measured for lysozyme (0.1 wt % BP; 15 g/L AA, 15 min UV time).
Figure 4.2
57
Influence of AA concentration onto grafting on PP pore surface and protein binding capacity, measured for lysozyme (60 min entrap time, 0.1 wt% BP, 15 min UV time).
Figure 4.3
58
Influence of UV irradiation time onto grafting on PP pore surface and protein binding capacity, measured for lysozyme (60 min entrap time, 0.1 wt % BP; 15 g/L AA).
Figure 4.4
Loading of photo-initiator BP by entrapping in porous PP membrane (60 min entrap time).
Figure 4.5
60
61
Influence of photo-initiator loading, adjusted by BP concentration in solution onto grafting on PP pore surface (60 min entrap time, 15 g/L AA; 15 min UV time).
62
xiv
List of figures
Figure 4.6
Water permeabilities at two different pH values of PP-based membrane adsorbers, prepared using 15 g/L AA and 15 min UV time with different photo initiator concentration for pre-coating.
Figure 4.7
Variation of three-dimensional weak cation exchanger layers on the PP pore surface.
Figure 4.8
69
Charaterization of membrane pore size by Pemporometry for UPP and AALMBAA modified membrane.
Figure 4.11
68
SEM images for membrane cross section a) UPP b) AA c) AAAAm d) AAHMBAA.
Figure 4.10
66
SEM images for membrane surface a) UPP b) AA c) AAAAm d) AAHMBAA.
Figure 4.9
64
70
The FTIR-ATR spectra for PP membranes grafted from monomer solutions (AA / AAm mixtures) of varied composition. Note: characteristic band of carbonyl for AAm is at 1655 cm-1 while the one for AA is at 1710 cm-1.
Figure 4.12
Composition from peak area for carboxyl and amide groups from FTIR-ATR spectra (c.f. Figure 11).
Figure 4.13
73
Buffer permeabilities at different salt concentrations of PP-based membrane adsorbers.
Figure 4.15
72
Water permeability at two different pH values of PP-based membrane adsorbers.
Figure 4.14
71
75
Water permeabilities at two different pH values of PP-based membrane adsorbers functionalized using reaction mixtures of functional (AA) and diluent monomer (AAm).
Figure 4.16
77
Lysozyme binding capacity for PP-based membrane adsorbers functionalized using reaction mixtures of functional (AA) and diluent monomer (AAm).
Figure 4.17
79
Inadvertent pH transient for PP-based membrane adsorbers, functionalized with different monomer concentration (cf. Figure 2).
80
Figure 4.18
Inadvertent pH transient (correlation of peak area) with DG.
81
Figure 4.19
Relationship between inadvertent pH transient capacity and protein capacity for various PP-based membrane adsorbers. The number in bracket indicates the DG.
82
xv
List of figures
Figure 4.20
Breakthrough curves of CIM empty module from acetone at different flow rate.
Figure 4.21
84
Breakthrough curves of CIM empty module, unmodified membrane (UPP) and modified membranes from acetone at 2 mL/min flow rate.
Figure 4.22
85
Calculated breakthrough slope within the range 30-70% (C/Co) for CIM, UPP and membrane adsorbers based PP using acetone.
86
Figure 4.23
RTD curve of CIM empty module at different flow rates.
87
Figure 4.24
RTD curves of CIM empty module, unmodified PP and modified membranes (AA, AAAAm, AALMBAA and AAHMBAA) at flow rate of 2.0 mL/min.
88
Figure 4.25
Breakthrough curves of CIM from lysozyme at different flow rate.
91
Figure 4.26
Breakthrough curves of AAAAm modified membrane from lysozyme at different flow rates.
Figure 4.27
Breakthrough curves of AAHMBAA modified membrane from lysozyme at different flow rates.
Figure 4.28
92
Breakthrough curves of CIM, UPP and modified membranes using lysozyme as the tracer at flow rate of 2 mL/min.
Figure 4.29
92
93
Calculated breakthrough slope within the range 30-70% (C/Co) for CIM, UPP and membrane adsorbers based PP using lysozyme.
94
Figure 4.30
RTD curve of CIM empty module at different flow rate.
95
Figure 4.31
RTD curve of CIM empty module and unmodified PP membrane at flow rate of 1.5 mL/min.
Figure 4.32
Breakthrough curves of CIM from acetone and lysozyme at 2 mL/min flow rate (cf. Figure 21 and 28).
Figure 4.33
100
Breakthrough curve for AAHMBAA from acetone and lysozyme at flow rate of 2 mL/min (cf. Figure 21 and 28).
Figure 4.36
99
Breakthrough curves of AAAAm at flow rate of 2 mL/min(cf. Figure 21 and 28).
Figure 4.35
98
Breakthrough curves of UPP from acetone and lysozyme at 2 mL/min flow rate (cf. Figure 21 and 28).
Figure 4.34
96
100
Breakthrough curves of AALMBAA modified membrane at different concentration of lysozyme.
101
xvi
List of figures
Figure 4.37
Breakthrough curve of CIM, UPP and modified membranes from lysozyme with 5 mg/mL concentration.
Figure 4.38
102
Calculated breakthrough slope within the range 30-70% (C/Co) for CIM, UPP and membrane adsorbers based PP at different lysozyme concentration.
103
Figure 4.39
Breakthrough curves of CIM from different types of proteins.
104
Figure 4.40
Breakthrough curves of UPP from different size of proteins.
105
Figure 4.41
Breakthrough curves of AALMBAA from different size of proteins.
106
Figure 4.42
Breakthrough curves of CIM, UPP and modified membranes for small protein (lysozyme: 14 kDa, Acetate buffer, pH 5).
Figure 4.43
Breakthrough curves of CIM, UPP and modified membranes of big protein (BSA: 66 kDa, Acetate buffer, pH 5).
Figure 4.44
107
108
Calculated breakthrough slope within the range 30-70% (C/Co) for CIM, UPP and membrane adsorbers based PP using different protein types.
Figure 4.45
Membrane adsorber protein capacity based on 10% of initial point breakthrough curve (10% BTC).
Figure 4.46
112
Membrane adsorber capacity based on 10% of initial point breakthrough curve (10% BTC).
Figure 4.48
111
Membrane adsorber capacity based on integral complete area under the curve.
Figure 4.47
109
113
Membrane adsorber capacity based on 10% of initial point breakthrough curve data.
115
Figure 4.49
Modified membrane protein capacity for different type of proteins.
117
Figure 4.50
Profiles of new gradient slope.
120
Figure 4.51
Individual and mixture peak of elution curve for cytochrome c, lysozyme and mixture cytochrome c and lysozyme, at elution gradient slope is 0.0555 M/mL.
Figure 4.52
121
Individual and mixture peak of elution curve for cytochrome c, lysozyme and mixture cytochrome c and lysozyme. at elution gradient slope 0.0277 M/mL.
122
xvii
List of figures
Figure 4.53
Profile of elution curve for mixture cytochrome c and lysoyzme with different modified membrane all at gradient slope G40 = 0.0277 M/mL.
Figure A-1
Breakthrough curves of unmodified membrane (UPP) from acetone at different flow rate.
Figure A-2
147
Breakthrough curves of AALMBAA modified membrane from acetone at different flow rate.
Figure A-3
124
147
Breakthrough curves of CIM, unmodified membrane (UPP) and modified membranes from acetone at 2.5 ml/min flow rate.
148
Figure A-4
Breakthrough curves for UPP from lysozyme at different flow rate.
148
Figure A-5
Breakthrough curves for AA modified membrane from lysozyme at different flow rate.
Figure A-6
Breakthrough curves of AALMBAA modified membrane from lysozyme at different flow rates.
Figure A-7
151
Breakthrough curve of CIM, UPP and modified membranes from lysozyme with 3 mg/ml concentration.
Figure A-12
151
Breakthrough curves of AAHMBAA modified membrane from different concentration of lysozme.
Figure A-11
150
Breakthrough curves of AAAAm modified membrane from different concentration of lysozme.
Figure A-10
150
Breakthrough curves of AA modified membrane from different concentration of lysozme.
Figure A-9
149
Breakthrough curves of CIM, UPP and modified membranes from lysozyme at 0.5 ml/min flow rate.
Figure A-8
149
152
Breakthrough curve of CIM, UPP and modified membranes from lysozyme with 10 mg/ml concentration.
152
Figure A-13
Breakthrough curves of AA from different size of proteins.
153
Figure A-14
Breakthrough curves of AAAAm from different size of proteins.
153
Figure A-15
Breakthrough curves of AAHMBAA from different size of proteins.
154
Figure A-16
Breakthrough curves of CIM, UPP and modified membranes from big protein (IgG: 150 kDa, Acetate buffer, pH 5).
154
Figure B-1
RTD curve of UPP at different flow rates.
155
Figure B-2
RTD curve of AA at different flow rates.
155
xviii
List of figures
Figure B-3
RTD curve of AAAAm at different flow rates.
156
Figure B-4
RTD curve of AALMBAA at different flow rates.
156
Figure B-5
RTD curve of AAHMBAA at different flow rates.
157
Figure B-6
RTD curves of CIM empty module, unmodified PP and modified membranes (AA, AAAAm, AALMBAA and AAHMBAA) at flow rate of 0.5 mL/min.
Figure B-7
157
RTD curves of CIM empty module, unmodified PP and modified membranes (AA, AAAAm, AALMBAA and AAHMBAA) at flow rate of 1.0 mL/min.
Figure B-8
158
RTD curves of CIM empty module, unmodified PP and modified membranes (AA, AAAAm, AALMBAA and AAHMBAA) at flow rate of 1.5 mL/min.
Figure B-9
158
RTD curves of CIM empty module, unmodified PP and modified membranes (AA, AAAAm, AALMBAA and AAHMBAA) at flow rate of 2.5 mL/min.
Figure B-10
159
RTD curves of CIM empty module, unmodified PP and modified membranes (AA, AAAAm, AALMBAA and AAHMBAA) at flow rate of 3.0 mL/min.
159
Figure B-11
RTD curve of unmodified PP at different flow rate.
160
Figure B-12
RTD curve of CIM empty module and unmodified PP membrane at flow rate of 0.5 mL/min.
Figure B-13
RTD curve of CIM empty module and unmodified PP membrane at flow rate of 1.0 mL/min.
Figure B-14
162
RTD curve of CIM empty module and unmodified PP membrane at flow rate of 3.0 mL/min.
Figure C-1
161
RTD curve of CIM empty module and unmodified PP membrane at flow rate of 2.5 mL/min.
Figure B-16
161
RTD curve of CIM empty module and unmodified PP membrane at flow rate of 2.5 mL/min.
Figure B-15
160
162
Profile of elution curve for mixture cytochrome C and lysoyzme with different modified membrane all at gradient slope G20 = 0.0555M/mL.
163
xix
List of figures
Figure C-2
Profile of elution curve for mixture cytochrome c and lysoyzme with different modified membrane all at gradient slope G80 = 0.0139 M/mL.
163
xx
List of abbreviations and symbols PE
Polyethylene
PP
Polypropylene
PC
Polycarbonate
PS
Polysulfone
PES
Polyethersulfone
PVA
Polyvinylalcohol
CE
Cellulose esters
UV
Ultraviolet
SEM
Scanning electron microscope
FTIR-ATR
Fourier Transform Infrared Attenuated Total Reflection
FDA
Food and drug administration
DNA
Deoxyribonucleic acid
-CH2COO-
Carboxymethyl
-SO3-
Sulfonate
-C2H4N+(C2H5)2
Diethylaminoethyl
xxi
C1
Methyl
C18
Octadecyl
BTC
Breakthrough curve
CIM
Convective Interaction Media® housing
tD
Time scale of diffusion
dp
Diameter of the pore
D
Diffusion coefficient of the solute
tR
Residence time in the membrane stack
L
Thickness of the membrane stack
v
Interstitial velocity
BSA
Bovine serum albumin
UF
Ultrafiltration
NF
Nanofiltration
RO
Reverse osmosis
ED
Electrodialysis
MF
Microfiltration
xxii
PVP
Polyvinyl pyrrolidone
BP
Benzophenone
MIP
Molecular Imprinting
PET
Polyethylene terephthalate
PAN
Polyacrylonitrile
PVDF
Polyvinylidene Fluoride
hv
UV irradiation
NaOH
Natrium Hydroxide
HCl
Acid Hydrochloric
NaCl
Natrium Chloride
AA
Acrylic acid
Lys
Lysozyme
MBAA
Methylene bisacrylamide
HEPES
4-(2-hydroxyethyl)-1-piperazineethanesulfonic acid
IgG
Immunoglobulin G
DG
Degree of functionalizations/grafting
xxiii
mo
Membrane initial weight
mgr
Modified membrane weight (after modification)
msp,A
Specific weight (per outer surface area) of the initial membrane.
AAm
Acrylamide
AAAAm
Poly(acrylic acid-co-acrylamide)
AAHMBAA
Poly(acrylic acid-co-methylenbisacrylamide), high content of MBAA
AALMBAA
Poly(acrylic acid-co-methylenbisacrylamide), low content of MBAA
V
Volume of water
t
Time in hour
A
Area of membrane
p
Pressure
ESEM
Environmental scanning electron microscope
PAA
Polyacrylic acid
PAAm
Polyacrylamide
PP
Polypropylene
xxiv
tr
Retention time
tra
Retention time for analyte A
trb
Retention time for analyte B
to
Time taken before gradient
Wa
Width of analyte A curve
Wb
Width of analyte B curve
k'a
Retention/capacity factor for analyte A
k'b
Retention/capacity factor for analyte B
α
Selectivity factor
R
Resolution
F(t)
Cumulative residence time distribution function
RTD
Residence time distribution
CSTR
Continuous stirred-tank reactor
PFR
Plug-flow reactor
MW
Molecular weight
xxv
Per
Chromatography unit of Peclet number
pI
Isoelectric point
xxvi
Chapter 1: Introduction 1.1 Background
Fermentation technology to produce high-value biological products such as proteins and nucleotides is commonly divided into ‘upstream’ and ‘downstream’ processing, which is primarily a way of saying bioreaction and bioseparations [1]. Bioseparations are critical to the success of modern biotechnology and represent a major manufacturing cost for a wide variety of products (50-70% of total costs) [2-4].
Bioseparations techniques can be broadly considered as consisting of four sequential steps:
(1)
Removal of insoluble material/component, which involves filtration or centrifugation.
(2)
Isolation of the product (also known as capture/concentration), which involves extraction or adsorption.
(3)
Purification of the product (also known as fractionation), which is usually accomplished by chromatography.
(4)
Polishing of the product, this consists of removing water, solvent or traces of impurities by drying or crystallization.
Obviously, the isolation and purification steps play the most important roles in these sequences. Figure 1.1 shows that whatever the purification process, the cost of the final product is dominated by its concentration in the initial feed. This implies that the isolation step is the key to control cost. The figure also indicates that recovery or separation of a product from its raw material depends upon the efficiency of the separation process involved. The processing costs to recover a pure component from a dilute mixture substantially increase with dilution. In such cases, the processing costs can be controlled only by the use of highly efficient downstream separation/purifications processes.
1
Chapter 1
3
10
2
Starting concentration (g/l)
10
101 100
Introduction
Water Ethanol Citric acid, monosodium glutamate Penicillin Amino Threonine acids Cephalosporin Gentamicin Antibiotics Gibberellic acid Microbial proteases Bulk enzymes Glukose oxidase
Amylases
10-1
Rennin
-2
10
10-3
Insulin
Monoclonal antibodies
Research/diagnostic enzymes
Glycerophosphate dehydrogenase
-4
10
Luciferase
10-5
Factor VIII
-6
10
Urokinase
10-7
Therapeutic enzymes
10-2
10-1
100
101
102
103
104
105
106
107
108
109
Selling price ($/kg)
Figure 1.1: The inverse relation of feed concentration versus product price, which holds over 12 orders of magnitude, implies that isolation is the key in the separation [5, 6].
Isolation and purification steps have long been dominated by packed/fixed-bed chromatography, despite limitations of high cost, batch operation, low throughput and complex scale-up. Owing to molecular-level complimentarily, chromatography offers high resolution, an imperative for therapeutic proteins where purity is the unassailable need [7].
In spite of the wide application of packed/fixed-bed chromatography based technologies, several new approaches in adsorptive separations such as monolith and membrane-based chromatography attract increasing attention to reduce the dependence of this unit operation [1-4, 7-8].
Membrane chromatography reflects technological advances in both membrane filtration and packed/fixed-bed liquid chromatography [9-15]. The benefits of membrane adsorbers are shorter diffusion times than those obtained in resin-based chromatography, as the interactions between molecules and active sites on the membrane occur in convective 2
Chapter 1
Introduction
through-pores, rather than in stagnant fluid inside the pores of an adsorber particle. For this reason, membrane adsorbers have the potential to maintain high efficiencies both at high flow rates and for separation of large biomolecules with small diffusivities. Due to the short process times, their use is also accompanied by reduced protein degradation and denaturation [15-17].
The studies of membrane chromatography are started with their preparation method. Most of commercial chromatography membranes today are developed through existing macroporous membrane whose chemical structure allowed modification for ligand attachment [18-19]. This is due to extensive technology has already been developed for production of porous membrane with controlled pore sizes, ranging from nuclear track etched membranes through thermally induced phase separation membranes. The most prevalent porous membranes available are produced from hydrocarbon polymers (polyethylene (PE) and polypropylene (PP)), aromatic polymers (polycarbonate (PC), polysulfone (PS) and polyethersulfone (PES)), aliphatic polyamides (nylon-6 and nylon66), and a few speciality polymers, such as polyvinylalcohol (PVA) and cellulose esters (CE). Each of these categories required different modification approaches. The aliphatic hydrocarbons, with no active side chain or end group, were typically modified by radiation chemistry [20-21].
Characterization and application are important parts in membrane chromatography studies. They have been characterized by a wide variety of methods and used for protein separations. Some works deal with hydrodynamic behaviour, some with charged capacity and others with binding and breakthrough studies based on single protein, but most works with separation of binary or multi-protein mixtures [13].
1.2 Problem statement
Although membrane chromatography has several clear advantages over packed bed chromatography, there are some limitations which need to be overcome such as inlet flow distribution, membrane pore size distribution, uneven membrane thickness and lower binding capacity [13]. Due to all these problems, future work on membrane chromatography is likely to be concentrated in the several following areas such as
3
Chapter 1
Introduction
screening of binding properties of existing membranes, developments of new membranes, improvement of process and equipment design and proper system selection [13].
With focus on the lower protein binding capacity, introducing a three-dimensional functional brush layer will enable membrane adsorber to obtain similar capacity per unit volume with conventional adsorbents [20]. However, these three-dimensional functional brush layers compromise the superior mass transfer capability of membrane adsorption process. Variation of three-dimensional functional brush layer structures with similar functional group amount but different layered structures would be very useful to determine what kind of structures minimize the reduction of mass transfer capability and have the best performance.
This study is important because it will give greater understanding and ability to control the performance of membrane adsorber [21]. Although important, less attention is given to control precisely the layered structure inside the membrane pore in membrane chromatography study; this work will focus on modified commercial porous membrane with new simple technique, surface functionalization via photo-grafting using photoinitiator entrapping method [21]. This technique enables us to precisely control and tailor the internal brush layer structure.
1.3 Objective of the research
In general, the objectives of this research are:
i)
Optimize surface functionalization via photo-grafting using photo-initiator entrapping method to prepare membrane adsorber.
ii)
Prepare membrane adsorbers with different brush structure based on previous optimized method.
iii)
Characterize and evaluate modified membrane to determine brush structure that leads to high performance of membrane adsorber.
4
Chapter 1
Introduction
More specific research objectives include:
i)
Study on the effects of process parameters, i.e. entrapping time, monomer concentration, and UV irradiation time and photo-initiator concentration on degree of grafting, dynamic protein capacity and permeability.
ii)
Study the effect of grafted functional monomer and combination diluent/cross-linker mixture on capacity and performance of modified membrane.
iii)
Preliminary evaluation of protein mixture separation by modified membrane.
1.4 Scope of the research
The work begins with optimization of the surface functionalization via photo-grafting using photo-initiator entrapping method. The optimization will focus on variation of entrapping time, monomer concentration, UV irradiation time and photo-initiator concentration. The optimized method will be used later to produce membrane adsorber with different brush structure, this will be obtained via manipulation of monomer mixture composition and concentration. After that, membrane adsorber with different brush structure will be characterized with various methods such as gravimetry, visualisation via Scanning Electron Microscope (SEM), pore size distribution via permporometry, chemistry via Fourier Transform Infrared Attenuated Total Reflection (FTIR-ATR), permeability experiment using Amicon cell, inadvertent pH transient, breakthrough curve, protein binding capacity and protein mixture separation using AKTA purifier.
After introduction as chapter 1, chapter 2 of this dissertation will cover literature survey, chapter 3 will describe about materials and methods, chapter 4 results and discussions and finally chapter 5 is conclusions.
5
Chapter 2: Literature Review 2.1 Research motivation
Rapid developments in biotechnology and the pharmaceutical potential of biomolecules are fueling demand for reliable, efficient methods to purify preparative amounts of proteins, peptides and nucleic acids. Recombinant gene products currently approved for drug use by the food and drug administration (FDA) include insulin, growth hormone, interferons, erythropoietin and tissue plasminogen activator. Additional polypeptide therapeutics being examined in human clinical trials number in the hundreds, thousands more are currently being investigated. The overview in this section is mainly based on D.K. Roper et al. [9].
Recovery of fragile molecules requires attention to their unique characteristics. For example, time-consuming recovery processes cause unnecessary degradation of many gene products. Variants of protein and nucleic acids are generated during downstream processing by deamidation, oxidation, proteolysis, nicking and aggregation. The fraction of degradation products increases with residence time, so shorter process times can produce higher recoveries and product purity.
Mild processing conditions also help to maintain the native conformation and hence the biological activity of biomolecules. Avoiding extreme pH or temperature values, shear and exposure to air-water interfaces prevents subsequent denaturation of many enzymes. Avoiding non-polar solvents and hydrophobic adsorbents that are commonly used to purify small solutes also reduces destabilization of biological products.
Additional considerations arise, as biological molecules are prepared in sufficient amounts for evaluation as drug candidates. Selected purification methods must consistently remove potentially hazardous variants, in addition to host cell protein, DNA, endotoxins and viral elements, from complex feed streams. High resolution is commonly required to meet stringent purification standards set for recombinant DNA products.
6
Chapter 2
Literature Review
Large-scale recovery operations must be efficient, as the cost of recovering biomolecules can dominate total product manufacturing costs. Inefficient processes consume inordinate volumes of expensive chemicals (solvents, buffers and etc.) that must eventually be regenerated or disposed. Costs resulting from solvent tankage and consumption during downstream recovery represent a significant fraction of biological recovery costs. Finally, the reliability of process equipment must be well documented to merit approval from regulatory agencies.
These characteristics of biological products and considerations for their preparative recovery are important issue in order to decide which separation method best suit with those criteria.
2.2
Liquid Chromatography
2.2.1 Qualitative Overview
Many of the separation criteria above could be fulfill by liquid chromatography. It is an adsorptive separation, where a moving fluid phase contacts a stationary solid phase and the different components distribute between the two phases to various extents. The different binding distribution causes species to migrate through the chromatography column at different velocities, thus resulting in a separation. The variety of separation mechanism, operating modes and stationary phases that are typical of liquid chromatography are briefly reviewed in this chapter. More detailed information can be found in M. A. Teeters work [22].
2.2.2 Separation Mechanisms
In liquid chromatography, mixtures of biomolecules are separated by exploiting differences in molecular weight, shape, size, charge, hydrophobic character, and/or types of active sites. Five basic chromatography classes and the property exploited in each separation are summarized in Table 2.1 and briefly reviewed in this section.
7
Chapter 2
Literature Review
Table 2.1: Different separation mechanisms in chromatography.
Chromatography Class
Separation Property
Ion exchange
Charge
Reversed phase
Hydrophobicity
Hydrophobic interaction
Hydrophobicity
Affinity
Specific binding
Size exclusion (Gel permeation)
Size, shape
2.2.2.1 Ion exchange
Ion exchange chromatography is the most widely used process-scale chromatography technique. Through electrostatic interactions, cation and anion exchangers separate molecule based on charge. Cation-exchangers typically have carboxymethyl (-CH2COO-) or sulfonate (-SO3-) functional groups, while anion-exchangers have diethylaminoethyl (-C2H4N+(C2H5)2) or trimethylaminoethyl (-CH2N+(CH3)3) functional groups. The strength of biomolecule-adsorbent interaction depends largely on the charge density of biomolecules, which for protein can be adjusted by varying the buffer pH value.
As charged species are competing for corresponding active sites, the extent of binding can be altered using buffers with increased ionic strength. Running salt gradients, for example, increases the speed of the separation, and allows for selective adsorption and desorption of the biomolecule. It is not particularly selective between biomolecules with charge similarities, however the high capacity and high recovery typical of ion exchange chromatography warrant the wide spread use.
2.2.2.2 Reversed Phase
Reversed phase chromatography uses a non-polar stationary phase and solvent conditions that promote adsorption of non-polar regions of solutes. It is traditionally believed that a favorable entropy effect drives adsorption, although the exact retention mechanism has been debated. Most common reversed phase supports include alkylsilane-bonded materials, with the alkyl chains ranging from methyl (C1) to octadecyl (C18). A polar
8
Chapter 2
Literature Review
mobile phase promotes adsorption, while increasing organic modifiers (e.g methanol, isopropanol, acetonitrile) concentration subsequently causes solutes to desorb. Gradients in organic modifier concentration are used in reversed phase chromatography much like salt gradients in ion exchange chromatography. The stability of the biomolecule, particularly proteins, is an important factor to consider, as denaturation on the surface or harsh elution conditions may render the product inactive. Reversed phase chromatography is capable of very high resolution.
2.2.2.3 Hydrophobic interaction
Hydrophobic interaction chromatography is a subset of reversed phase chromatography, again with non-polar regions of solutes binding to alkyl chain functional groups. The functional group density is much lower in hydrophobic interaction chromatography and the biomolecules-sorbent interaction is reduced. This results in higher recoveries and activities of biomolecules, due to less harsh binding environments and elution conditions. Here binding is promoted at high salt concentration and elution under low salt concentrations, without addition of organic modifiers. Selectivity remains high, but hydrophobic interaction media have a lower capacity due to the lower functional group density. The mechanism of biomolecules bind to hydrophobic matrices in hydrophobic interaction is similar in reversed phase chromatography. The long-popular idea is that the driving force for adsorption is the increase in entropy that results from displacement of water molecules away from the hydrophobic matrices.
2.2.2.4 Affinity
Affinity chromatography is the most selective chromatography technique, relying on a biospecific interaction between the biomolecule and a ligand that is covalently bound to the stationary phase. Specificity may vary, for example, as ligand may be specific to a certain type of protein or to a whole class of proteins. It is important to have a reasonable means of desorbing the protein from the matrix. Biomolecules with tremendous affinities for specific ligands often require harsh elution conditions, resulting in a lower recovery and decreased activity of the protein product. Harsh elution conditions also affect the affinity ligand, shortening the column life time. Capacities of affinity columns are typically lower than that of ion-exchange columns. 9
Chapter 2
Literature Review
2.2.2.5 Size exclusion
Size exclusion chromatography separates according to the size of the solute and is the only type of chromatography that doesn’t involve chemical interactions between the solute and stationary phase. As a mixture is diffusing through a matrix of gel with a distribution of pore sizes, the different size species have accessibility to different pore volumes. The largest species, excluded from the smallest pore sizes, and are first to elute from the column, while the smallest species are last to elute from the column. Size exclusion columns have limited capacities, with primary use falling in later steps of recovery such as desalting and buffer exchange.
2.2.3 Operation Modes
Liquid chromatography can also be classified according to its basic operating mode. Depicted in Figure 2.1 are the column and elution profiles for differential chromatography, batch adsorption, and displacement chromatography of binary mixture.
Figure 2.1: Schematic of the three operating modes of chromatography [22].
10
Chapter 2
Literature Review
2.2.3.1 Differential
In differential chromatography, a small pulse of sample mixture is injected onto a column and the solute migrates through at different rates depending on their binding strengths. The eluting buffer may remain constant (isocratic elution) or may vary in ionic strength or pH (gradient elution), altering solute binding and migration velocities. Provided the migration velocities for each species differ enough, each solute is eluted in a separate peak with an area proportional to the mass of species. This quantitative behavior, along with small sample sizes, makes differential chromatography a popular analytical technique. While only a fraction of the column capacity is utilized at any given time, this technique is less useful on the production scale, where column are typically overloaded to separate large quantities of material. It is useful, however, in characterizing the efficiency of large column, by analyzing the shape of an eluted peak.
2.2.3.2 Batch adsorption
In batch adsorption (or frontal analysis), a large volume sample mixture is continuously fed onto column, with the retention of each species being dependent on a competitive binding equilibrium with the stationary phase. The weakest bound component elutes first, and is the only to elute in a relatively pure state. Subsequent components elute in conjunction with all previously eluting components, and when the adsorbent reaches saturation, the eluent concentration becomes equal to that of the feed. The adsorbed species can be washed from column by changing the mobile phase composition to one that eliminates solute binding. This mode of chromatography is useful in concentration dilute feed early in the early stages of a separation scheme. It is also used as a tool to determined adsorption isotherms for single and multicomponent systems.
2.2.3.3 Displacement
Displacement chromatography depends on competition of the solutes for active sites in the stationary phase. The mobile phase must favour strong adsorption of the solutes, where they are only displaced by other retained species. When the sample is introduced
11
Chapter 2
Literature Review
onto the column, the most strongly bound will occupy the first available sites, the next most strongly bound will occupy the next available sites, and the components will proceed to be arranged in order of absorbance strength. Finally, a displacer, with a greater affinity than any other solute, is introduced to the column, starting a displacement train that elutes the species in order of increasing affinity.
2.2.4 Stationary phases
Liquid chromatography separations are normally carried out using macroporous nominally spherical packing particles with diameters ranging from a few microns to over 100 microns. Internal pores, with sizes on the order of 30-100 nm, provided a large surface area for functional groups to bind solutes. A large pore size relative to molecular size also minimizes diffusion resistance within the particle. In the case of size exclusion chromatography, the range of pore diameters can go down to the order of nanometers, the molecular size of proteins. Smaller particle sizes offer the advantage of short diffusion times; however, they also result in large pressure drops. Since mass transfer and momentum transfer have the same dependence on particle radius, changing the particles radius has no effect on the ratio of mass to momentum transfer. An effort to increase the rate of mass transfer relative to momentum transfer has led to the development of nontraditional packings.
2.3 Conventional chromatography vs membrane chromatography
Membrane adsorbers have been studied for over 20 years as an alternative to conventional resin-based chromatography columns [9-15, 20, 22-27]. It can exist in a variety of configurations (stacked membranes, hollow fiber membranes, and spiral wound membranes) with a variety of adsorptive mechanism (e.g ion exchange, reversed phase, hydrophobic, affinity). However, focus in this work is membrane adsorber having stacked membrane configuration with ion exchange mechanism. The benefit of membrane adsorbers is the absence of long diffusion times that often occur in resin-based chromatography (Figure 2.2). In membrane adsorbers, the interactions between dissolved molecules and the active sites on the membrane occur in convective through-pores rather than in stagnant fluid inside the pores of an adsorbent particle. For 12
Chapter 2
Literature Review
this reason, the membrane units have the potential to maintain high efficiencies both at high flow rates and for use of large biomolecules with small diffusivities. A second feature of a typical membrane bed is the large cross sectional area relative to the bed length. These short, wide beds allow high velocities and large volumetric capacity with only modest pressure drops. These features lead to increased throughputs and short residence times, thus reducing protein degradation and denaturation. A large diameter to length ratio, however introduces the challenge of achieving uniform flow distribution across the membrane. This has been a significant problem in many cases, reducing the membrane efficiencies to the level of packed beds. Proper design of flow distributions can eliminate this problem. In addition to that, membrane adsorbers are generally easier and cheaper to mass-produce [13]. This makes it possible to have disposable membrane adsorbers. These devices can be used until the desirable properties (i.e. hydraulic permeability, binding capacity, selectivity and resolving power) are maintained. Once they ceased to function properly, these devices can be replaced. This type of flexibility eliminates the requirement for cleaning and equipment revalidation.
Figure 2.2: Transport phenomena involved in chromatographic beads and membrane adsorbers [27].
13
Chapter 2
Literature Review
One major problem facing membrane adsorber is the limited capacity of individual membranes along the liquid filtration path compared with that of chromatography beads, as the specific surface area available for the binding site of these membranes is lower. Introducing a three dimensional binding site layer may overcome this problem to obtain similar capacity per unit volume to that of conventional adsorbents [20, 23, 28-29]. However, three-dimensional binding sites compromise the superior mass transfer capability of membrane adsorption process. Proper design of three dimensional binding sites, which is the main focus of this dissertation, can reduce this problem.
In order to materialize the advantages of membrane adsober over column packed with beds, certain technical challenges that could reduce membrane adsorber performance should be control carefully. These technical challenges are [24]:
(1) Minimizing dispersion in the flow system. (2) Increasing uniformity in membrane thickness and pore size. (3) Speeding the sorption kinetics. (4) Tailoring membrane designs for different size solutes.
Deciphering the connections between these challenges and final system performance requires careful coupling of experimental characterization and mathematical models.
2.3.1 System dispersion
A good model of a membrane adsorber has to consider the entire flow system and not only the membrane unit. The effects of flow non idealities such as mixing, channeling and dead volumes, a term that comprises the membrane void volume, the volume of flow distributors, of the detector flow cell and of the pump head, should be included since their influence on the breakthrough curves is quite relevant. This is particularly true in the case of small downscale units in which the layered stack of membranes has often a volume that is smaller than the total volume of circuit, pump and detector. All these effects give rise to what is generally called system dispersion [30].
System dispersion according to model in Fogler and Missen (Figure 2.3) [31-32] could be represented by model of tubular reactor with an axial dispersion superimposed on the 14
Chapter 2
Literature Review
flow governed by Fick’s law of diffusion. This means that in addition to the bulk flow, every component in the mixture is transported through any cross section of the reactor in an amount resulting from molecular and turbulent diffusion. At first sight, this simple model appears to have the possibility of accounting only for axial mixing effects. It can be shown, however, that this approach can compensate not only for problems caused by axial mixing, but also for those caused by radial mixing and non flat velocity profiles [33].
Figure 2.3: Dispersion in tubular reactor [31].
In another development, system dispersion in membrane adsorber has been described by H. Yang using a combination of a continuous stirred tank reactor, CSTR, and an ideal plug flow reactor, PFR as illustrated in Figure 2.4 [34]. The CSTR takes into account the effect of flow mixing and non idealities, while the PFR considers the effects of time shifts and dead volumes. The overall system volume can be expressed as the sum of the two contributions.
Figure 2.4: Flowsheet used for the system dispersion model [34].
Experimental system dispersion curves can be obtained in the same way as the adsorption breakthrough curves, but in non-binding conditions.
15
Chapter 2
Literature Review
The importance of system dispersion in membrane stacks increases as the strength of binding of the solute to the matrix decreases. In analytical separations, typically a small aliquot of sample solution is injected into the mobile phase and carried into the layered stack. As the solutes in the sample are swept through the stack, they interact weakly and to different extents with the membrane surface and separate into bands. These bands broaden during travel through the device and solutes, interact the least with the membrane surface occur first in the emerging liquid. This mode of operation, isocratic elution chromatography, requires buffers and operating conditions such that binding is weak, binding capacity is small, binding isotherms are linear, and the number of plates is larger (a theoretical plate is a hypothetical zone or stage in which two phases, such as the liquid and vapor phases of a substance, establish equilibrium with each other, having more theoretical plates increases the efficacy of the separation process). If binding interactions were strong, then the sample would never be eluted from the membrane stack. If plate numbers were small, then the solutes would not separate. In this isocratic operation, the effects of system dispersion are magnified, because, for system such as these, where the number of plates must be large, a small amount of mixing in the flow system can dramatically reduce the number of plates to a level that is smaller that needed for separation.
Conversely, a large aliquot of sample solution is loaded into the membrane stack for capture mode chromatography (frontal analysis), nearly saturating the membrane surface. In this mode, strong binding, high capacity, near monolayer surface packing (near theoretical maximum), non-linear isotherms, and small plate numbers are desirable. For example, as few as 30 plates are sufficient to obtain a sharp breakthrough curve (BTC) and complete recovery of the target compound [35]. In this mode of operation, layered stacks are best as an alternative to column chromatography.
2.3.2 Membrane holder
Membrane adsorbers refer to the combination of the adsorptive membrane and the module in which these are housed. The module in addition to holding the membrane in place receives and directs the feed into the membranes, collects the permeate from the membrane and directs this to the outlet. Three types of membrane module can be used for chromatography separations: flat sheet type, hollow fibre type and spiral wound type 16
Chapter 2
Literature Review
(also called the radial flow type). The relative merit and demerits of different module types have been discussed by Klein et al. [36]. Flat-sheet type membrane adsorbers which use stacks of disc membranes are widely used for protein bioseparation. A stack of membranes typically has a large radial dimension compared to the axial dimension and hence inadequate feed flow distribution at the module inlet and effluent collection at the module outlet would result in inefficient membrane binding capacity utilization [13, 3739].For efficient utilization of adsorptive membrane the solute front in the feed flowing into the module should ideally hit all points on the leading membrane surface simultaneously. Also, the permeate from the last membrane in the stack should be collected in a uniform manner. These requirements can be reasonably meet when the membrane diameter is small as shown in Figure 2.5 (a). However, with most flat sheet membrane adsorbers, the inlet is in the form of a small circular channel which enters a space having a significant larger circular cross-section where the adsorptive membrane stack is housed as shown in Figure 2.5 (b).
Figure 2.5: Feed flow distribution and effluent collection in membrane adsorbers [40].
This abrupt increase in cross-sectional area makes uniform feed flow distribution at the module inlet particularly challenging. In the absence of adequate flow distribution arrangements, the feed entering the module during binding step would have a greater tendency to flow through the central regions of the membrane, rapidly saturating these much before the solute in the feed can reach the peripheral regions of the membrane. The outlet into which the permeate is directed is also a small circular inlet side is thus mirrored on the outlet side where material from the central region of the membrane is transported to the outlet before those from peripheral regions. The net results of these, i.e. 17
Chapter 2
Literature Review
inlet flow distribution and outlet flow collection inadequacies are poor utilization of membrane binding capacity within the module. The content in this section is mainly based on R. Ghosh et al. [40].
CIM Convective Interaction Media® housing(CIM®) as shown in Figure 2.6 was used to house membrane adsorber in this dissertation [41] . Although CIM® has been designed and optimized to allow efficient assembly and easy use of CIM® Short Monolithic Columns membrane adsorber can easily fit into it. In contrast to particle based columns that are characterized by a very low diameter to length ratio, the CIM® allows membrane adsorber to have large diameter to length ratio (diameter of 12 mm and a length of only 450 µm). The key features of the CIM® disk housing are: efficient distribution of the incoming jet of liquid; prevention of by-pass around the block of membrane adsorber stack material; mechanical support of the membrane adsorber preventing cracking when exposed to the high flow rate; easy column packing and unpacking, i.e., easy introduction and removal of the membrane adsorber from the housing.
b) a)
Figure 2.6: Convective Interactive Media disk housing (CIM®) a) Component inside b) From outside appearance [41].
In another development, Ghosh [42] successfully created new design of membrane holder with addressed the problems of flow distribution/collection in membrane modules. This designed based on incorporation of flow distributors/collectors on both the inlet and the outlet sides of the module (Figure 2.7). These distributors/collectors have a plurality of flow channels extending radially from central passages, each of these channels having a depth which is deeper adjacent to said central passages and shallower remote from these.
18
Chapter 2
Literature Review
Membrane binding capacity utilization could be significantly improved using this design. Improvements in module design are critical for a wider acceptance of membrane chromatography in biotechnology applications such as protein and DNA purification.
Figure 2.7: Diagram of membrane module based on new design [40].
2.3.3 Variations in membrane characteristics
Membranes cannot be made perfect. No matter how controlled the manufacturing process is, variations in membrane thickness, void fraction, and concentration of binding sites will occur. The effects of thickness and void fraction can be severe. Thus, variations in thickness must be kept under 3 % to have no effect on the performance of a single membrane layer, while membrane porosity should vary less than 1 % to avoid the decline performance [35]. Similarly, variations in the number of binding sites across a membrane, or between membranes, will reduce separation performance. However, layered stacks of membrane help to average out and reduce the effects of small variations in thickness, porosity, and ligand concentration characteristics of individual membranes.
19
Chapter 2
Literature Review
A stack of only three membranes is entirely adequate to achieve excellent performance [24].
2.3.4 Sorption kinetics
One notable limitation to the success of layered stacks is the slow sorption kinetics of some solute to bioaffinity ligands bound to layered stacks. For example, affinity systems consisting of solute-ligand combinations such as pepsin-pepstatin A, chymosin-pepstatin A , monoclonal antibody~Protein G, immunoglobulin G~Protein G , and immunoglobulin G~Protein A/G display slow binding kinetics. Binding kinetics are sometimes so slow that the performance enhancements expected for layered stack vs. beads cannot be observed. Rather than flow rate being limited by pressure drop, it is limited by slow adsorption-desorption kinetics. Thus, solute~ligand system must be examined on a caseby-case basis to determine if the sorption kinetics is sufficiently fast for layered stacks to be an advantage. In general, sorption kinetics are faster for ion exchange systems than for affinity systems, and the advantages of layered stacks are more likely to be realized for the former systems.
2.3.5 Solute size
One of the advantages of layered stacks is the potential to eliminate limitations originating from mass transfer to binding sites. For solute to be captured by binding sites on the membrane surface, the residence time of the liquid in the membrane must exceed the time for the solute to diffuse to the binding site on the surface and bind. Equation 2.1 shows an order of magnitude conservative estimate for the time scale of diffusion tD from the center of the pore to the wall [43-44]. tD = (dp)2 / (4 x D )
Equation 2.1
where dp is the diameter of the pore, and D is the diffusion coefficient of the solute. The residence time tR in the membrane stack is shown in Equation 2.2. tR = L / v
Equation 2.2
20
Chapter 2
Literature Review
where L is the thickness of the stack and v is the interstitial velocity. In other words, mass transfer limitations are eliminated when tR/tD >> 1. This situation does not occur for thin membranes (small L) having large pores (large dp) that are operated at high flow velocities (large v) in the separation of large solutes (small D). In general, membranes with a pore size of about 1 µm can be used to eliminate mass transfer limitations for large proteins when residence times are about one second [43]. However, for membrane having a pore size of 5 µm, residence times of 100 s or longer would required to obtained sharp breakthrough curves for large proteins.
For example, when bovine serum albumin (BSA) was captured using a layered stack having a pore size of 150 µm, the breakthrough curves were broad and depended considerably on flow rate at residence times of 2-40 min [43]. Obviously, this pore size was too large to eliminate mass transfer limitations at high flow velocities. A pore size of about 9 µm was predicted to be required to eliminate mass transfer limitations for BSA at a residence time about 1.5 min.
In conclusion, the size of the solute to be separated directly determines the characteristics of the membrane stack such as pore size and thickness as well as the required operating conditions including flow rate to achieve complete capture of the solute. For large solutes, membrane stacks must have a small pore sizes to eliminate mass transfer limitations, and to realize the potential advantages of high flow rate and low pressures drop.
2.4
Ideal membranes adsorber
For successful application in chromatography processes, membrane adsorbers should posses the following characteristics: (1) Macroporous structure to enable unhindered interaction of larger biomolecules or bionanoparticles with the bindings sites. (2) Adapted amount and density of binding sites (in either two-dimensional layer on the pore surface or three-dimensional layer extending into the pore space).
21
Chapter 2
Literature Review
(3) Hydrophilic and neutral surface to prevent non-specific interactions with the membrane material itself. (4) Chemically stable to withstand harsh conditions during separation and regeneration, and, when applicable, sterilization by autoclaving. (5) Physically stable to withstand trans-membrane pressure. (6) Low material and manufacturing cost to facilitate applications in large-scale industrial applications. All the above factors could be achieved through modification of existing commercial membrane. Several methods exist for this but two popular strategies are the functionalization of existing commercial porous membranes by chemical modification [45-46] and radiation-induced grafting methods [20-21, 23,29,47-48].
2.4.1 Polyolefine
macroporous base
membranes
for
membrane
adsorber
preparation
Hydrophilic commercial membranes such as cellulose acetate and poly(vinyl alcohol) membranes have the superior characteristic of less non-specific adsorption of proteins. However, they do not usually have good thermal stability and are susceptible to chemical and bacteriological agents, whereas the hydrophobic commercial membranes such as polyethylene and polypropylene have thermal stability and some chemical resistance. Surface modification of hydrophobic membranes that introduces hydrophilic segments on the surface may be an ideal method for combining both advantages of hydrophilic and hydrophobic membranes. Thermal stability and mechanical strength are maintained in the modified membranes due to the hydrophobic nature of polymer backbones by introducing transport characteristics of hydrophilic membranes, such as less non-specific adsorption of proteins. More detailed information can be found in H. Zou [14].
22
Chapter 2 2.5
Literature Review
Surface functionalization of membranes
The intention of a surface modification of a membrane is either to minimize undesired (secondary) interactions (adsorption or adhesion) which reduce the performance (membrane fouling), or to introduce additional interactions (affinity, responsiveness or catalytic properties) for improving the selectivity or creating an entirely novel separation function (Figure 2.8). The overview in this section is mainly based on M. Ulbricht review [49].
Figure 2.8: Surface modification of membranes: a thin functional layer (green) [49].
Figure 2.8 shows an improved or novel membrane performance via surface modification of membranes due to a thin functional layer (green). The extend of modification either on the outer or the entire surface will leads to effective solutions for problems or to novel principles. The modification depend on pore structure and separation function. ‘Secondary’ interactions (occurring also without a separation) should be controlled without sacrifying the separation function of the membrane. Controlling ‘primary’ interactions can be used to tailor the separation function of a membrane or to ‘integrate’ them with other processes.
23
Chapter 2
Literature Review
The most important character of a successful (i.e. ‘tailored’) surface functionalization is a synergy between the useful properties of the base membrane and the novel functional polymer (layer). This is best achieved by a functionalization, which essentially preserves the bulk structure of the base membrane. The focus will be on surface selective processes. In general, surface modifications of and with polymers had attracted much attention in last decade [50-55]. Often, two alternative approaches are distinguished. ‘Grafting-to’ is performed by coupling polymers to surfaces, while during ‘grafting-from’ monomers are polymerized using an initiation at the surface. ‘Grafting-to’ methods have the potential advantage that the structure of the polymer to be used for surface modification can be well controlled by synthesis and also characterized in detail. However, the grafting densities on the surface, which may be achieved, are limited, and the coupling reactions typically require special efforts. In contrast, the synthesis of surface-anchored polymers via ‘grafting-from’ is often less controlled with respect to polymer structure, but a very wide variation of grafting densities and chain lengths can be obtained under relatively convenient reaction conditions. The ultimate aim of a membrane surface modification is an improved or entirely novel function of an already established membrane. In order to achieve that, a large variety of alternative methods exists, and often only a two- or multi stage methodology will provide an optimum solution. Chemical reactions on the surface of the membrane material could be classified as follows: (a) Derivatization of or grafting onto the membrane polymer via reaction of intrinsic functional groups without material degradation (no polymer chain scission or change of bulk morphology). (b) Controlled degradation of the membrane material for the activation of derivatization or grafting reactions (at minimized polymer chain scission or change of bulk morphology). For reactions according to (a), common biopolymers such as membrane polymers based on cellulose offer many possibilities [11,56-58] and those had also been used extensively for the surface functionalization of membranes [11-12]. However, most of the other established membrane polymers are chemically rather stable, and, therefore, controlled heterogenous functionalizations are complicated or even impossible. Reactions according
24
Chapter 2
Literature Review
to (a) may be based on end groups of the membrane polymer (e.g. amino or carboxylic groups in polyamides or hydroxyl groups in polysulfone). Considering the low surface concentrations of such groups, this method would only be efficient in combination with the synthesis or attachment of macromolecular layers [12].
For reaction-controlled modifications, a penetration into the base materials will be facilitated by either the intended chemical reaction itself or by an influence of reaction conditions (temperature, solvent) onto the base polymer [56]. Therefore, a ‘decoupling’ of activation is the preferred approach towards truly interface selective modifications if it occurs via (b) controlled degradation, and the actual functionalization reaction not influences the base material.
Physical activation of chemical reactions, especially via controlled degradation of polymers [59], is possible by:
• high energy radiation, e.g. γ- or electron beam. • plasma. • UV irradiation. The excitation with high energy irradiation has a low selectivity, and bond scissions in the volume of a membrane material cannot be avoided. Various technically relevant membrane modifications, especially the preparation of ion exchange membranes via graft copolymerization are initiated using electron beam [60].
The excitation with plasma is very surface selective [61]. However, the ablation tendency of the base polymer may be significant [62]. Also, the contribution of the high-energy deep-UV radiation during a direct plasma exposition may lead to uncontrolled degradation processes. Typically, the treatment of the materials must be performed in vacuum. Modifications in small pores (diameter99%), benzophenone (BP) (99%), disodium hydrogen phosphate (>99%), ammonium sulphate (>99%), lysozyme (Lys) (crystalline powder, 75,579 U/mg) natrium acetate and acetone (99.5%), cytochrome c ≥95% (GE) were obtained from Fluka. Acrylamide (AAm) (>99%), and methylene bisacrylamide (MBAA) (>99%) were purchased from Aldrich. The HEPES buffer was from Sigma-Aldrich. Bovine IgG from Sigma. Heptane (>99%), methanol (>95%) and sodium chloride (NaCl) (>99%) were obtained from Applichem. Acid hydrochloric (HCl) and Natrium hydroxide (NaOH) were from Waldeck. Bovine serum albumin (BSA), Fraction V was from ICN Biomedicals, Inc.
3.2
Membrane
functionalization
via
surface-initiated
photo-graft
copolymerization The weight of a membrane sample with a diameter of 25 mm was measured prior to the experiments (balance GENIUS, Sartorius, Germany; sensitivity 10 µg). Thereafter, it was soaked in 2 mL solution of 0.01 wt%, 0.1 wt% (for variation in entrapping time, monomer concentration and UV grafting time) or 1 wt% BP in heptane for 1 hour (for variation in entrapping time, the time vary 15, 30 ,45 and 60 minutes) or in pure heptane (for extraction, i.e. 0 wt% BP). Next, the sample was taken out and dried on air for 10 minutes. For determination of photo-initiator loading, it was wetted in methanol for 5 minutes, then dried in air for 10 minutes before finally measuring its weight. For membrane adsorber preparation, the sample was taken from the methanol and directly immersed for 30 minutes in the monomer solution (see Table 3.1). Next, the membrane was irradiated by using a high intensity UV lamp (UV-A Print, Hoenle AG, Gräfelfing, Germany) with glass filter (λ>300 nm) for 15 minutes (UV intensities, measured with the UVA meter from Hoenle were between 35 and 40 mW/cm2 during course of this study).
41
Chapter 3
Material and methods
Thereafter, it was washed intensively with water for 30 minutes at room temperature, then with water at 60°C for 1 hour and with water at room temperature for 30 minutes. Thereafter, the sample was immersed in methanol for 15 minutes before it was dried in an oven for 24 hours at 45°C. The membranes were protected with tissue paper and pressed between glasses during the drying process. Then, the membrane weight was measured, and the degree of functionalization (DG) was calculated using the weight of the original membrane sample and the specific weight of the material (normalized to the outer membrane surface). The number of independent samples (n) of one membrane type for the different evaluations is given along with the different experimental data including the standard deviations (for n > 3). In all other cases, the data are average values from two independent experiments. Degree of grafting (DG) in this experiment was gravimetrically determined as the modified membrane weight increase per initial membrane weight times membrane specific weight as shown in Equation 3.1 below [87]:
DG = ((mgr-mo)/mo) x msp,A
Equation 3.1
mo = Membrane initial weight mgr = Modified membrane weight (after modification) msp,A = Specific weight (per outer surface area) of the initial membrane.
42
Chapter 3
Material and methods
Table 3.1: Monomer mixtures (in pure water as a solvent) for preparation of PP-based membrane adsorbers with varied grafted functional polymer layer structure (see Section 4.2, Figure 4.7).
Membrane adsorber
AA-5 AA-10 AA-15 (AA±) AA-20
AAAAm7525 AAAAm5050 (AAAAm±) AAAAm2575
Monomer type/ratio
functional 100:0 100:0 100:0 100:0 functional vs. „diluent“ 75:25 50:50
Total monomer concentration (g/L)
Individual monomer concentrations (g/L) AA
AAm
MBAA
5 10 15 20
5 10 15 20
-
-
17.5
13
4.375
-
20
10
10
-
25:75 25 6.25 18.75 „diluent“ AAm 0:100 30 30 functional vs. „cross-linker“ 95:5 15.75 15 0.75 AALMBAA± ± 91:9 13.75 12.5 1.25 AAHMBAA ± These abbreviations are used for the membranes selected for the final evaluation of membrane adsorber performance.
3.3
Membrane permeability
An Amicon cell 8010 (Millipore) connected to a reservoir and pressurized with nitrogen was used for all permeability measurements. For evaluation of pH dependence, water adjusted to pH 2 or pH 10, by adding HCl or NaOH solutions, respectively, was used. For evaluation of salt concentration dependence, a 10 mM HEPES buffer, containing sodium chloride at different concentrations (0, 10, 50, 100, 250, 500, 1000 mM) was used. Each permeability value for one membrane sample was obtained from an average of 5 data which was taken by collecting the filtrate for 30 second and determining its mass gravimetrically.
43
Chapter 3
Material and methods
3.3.1 Background of polyelectrolyte grafted membranes permeability
An important indicator of a membrane functionality is its hydraulic transmembrane flux (permeability). Usually it is expressed as a volume flow of liquid through a unit area of membrane at some defined transmembrane pressure [122]. It is measured in units of velocity per unit of pressure. The formula is shown in the Equation 3.2 below:
P = V/(t x A x p)
Equation 3.2
V = Volume of water (L) t = Time (h) A = Area of membrane (m2) p = Pressure (bar)
3.4
Visualisation/Imaging
The morphology of membrane was observed by using scanning electron microscopy (SEM). An environmental scanning electron microscope (ESEM) Quanta 400 FEG (FEI, USA) was used. A sputter coater k 550 (Emitech, UK) was used for coating of the outer surface of the scan sample with gold/palladium.
3.5
Permporometry: Pore size distribution of the membrane
Transmembrane pore size distribution was determined by liquid displacement [123] using the Capillary Flow Porometer CFP-34RTG8A-X-6-L4 (PMI Inc., Ithaca, NY, USA). Membrane samples with a diameter of 25 mm were characterized via the ‘‘dry up–wet up’’ method. For the ‘‘wet up’’ part, the membranes were wetted with 1,1,2,3,3,3hexafluoropropene (‘‘Galwick’’, PMI, having a surface tension of 16 dyn cm-1). The pore size distribution was then deduced from the comparison of the two experiments by using the PMI software.
44
Chapter 3
Material and methods
3.5.1 Background of permporometry
Permporometry has been frequently used for the structural characterization of membranes. It allows the detection of nano-size membrane pores but best for macro-size membrane pores and can check the quality of synthesized/modified membranes. Materials routinely tested by permporometry (membranes, filters, fibers, textiles, etc.) have very low thickness, always under one milimeter and usually about tens or hundreds of microns. More detailed information can be found in O. Šolcová et al. [123].
The basic idea of permporometry is the controlled expulsion of a suitable liquid from pores of different sizes by increasing the gas pressure difference across the tested porous solid. The gas flow rate through liquid-free pores then corresponds to the amount of pores with different sizes.
The advantages of permporometry are it is a non-destructive test, which offers reliable measurements of the pore-volume distribution [124]. In addition to that, this method is also simple, reliable and reproducible.
3.6
FTIR-ATR
The membrane surface chemistry was analyzed by Fourier transform infrared spectroscopy attenuated total reflection (FTIR-ATR) using a Bruker Equinox 55 instrument (Bruker Optics Inc., Billerica, MA) equipped with a liquid nitrogen detector. A total of 64 scans were performed at resolution of 4 cm-1 using a diamond crystal; the temperature was 21±1ºC. A program written for the Opus software from Bruker was used to record the different spectra versus the corresponding background spectra.
45
Chapter 3 3.7
Material and methods
Membrane adsorber evaluation in chromatography
The liquid chromatograph ÄKTApurifier (GE Amersham Pharmacia Biotech) was used for the experiments described below. Three membrane samples with a diameter of 12 mm were used as a stack (thickness ~450 µm, volume 51 µL) in a CIM® module (BIA Separations, Ljubljana, Slovenia). UV Detection wavelength was 280 nm. In addition, the system pressure as well as the conductivity and the pH value of the eluent were recorded. Lysozyme (Mw ~14 kg/mol; pI ~ 11) had been selected to evaluate the binding capacity of the weak cation-exchange layers in the porous PP membranes. 3.7.1 Reversible protein binding capacity and protein separation. Buffer A (10 mM HEPES, pH 7.0) was used for membrane equilibration, protein binding and subsequent washing, while buffer B (10 mM HEPES, pH 7.0 + 1 M NaCl) was used for elution. A relatively low flow rate of 0.5 mL/min was selected in order to evaluate all the various membranes under the same conditions. The program for one run is shown in Table 3.2. A blank gradient was always run as the first step, and then two subsequent injections of 1 mL solution of lysozyme (5 mg/mL in buffer A) were followed.The Calibrations were done by injection of lysozyme solutions of different concentration in buffer A using the CIM® module without membrane stack. Similar buffer, method and procedure is done for cytochrome c, while for BSA and IgG different buffer was used (buffer A (20 mM Acetate, pH 5.0) buffer B (20 mM Acetate, pH 5.0 + 1 M NaCl)) but method and procedure remain the same.Protein separation was done by using lysozyme and cytochrome c mixture. The mixture concentration of lysozyme and cytochrome c is 2 mg/mL (1:1 ratio).
46
Chapter 3
Material and methods
Table 3.2: Chromatography program for reversible protein binding capacity and protein separation.
Period time
Program
(min) 0-3
Flow 1.0 mL/min of buffer A
3-4
Flow 0.5 mL/min of buffer A
4
Sample injection
4-12
Flow 0.5 mL/min of buffer A
12-16
Flow 0.5 mL/min linear gradient of buffer B
16-19
Flow 1.0 mL/min of buffer A
19
End
3.7.1.1 Background about the dynamic capacity of membrane adsorber
The evaluation of functionalized microfiltration membranes in the flow-through adsorber mode is a convenient method to obtained detailed information about the functionality of the grafted layers. In both aspects, the influence of slow diffusion processes in the porous material can be reduced or even eliminated because of the pore structure of the membrane [9,13,116].The evaluation of functionalized microfiltration membrane could be done via dynamic capacity of membrane adsorber.
The dynamic capacity of membrane adsorber can be obtained through injection at high and low volume of protein solution at the same/different concentration during chromatography process. From high volume, the information could be extract from 10% initial point of breakthrough curve or total integration of breakthrough curve. While for low volume, the breakthrough curve and elution curve would be evaluated. In this process two important step should be carefully observed (cf. Section 2.6.2);
(1) Breakthrough or adsorption step and (2) Elution or desorption step.
47
Chapter 3
Material and methods
Binding was done at low salt concentrations and elution was achieved by increasing the salt concentration; a typical chromatogram in injection of protein solution at low volume shown in Figure 3.1.
2500
U V - 280 nm (A U )
2000
Breakthrough
Detector salt
1500
Elution
1000
Injection 500 0 -1
0
1
2
3
4
5
6
7
8
9
-500 Volume, v (ml)
Figure 3.1: Typical chromatogram for the evaluation of reversible protein binding to photo-functionalized PP membrane adsorbers [21].
3.7.1.2 Protein separation using chromatography techniques
Few methods of chemical analysis are truly specific to a particular analyte. It is often found that the analyte of interest must be separated from the myriad of individual compounds that may be present in a sample. As well as providing the analytical scientist with methods of separation, chromatographic techniques can also provide methods of analysis. More detailed information can be found in [125-126].
Ion exchange chromatography involves a sample (protein) being dissolved in a mobile phase (buffer). The mobile phase is then forced through an immobile, immiscible stationary phase for equilibrium. After equilibrium, the mobile phase with sample was introduced for binding process. Once this binding process completed, mobile phase with high concentration of salt was introduced for elution purpose. A component which is quite soluble in the stationary phase will take longer to travel through it than a component which is not very soluble in the stationary phase but very soluble in the mobile phase. As 48
Chapter 3
Material and methods
a result of these differences in mobilities, sample components will become separated from each other as they travel through the stationary phase. The phases are chosen such that components of the sample have differing attraction in each phase. Different stationary phase’s structure, mobile phase composition and sample properties will influence the separation process.
Techniques such as membrane chromatography use CIM module - tubes holder packed with membrane adsorber with different brush structure as stationary phase, through which the mobile phase is forced. The sample is transported through the module by continuous addition of mobile phase. This process is called binding or breakthrough. After the binding was completed, mobile phase with high salt concentration was introduced (gradient). This process called desorption or elution. The average rate at which an analyte moves through the module is determined by the time it spends after gradient was introduced in the mobile phase.
3.7.1.2.1 Distribution of analytes between phases
The distribution of analytes between phases can often be described quite simply. An analyte is in equilibrium between the two phases as shown in Equation 3.3.
Amobile
Astationary
Equation 3.3
The equilibrium constant, K, is termed the partition coefficient; defined as the molar concentration of analyte in the stationary phase divided by the molar concentration of the analyte in the mobile phase.
The time between sample injection, gradient introduction and an analyte peak reaching a detector at the end of the module is termed the retention time (tr) (Figure 3.2). Each analyte in a sample will have a different retention time. The time taken before gradient being introduced is called to.
49
Chapter 3
Material and methods
Figure 3.2: Quantitative attempt to interprate chromatography evaluation.
tra is retention time for analyte A, trb is retention time for analyte B,Wa is width of analyte A curve and Wb is width of analyte B curve. A term called the retention factor, k', is often used to describe the migration rate of an analyte on a module. Sometimes retention factor also called the capacity factor. The retention factor for analyte A is defined in Equation 3.4.
k'a = (tra – to)/ to
Equation 3.4
tr and to are easily obtained from a chromatogram. When an analytes retention factor is less than one, elution is so fast that accurate determination of the retention time is very difficult. High retention factors (greater than 20) mean that elution takes a very long time. Ideally, the retention factor for an analyte is between one and five.
We define a quantity called the selectivity factor, α , which describes the separation of two species (A and B) on the column in Equation 3.5.
α = k 'a / k 'b
Equation 3.5
When calculating the selectivity factor, species A elutes faster than species B. The selectivity factor is always greater than one.
50
Chapter 3
Material and methods
3.7.1.2.2 Resolution
Although the selectivity factor, α, describes the separation of band centres, it does not take into account peak widths. Another measure of how well species have been separated is provided by measurement of the resolution. The resolution of two species, A and B, is defined in Equation 3.6.
R= 2 x (trb-tra)/(Wa+Wb)
Equation 3.6
Baseline resolution is achieved when R = 1.5. It is often found that by controlling the capacity factor, k', separations can be greatly improved. This can be achieved by changing composition of the mobile phase (salt concentration). The selectivity factor, α, can also be manipulated to improve separations. When α is close to unity, optimising k' is not sufficient to give good separation in a reasonable time. In these cases, k' is optimised first, and then α is increased by one of the following procedures;
(1) Changing mobile phase composition. (2) Changing column temperature. (3) Changing composition of stationary phase. (4) Using special chemical effects (such as incorporating a species which complexes with one of the solutes into the stationary phase).
3.7.2 Inadvertent pH transient The method proposed by Strancar and coworkers [127-128] for porous monoliths was adapted to porous membrane adsorbers. Ammonium sulphate buffer in two different concentrations (0.5 M as buffer A and 20 mM as buffer B; both having pH ~5.3) was used for pH transient measurements. The membrane stack was first equilibrated with buffer A at a flow rate of 1 mL/min until pressure, UV absorbance, conductivity and pH were stable. Then the composition of mobile phase was instantaneously switched to buffer B. The experiment was ended when the pH of the effluent had reached a constant value, identical to the pH of the solution at the column inlet. Depending on the membrane type the experiments lasted up to 3 hours.
51
Chapter 3
Material and methods
3.7.2.1 Background about Inadvertent pH transient
For the separation of macromolecules, mobile phase gradients (ionic strength or pH) are routinely used for elution from an ion exchanger. If a non-adsorbed buffering species is used for that purpose, changes in ionic strength or pH propagate throughout the column with the velocity of a nonadsorbed solute. On the other hand, ionic strength and pH gradients can be retained by a column if an adsorbed buffering species is present or if an adsorbent with a buffering capacity is used [129]. The time at which the pH front exits in the column is proportional to size under the curve of the buffering species [130-131].The size under the curve of the buffering species implicitly involves the total amount of the ionic groups present on the matrix.
Recent experiments showed that such a pH front can be achieved by a stepwise change of a high concentration buffer solution to a low one having the same pH value [128]. Similar observations were reported by P´erez and Frey [132].Based on this finding, Podgornik et al. successfully developed inadvertent ph transient method [127]. It is fast, simple, nondestructive and non-toxic method for determining the amount of ion-exchange groups on adsorber materials by measuring a pH transient formed using a concentration step change of adsorbing buffering species.
The method can be used for anion as well as for cation exchangers. Due to its noninvasively is especially convenient for determining the amount of the ionic groups on many adsorber materials. The founder of this technique applied it on beads and monoliths; determination of membrane adsorber capacity based on this technique for the first time was done in this experiment. The method causes no contamination because of that it can serve as a quality control method for produced adsorber materials as well as for monitoring the chromatographic properties of adsober materials during their use. Furthermore, since it allows characterization and traceability of adsorber materials properties, this method can form the basis for a cGMP test, which is required by the pharmaceutical industry.
52
Chapter 3
Material and methods
3.7.3 System Dispersion
Breakthrough curves for the acetone/protein were measured under binding conditions for membrane stacks after complete equilibration (buffer A: 10 mM HEPES, pH 7.0 or 20mM Acetate, pH 5.0 (for variation of protein size)). Fresh membrane stacks were always used in the experiments discussed in this work. The flow rate 0.5, 1.0, 1.5, 2.0, 2.5 and 3.0 mL/min were used for variation of flow rate experiment. For other variation (concentration, protein size) flow rate 1.0 mL/min was used. 10 mL solution of acetone (5% v/v in buffer A HEPES) and 10 mL solution of Lysozyme (5mg/mL in buffer A HEPES) was injected in variation of flow rate experiment.10 mL solution of Lysozym (3,5,10 mg/mL in buffer A HEPES) or Lysozym, BSA and IgG (5 mg/mL in buffer A Acetate) was injected for variation of concentration and protein size experiment. The data were recorded until the UV absorbance started to decline again. The data were converted into cumulative residence time distribution function (F(t)) curves by normalizing the UV absorbance to the maximum value, corresponding to a respective eluent concentration. 3.7.3.1 Background about system dispersion and their analyses
Reduction in separation performance can result from liquid mixing in the pump, tubing, fitting, membrane holder, layered stack and detector system. The study of system dispersion in membrane stacks could be done via breakthrough curve (BTC) and residence time distribution (RTD) investigation. More detailed information can be found in reference [24].
3.7.3.1.1 The breakthrough curve (BTC)
The breakthrough curve (BTC) is a plot of effluent concentration vs time or effluent volume. Ideally the BTC is sharp, meaning no solute comes out in the effluent solution until the membrane reaches saturation, at which point the effluent solution is the same concentration as the feed solution. The extent to which this is not the case is a measure of the impact of slow adsorption kinetics, slow mass transfer, and mixing in the flow system. More detailed information can be found in reference [133].
53
Chapter 3
Material and methods
3.7.3.1.2 Retention Time Distribution (RTD)
The residence-time distribution (RTD) of a reactor is a characteristic of the mixing that occurs in a chemical reactor [31-32]. There is no axial mixing in a plug-flow reactor, and this is reflected in the RTD which is exhibited by this class of reactors. The continuous stirred-tank reactor CSTR is thoroughly mixed and possess a far different kind of RTD than the plug-flow reactor (PFR).
The RTD is determined experimentally by injecting an inert chemical or atom, called a tracer, into the reactor at some time t = 0 and then measuring the tracer concentration, C, in the effluent stream as a function of time. The tracer should be a non-reactive species that easily detectable and have a physical properties similar to those of the reacting mixture, or be completely soluble in the mixture. It also should not adsorb on the walls or other surfaces in the reactor. The latter requirements are needed so that the tracer’s behaviour will honestly reflect that of the material flowing through reactor. Two most common methods of injection are pulse input and step input.
Advantages of using pulse input include:
(1) Requiring only small amount of tracer (relatively small cost or hazardous conditions, if these are factors). (2) Involving usually only a small impact on process operation (tracer study does not require shutdown).
Disadvantages include:
(1) Difficulty in achieving a perfect pulse (may complicate interpretation in relating response to input). (2) Difficulty in achieving accurate material balance on tracer (frequent sampling may be required particularly to capture a “peak” concentration).
54
Chapter 3
Material and methods
In comparison with a pulse input, the step input has the following advantages:
(1) A step change is usually easier to achieve. (2) A material balance is usually easier to achieve.
The disadvantages are:
(1) Continous delivery requires a greater amount of tracer (relatively large cost and hazard impact, if these are factors). (2) It may have a significant impact on process operation, forcing a shutdown. (3) It involves differentiation of the data, if not careful could lead to large errors [31].
This experiment use step input due to the present of high amount of tracer, the evaluation are done base on RTD analysis from step input in non-ideal reactor using backward differencing method according to R.W. Missen [32].
55
Chapter 4: Results and discussions 4.1 Membrane adsorber preparation: Investigation of effects of photo-grafting conditions
Surface functionalization via photo-grafting using photo-initiator entrapping is a new method to prepare membrane adsorber [21]. This method is simple, potentially economic and versatile. The advantage of this method compared with other techniques is the ability to control precisely the formation of chains in the membrane pores. This character is very important to control the structure of grafted layer in order to obtain well defined brush structure. Membrane adsorber performance can be optimized based on design of brush structure.
Surface functionalization via photo-grafting using photo-initiator entrapping method is based on pre-swelling the porous polymer membrane in solvent, followed with subsequent solvent exchange to allow photo-initiator entrap in the surface layer of the porous polymer membrane. Several monomers with desired characteristics were chosen and together with porous polymer membrane entrapped with photo-initiator exposed to UV irradiation. Finally, polymer brushes with desired characteristic and structures were obtained on the entire membrane pore surface.
In order to fully utilize this method for membrane adsorber preparation, it is necessary to investigate several important parameters involved in this method. The study would focus on the effects of photo-grafting conditions such as variation of entrapping time, functional monomer concentration, UV grafting time and photo-initiator loading in pregrafting period.
In general, the surface functionalization process includes two steps, i.e., immobilization of the photo-initiator BP and UV-initiated “grafting-from” of acrylate monomers. Both steps are important and have influence on grafting density and grafted layer thickness. The impact of conditions was studied using the homopolymerization of the functional monomer acrylic acid (AA) in order to identify most promising conditions of variations of grafted layer by composition of monomer.
56
Chapter 4
Results and discussions
4.1.1 Variation of entrapping time
The photo-initiator entrapping method involves swelling of the PP in heptane (at relatively short time so that the equilibrium degree of swelling in the range of 10% is not reached [134-135]) in order to allow uptake of BP in the layer close to the pore surface. Variation of entrapping time from 15 to 60 minutes was done in order to observe how it can influence the degree of grafting (DG) and protein binding capacity of membrane adsorber. The concentration of photo-initiator used in this work is 0.1 wt%. The DG obtained is within the range ~300 - ~400 µg/cm² (average: 368 ± 44 µg/cm²) and the average of protein binding capacity is 61 ± 4 mg/mL (Figure 4.1). As the DG was increased, the protein capacity will also increase and vice versa. The highest DG is reached when entrapping time is 60 minutes while the highest protein binding capacity was reached when entrapping time is 30 minutes. Overall, DG and protein binding capacity is slightly varied throughout entrapping time investigated.
Degree of grafting (µg/cm²)
400
60
350 50
300
Grafting
250
Protein
40
200
30
150
20
100 10
50 0
Protein binding capacity (mg/ml)
70
450
0 0
15
30
45
60
75
Entrapping time (min)
Figure 4.1: Influence of entrapping time onto grafting on PP pore surface and protein binding capacity, measured for lysozyme (0.1 wt % BP; 15 g/L AA, 15 min UV time).
The swelling time will influence amount of photo-initiator entering the membrane pore and consequently will influence the reaction. However, the range of time used in this experiment is not long enough to test the validity of this hypothesis although it is relevant to avoid excess swelling of PP membrane that could possibly alter the membrane
57
Chapter 4
Results and discussions
morphology permanently. Further work that relates the amount of entrapped photoinitiator and degree of grafting and performance of membrane adsorber is discussed in section 4.1.4.
4.1.2 Variation of functional monomer concentration
The effects of variation of functional monomer AA concentration at constant UV time on degree of grafting and binding capacity for the model protein lysozyme are shown in Figure 4.2. Linear increases of the degree of grafting and protein capacity were observed with the increase of monomer concentration.
70
Grafting
Degree of grafting (µg/cm²)
Protein
60
500
50
400
40 300 30 200
20
100
10
0
Protein binding capacity (mg/ml)
600
0 0
5
10
15
20
25
Monomer concentration (g/L)
Figure 4.2: Influence of AA concentration onto grafting on PP pore surface and protein binding capacity, measured for lysozyme (60 min entrap time, 0.1 wt% BP, 15 min UV time).
The increase of degree of grafting as the monomer concentration was increased is due to an increase of chain growth rate [60]. The increase of protein binding is due to the presence of more binding sites as a result of longer chains.
58
Chapter 4
Results and discussions
However, the linear trends for protein binding as function of AA concentration were significantly different than those for the DG values, because the protein capacities were between 41 and 63 mg/mL for DG values between ~100 and ~500 µg/cm2.This means that with increasing mass of grafted polymer on the pore surface, the efficiency for protein binding to the polymer decreases (from 17.5 g/g to 5.6 g/g). This indicates that a decreasing fraction of functional groups is available for protein binding (under dynamic conditions as done in this study). That a DG value of ~500 µg/cm2 had been achieved at higher monomer concentration indicates that limitation in monomer or by surface coverage is not critical. The influence of restricting the pore space by grafting is also relevant to some extent in the present study (see section 4.1.3). However, consumption of surface-bound initiator seemed to be the main factor.
4.1.3 Variation of UV grafting time
“Grafting-from” of AA at a moderate concentration was chosen to investigate the effects of variation of UV grafting time in more detail. The effects of variation of UV grafting time at constant AA concentration onto degree of grafting and binding capacity for the model protein lysozyme are shown in Figure 4.3. At the beginning, the DG values and protein binding were increased almost linearly as the time increase but then tended to reach a plateau in the range of 350 µg/cm2 and 60 mg/mL respectively.
59
Results and discussions
400
70
350
60
300
50
250 40
Grafting
200
Protein
30 150 20
100
10
50 0
Protein binding capacity (mg/mL)
Degree of grafting (µg/cm²)
Chapter 4
0 0
2
4
6
8
10
12
14
16
18
20
Grafting time (min)
Figure 4.3: Influence of UV irradiation time onto grafting on PP pore surface and protein binding capacity, measured for lysozyme (60 min entrap time, 0.1 wt % BP; 15 g/L AA).
Longer UV irradiation time results in higher irradiation doses leading to increase in number of starter radicals on the surface. However, for longer reaction times, the consumption of initiator, of monomer or an increasing coverage of the polymer surface can lead to a decrease of grafting rate. In addition, for porous materials such a limitation of grafting reaction could also be caused by filling the pores.
For the variation of UV time, the trends for DG and protein capacity were similar (increase at the beginning and level off at the end). The efficiency of protein binding to the polymer is slightly decreasing at the beginning before levelling off (from 11 g/g to 8 g/g). The reduction of protein binding efficiency on grafted polymer is more obvious during functional monomer concentration variation compared with UV time variation (cf. section 4.1.2). This indicates that decreasing fraction of functional groups for protein binding during reaction controlled by chain growth rate (monomer concentration) is more obvious than controlled by higher irradiation doses (UV irradiation time). Balance between these two effects is necessary in order to obtain membrane adsorber with desired fraction of functional group for protein binding.
60
Chapter 4
Results and discussions
4.1.4 Loading in pre-grafting period and variation of photo-initiator concentration
Sufficient amount of photo-initiator is critical parameter for optimizing photo-grafting process. Loading photo-initiator in PP membrane required the use of solvent that swells PP membrane prior to load process. In doing so, some extraction could possibly occur, and this section will investigate this matter. First, the extraction of impurities from the membrane with pure heptane has been considered: an average weight loss of 16 ± 3 µg/cm² (n = 6) was recorded in this experiment. The BP loading for three different concentrations in heptane corrected by this weight loss of the PP membrane in pure heptane is shown in Figure 4.4.
Increase of mass per membrane area (µg/cm²)
30 25 20 15 10 5 0 0
0.2
0.4
0.6
0.8
1
1.2
-5 Photo initiator concentration (wt% )
Figure 4.4: Loading of photo-initiator BP by entrapping in porous PP membrane (60 min entrap time). For 1 wt% BP in the solution, the loading of the PP membranes was ~25 µg/cm2, while for 0.1 wt% BP only 3 µg/cm2 have been achieved. The uptake at 0.01 wt% BP was not measurable. The data for the highest BP concentration correspond to a photo-initiator loading of 2.2 x 10⁻⁴ µmol/cm2 relative to the specific surface area of this membrane (~25 m2/g [116]), i.e., an average density of 1.3 BP molecules per nm2. The information
61
Chapter 4
Results and discussions
regarding loading capacity of photo-initiator is important in order to estimate how much and what kind of chain structure could be produced during initiation.
The effects of photo-initiator concentration variation on degree of grafting at constant entrapping time, UV grafting time and AA concentration are shown in Figure 4.5. The result was a sharp increase of degree of grafting when the photo-initiator concentration during entrapping immobilization was increased from 0.01 wt% BP to 0.1 wt% BP, but no further DG increase was observed beyond that concentration. Hence, in terms of photo initiation efficiency (grafted polymer relative to initiator amount), an optimum seems to have been reached around BP loading concentration of 0.1 wt%.
500
Degree of grafting (µg/cm²)
450 400 350 300 250 n=6 200 150 100 50 0 0
0.2
0.4
0.6
0.8
1
1.2
Photo initiator concentration (wt% )
Figure 4.5: Influence of photo-initiator loading, adjusted by BP concentration in solution onto grafting on PP pore surface (60 min entrap time, 15 g/L AA; 15 min UV time).
One of the effects of increasing initiator concentration on the surface is an increase of initiation rate, but when a critical initiator concentration was reached, no further increase of monomer conversion can be achieved due to diffusion limitations for the monomer [136]. Nevertheless, for two functionalized porous PP membranes of about the same DG (i.e., also same mass of polymer per specific surface area), a grafted layer with higher
62
Chapter 4
Results and discussions
density and hence lower average thickness would be expected for preparations at higher BP loading. The effect onto protein binding capacity is shown in Table 4.1.
Table 4.1: Comparison of PP-based membrane adsorbers, prepared using 15 g/L AA and 15 min UV time with different photo-initiator concentration for pre-coating.‡
BP concentration used for entrapping
0.1 wt%
1 wt%
DG (µg/cm²)
340 ± 52
320 ± 32
Lysozyme binding capacity (mg/mL)
52 ± 7
56 ± 5
Number of independent samples, n
6
6
‡
The lower DG values (by ~10%) as compared to the series shown in Figure 4.5 can be explained by a lower UV intensity (also by ~10%) during preparation of the samples.
The results show that both degree of grafting and protein capacity for differently prepared membranes were approximately the same. When comparing the trends of the average values, the lower DG value of the membrane prepared using 1 wt% BP (-6%) was correlated with higher protein capacity (+8%) compared to the membrane prepared using 0.1 wt% BP. The permeability of both membranes is summarized in Figure 4.6.
63
Chapter 4
Results and discussions
16000
Water permeability (L/h.m².bar)
14000 12000
1wt% BP 0.1wt% BP . . .
10000 8000 6000 4000 2000 0 pH2
pH10
Figure 4.6: Water permeabilities at two different pH values of PP-based membrane adsorbers, prepared using 15 g/L AA and 15 min UV time with different photo-initiator concentration for pre-coating.
The water permeability of the unmodified PP membrane does not depend on pH. Hence, the permeability of the functionalized membranes and their response to solution conditions are controlled by the grafted layer. The grafted copolymer has weak cationexchange properties due to electrostatic effects, i.e., it will stretch at high pH when the carboxylic groups are charged (deprotonated), and it will collapse at low pH when the chains are in the neutral form (protonated) [87] (cf. Section 2.6.1.1). Compared to the water permeability of the unmodified PP base membrane (~15.000 Lm-2h-1bar-1), the data at pH 2 were only reduced by up to 20%, while the values were about one order of magnitude lower at pH 10.
A clear difference can be seen between the two membrane adsorbers. The membrane prepared using 1 wt% BP had significantly higher permeability at high and low pH compared to the membrane modified with 0.1 wt % BP. The small permeability difference at low pH (14%) suggests that both grafted layers have similar thickness in the
64
Chapter 4
Results and discussions
collapsed state. However, the very large permeability difference at high pH (160%) suggests that the grafted layer in the membrane pores functionalized using 0.1 wt% BP have a much larger hydrodynamic thickness in the swollen and stretched conformation than the layers prepared using 1 wt% BP. Because both membranes have about the same mass of polymer per specific surface area, this data supports strongly the hypothesis that higher BP loading leads to higher grafting density. No direct experimental data on grafting density are available.
When assuming that each immobilized BP molecule would initiate one grafted chain, the maximum density would be 1.3 chains / nm2. Such a high efficiency for heterogeneous photo-initiation is not probable; but even at only 5% of this grafting density, the chains would still be in the “brush” regime [55]. Further, when relating the bound amounts of protein to the specific surface of the membrane (780 ng/cm2 for 56 mg/mL), multi-layer protein binding in the three-dimensional grafted functional layer is confirmed [20, 23] (20 layers of lysozyme) with the assumption of one molecule lysozyme represent monolayer (Lysozyme MW: 14 kDa, dimension: 4.5 nm x 3.0 nm x 3.0 nm [137]). Overall, for the membranes grafted with linear AA homopolymer, the only difference with respect to adsorber performance as a function of photo-initiator loading was the lower permeability for the membranes in their charged state, i.e., the conditions for protein binding, but the bound amounts were almost the same (Table 4.1). Therefore, further preparations were focussed on using high photo-initiator loading.
4.2 Variation of grafted layer structure by ‘grafting-from’ copolymerization
Preparations of membrane adsorber were continued with variation of grafted structure. The aim of this variation is to enable a systematic comparison of membrane adsorber performance (Figure 4.7).
65
Chapter 4
Results and discussions
Figure 4.7: Variation of three-dimensional weak cation exchanger layers on the PP pore surface.
4.2.1 Degree of grafting
Variations of grafted layer structure were done by addition of either cross-linker (MBAA) or diluent monomer (AAm) into functional monomer (AA) solution. The degree of grafting is shown in Table 4.2.
66
Chapter 4
Results and discussions
Table 4.2: Degree of grafting (DG) of modified polypropylene membranes grafted with mixture of monomer functional-cross-linker or diluent (60 min. entrap time, 1 wt% BP, 15 min. UV time).
Type of modified membrane
DG (µg/cm²)
Variation coefficient (%)
AA-15 (AA)
339 + 24a
7
AALMBAA
389 +26 a
7
AAHMBAA
436 +18 a
4
AAAAm7525
435 +94 a ,b
22
AAAAm5050 (AAAAm)
414 +113 a ,b
27
AAAAm2575
376 +35 a
9
AAm
520 +63 a
12
a
standard deviation
b
large standard deviation for modification contains mixture between functional-diluent
monomer due to uncontrollable variation in UV radiation.
The concentrations of functional monomer (AA), cross-linker (MBAA) and diluent monomer (AAm) were varied in different amount (c.f. Table 3.1). As presented in Table 4.2, it is clearly seen that relatively high DG could be obtained (average DG 416 + 58 µg/cm2). This can be achieved by adjusting the total monomer concentrations via taking into account different monomer reactivity [138].
4.2.2 Visualization of pore structure
Visualization of modified membrane morphology was performed using scanning electron microscope (SEM). The SEM images for membrane surface are shown in Figure 4.8. The AAAAm modified membrane has a structure almost identical with the unmodified polypropylene membrane (UPP) (Figure 4.8(c) and 4.8(a)). The AAHMBAA shows slightly different morphology compared with the UPP but the membrane pores were smaller and the amount of open cellular structure was less (Figure 4.8(d) and 4.8(a)). If compared to the UPP, it is clearly seen that the surface of AA modified membrane was
67
Chapter 4
Results and discussions
covered by grafted polymer layer (Figure 4.8(b)). In addition, the amount of pore seemed to be reduced.
(a)
(b
Cross section (c) (d) Figure 4.8: SEM images for membrane surface a) UPP b) AA c) AAAAm d) AAHMBAA.
In addition to surface morphology, the membrane cross-section was also investigated (Figure 4.9). Highly fibrous and thin structure was observed for the UPP (Figure 4.9 (a)). The fibrous layer becomes thicker in the AA (Figure 4.9 (b)). For membrane modified with the AAAAm and AAHMBAA higher thickness of fibrous structure was observed (Figure 4.9 (c) and 4.9 (d) respectively).
68
Chapter 4
(a )
Results and discussions
(b )
(c (d) Figure 4.9: SEM images for membrane cross section a) UPP b) AA c) AAAAm d) AAHMBAA.
Another observation is the brittleness increases after modification. This was discovered during nitrogen treatment for membrane adsober before SEM. There is one procedure before SEM required (for cross-section), i.e., immersion of membrane in liquid nitrogen and followed with fracture the sample with tweezers in order to have natural crosssection fraction. This step is important to increase SEM accuracy. Even after nitrogen treatment the UPP less brittle. An attempt to break this structure using tweezers was failed so scissors has to be used for cross-section cut. In contrast, after nitrogen treatment all modified membranes can be easily broken with tweezers. Most probably the new grafted layer of polyacrylic acid increased the degree of brittleness of modified membranes. Overall, modification changed the membrane morphology but open cellular 69
Chapter 4
Results and discussions
pores were still be observed. More obvious change is observed on membrane crosssection, the highly fibrous structure of unmodified become thicker in modified membranes.
4.2.3 Pore size distribution
Permporometry has been frequently used for the characterization of membrane pores. It allows the detection of both pore size and pore size distribution. The permporometry investigation was conducted for UPP and AALMBAA in order to observe how much pore size change due to modification. The results are presented in Figure 4.10.
14
D istrib u tio n (% )
12 UPP_1
10
UPP_2 8
UPP_3 AALMBAA_1
6
AALMBAA_2 4
AALMBAA_3
2 0 0.2
0.22
0.24
0.26
0.28
0.3
Pore size (um)
Figure 4.10: Charaterization of membrane pore size by permporometry for UPP and AALMBAA modified membrane.
The average main pore size and percentage of distribution for UPP membrane is 0.25 ± 0.02 µm and 10%, while AALMBAA is 0.27 ± 0.01 µm and 6% (Figure 4.10). An extraction of some portion of PP by heptane during entrapping period is most probably the reason for modified membrane has slightly bigger pore size compared with original membrane. Although pore sizes slightly increase and width distribution slightly
70
Chapter 4
Results and discussions
decreases, it is still small. This finding agrees with SEM results, only small change in pore size occurs due to modification, indicating surface modification using UV irradiation is mild method.
4.2.4 FTIR-ATR spectra
The FTIR-ATR spectra of the membranes were recorded to confirm the effect of modification on membrane chemistry. It is observed that grafting of PP with AA and AAm as well as the respective copolymers has been verified (Figure 4.11). In addition, data for composition analysis, based on relative areas of the bands characteristic for carboxyl and amide are also shown (see Figure 4.12). 1655
0.24 AAm
1655
0.19
1710
AAAAm2575 Absorbance (-)
1655 1710
0.14
AAAAm5050 1655
1710
AAAAm7525 0.09 1710
AA 0.04 Unmodified PP -0.011600
1650
1700
1750
1800
-1
Wave number cm
Figure 4.11: The FTIR-ATR spectra for PP membranes grafted from monomer solutions (AA / AAm mixtures) of varied composition. Note: characteristic band of carbonyl for AAm is at 1655 cm-1 while the one for AA is at 1710 cm-1.
71
Chapter 4
Results and discussions
AA content in graft copolymer (%)
100
80
60
40 AA Experiment AA Ideal
20
0 0
25
50
75
100
AA content in AA/AAm mixture (%)
Figure 4.12: Composition from peak area for carboxyl and amide groups from FTIRATR spectra (c.f. Figure 4.11).
As presented in Figure 4.11, the IR spectrum of the PAA shows the characteristic band at 1710 cm-1 which is ascribed to the C=O stretching of carboxylic group. In the spectrum of diluent sample PAAm, peak at 1655 cm-1 appears due to the absorption of free and hydrogen-bonded amide carbonyl group. The IR spectrum that represents AAAAm5050 prepared with equal mass ratio of functional and diluent monomers shows the characteristic bands at 1655 cm-1 and at 1710 cm-1.
The intensity of the signal can also be related to the amount of polymer grafted on the surface. The composition analysis indicates that the reactivity of both monomers were indeed similar under the chosen reaction conditions (Figure 4.12), but significantly higher tendency for incorporation of AAm into the grafted copolymer than according to the stoichiometry of the monomer mixture had been observed. Considering the effect of AAm on the overall grafting rate (a higher concentration was required to achieve the same DG than for AA; c.f. Table 4.2), this effect is somewhat surprising. However, it could be explained by non-ideal copolymerization behaviour, i.e., changing relative reactivity with total monomer concentration.
72
Chapter 4
Results and discussions
4.2.5 Membrane permeability
The hydrodynamic behaviour of the grafted polymer layers at different pH was investigated via water permeability. As a result of reversible deprotonation of carboxyl groups above the pK value (pH ~5), significant changes of the effective layer thickness can also be deduced from those data [87, 139]. All grafted membranes had higher water permeability during filtration at pH 2 than at pH 10, with values slightly less than unmodified
PP
membrane
(15,000 L/hm²bar)
(Figure 4.13).
The
AAHMBAA
membranes had the highest permeability (13,900 L/hm²bar) while the AAAAm membranes showed the lowest values (12,300 L/hm²bar). All functionalized membranes seemed to have only slightly different effective pore size.
50
40
12000
30 8000 20 4000
Ratio pH 2/pH 10
Water permeability (L/h.m 2.bar)
16000
10
0
0 AA
AAAAm
AALMBAA
AAHMBAA
Different type of membrane adsorbers pH2
pH10
pH2/pH10
Figure 4.13: Water permeability at two different pH values of PP-based membrane adsorbers.
The permeability for all grafted membranes reduced significantly during filtration at pH 10. However, AAHMBAA modified membrane still exhibits the highest permeability (5,400 L/h.m².bar), while the AAAAm membranes showed by far the lowest water permeability (300 L/h.m²bar).
73
Chapter 4
Results and discussions
The reversible deprotonation of carboxylic groups forces the polymer brush to stretch due to ionic repulsion and osmotic pressure. Both phenomena lead to a decrease of effective membrane pore opening, as a result a lower permeability is observed at high pH. The reversible protonation of carboxylic groups caused that the polymer brush collapse due to ionic repulsion and osmotic pressure was vanished (cf. Section 2.6.1.1 and Figure 2.11). This leads to increase of effective pore opening; as a result a higher permeability is observed at low pH.
For the membranes grafted with addition of diluent and cross-linker, additional effect should play a role, for AAAAm a “dilution” of carboxyl groups, and for the AALMBAA and AAHMBAA membranes the cross-linking of the grafted chains. The behaviour of the AAAAm membranes will be explained later (in context of data shown in Figure 4.15), while the behaviour of AALMBAA and AAHMBAA will be focused here. The addition of cross-linker causes formation of network structure, hence limits the swelling/stretching of polymer brush. Consequently, a relative higher permeability could be obtained even under high pH. The observation is in agreement with other systems [140]. This effect can be controlled by the content of cross-linker in the monomer mixture.
The same modified membranes were subjected to buffer permeability experiment using 10 mM HEPES buffer at different salt concentration (it is important to inform that this buffer and salt concentration are investigated during protein dynamic binding experiment, see Section 4.2.6 and 4.5). In this experiment, buffer A (no NaCl) was first used and then gradually changed by increasing NaCl concentration into buffer B (1 M NaCl) (Figure 4.14).
74
Chapter 4
Results and discussions
Buffer permeability (L/h.m².bar)
12000 10000 AAHMBAA 8000
AALMBAA AA
6000
AAAAm
4000 n=6
2000 0 0
200
400
600
800
1000
1200
NaCl concentration in HEPES buffer at pH 7 (mM)
Figure 4.14: Buffer permeability at different salt concentrations of PP-based membrane adsorbers.
For all modified membranes, the permeability at pH 7 increase with increasing salt concentration and reaches a constant value between 500 and 1000 mM. This effect can be explained with the screening of the deprotonated carboxylic groups, causing a deswelling of the grafted layer. The absolute permeability and their sensitivity to salt concentration were strongly influenced by the structure of the grafted layer, and these differences correlated quite well with the effects of pH. The effects of pH and salt concentration on permeability were compared in Table 4.3. The lowest fluxes and highest sensitivities were found for the membranes with grafted diluent copolymer layer. Largest fluxes and lowest sensitivities were found for the membranes with grafted cross-linker layer, while the highest performance with respect to these parameters was observed for the larger content of cross-linker.
75
Chapter 4
Results and discussions
Table 4.3: Water and buffer permeability at different pH and salt concentration for different membrane adsorbers (c.f. Figure 4.13 and 4.14).
Membrane
Water permeability
HEPES buffer permeability
(L/h.m².bar)
(10 mM , pH 7) (L/h.m².bar)
pH 2
pH 10
Low salt
High salt
concentration
concentration
(0 mM NaCl)
(1000 mM NaCl)
AA
13200 ± 410
1790 ± 50
2630 ± 1290
8770 ± 740
AAAAm
12320 ± 1230
302 ± 30
1420 ± 970
6960 ± 1790
AALMBAA
12570 ± 220
3970 ± 140
5250 ± 1360
10140 ± 870
AAHMBAA
13950 ± 300
5420 ± 120
6120 ± 600
10400 ± 1050
For all membranes, the permeability at high salt concentration was somewhat smaller than at low pH. This can be attributed to the fact that the deprotonated carboxyl groups had a larger capacity for water binding than the protonated carboxyl groups. The data also illustrate very clearly, that the elution of the protein from modified membrane by increasing the NaCl concentration beyond the critical value (250 mM for the HEPES buffer used in this work [141] is accompanied by a significant “collapse” of these layers which can lead to entrapment of bound protein and delay release or even complete capture (cf. Figure 4.14). Again, this undesired effect should be much less pronounced for the membrane adsorbers with cross-linker grafted layer.
The effects of diluent monomer on membrane permeability are shown on Figure 4.15. Very pronounced effects of copolymer composition onto water permeability and different trends for high and low pH had been observed.
76
Chapter 4
Results and discussions
Water permeability (L/h.m².bar)
100000
10000
1000
100
pH2 pH10
10 0
25 50 75 AA content in AA/AAm mixture (mol% )
100
Figure 4.15: Water permeabilities at two different pH values of PP-based membrane adsorbers functionalized using reaction mixtures of functional (AA) and diluent monomer (AAm).
The effect of diluent monomer on swelling of the grafted polymer layers leading to decrease in average pore size diameter must be considered in following ways: i) the degree of swelling is higher for PAAm than for protonated PAA [142] (Figure 4.15), ii) a strong increase of swelling occurs for PAA upon deprotonation and dilution of carboxylic groups in the copolymer down to ~25% does not reduce this effect [143], iii) crosslinking due to multiple hydrogen bonding between protonated PAA (hydrogen bond donor) and PAAm segments (hydrogen bond acceptor) leads to a reduction of the degree of swelling at low pH (this mechanism is most efficient for the same content of both monomers). The consequence of arguments ii) and iii) is an even larger susceptibility of permeability to pH variation for the grafted PAA/PAAm copolymer than observed for grafted PAA homopolymer. The copolymerization of AA with AAm should introduce spacers between the carboxyl functional monomer units [21].
77
Chapter 4
Results and discussions
4.2.6 Dynamic protein binding capacity
Polymer brush characterization was further done by dynamic protein capacity using lysozyme (Table 4.4). The highest capacity was observed for membrane modified with cross-linker AAHMBAA and AALMBAA (67 mg/ml), while the lowest capacity was observed for membrane modified with diluent AAAAm (46 mg/ml). The AA shows intermediate capacity (56 mg/ml).
Table 4.4: Binding capacity for lysozyme of PP-based membrane adsorbers.
Type of
Protein binding
modification
capacity (mg/ml)
AA
56
AAAAm
46
AALMBAA
67
AAHMBAA
67
The membranes with the cross-linker ion-exchange polymer layers had higher dynamic protein capacities than uncross-linker counterparts. Apparently, the available amount of carboxylic groups is used more efficiently when the grafted layer contains chemical cross-links (more detailed study can be found in section 4.5).
Investigation on dynamic protein binding capacity of functional-diluent membrane adsorber series was further performed (Figure 4.16). Membrane adsorbers still have high protein capacity even at a content of about 45% of carboxyl groups (44 mg/mL lysozyme were found for 75% and 50% AA during synthesis). Below this content, the protein capacity reduces linearly, and protein capacity seemed to dependence on the amount of functional groups. In other words, only in this range the addition of spacer reduces the protein capacity systematically. The capacity of ~3 mg/mL for grafted PAAm, corresponds to non-specific binding to PP surface under the used conditions.
78
Chapter 4
Results and discussions
Protein binding capacity (mg/mL)
60 50 40 30 20 10 0 0
20
40
60
80
100
120
AA content in AA/AAm mixture (mol% )
Figure 4.16: Lysozyme binding capacity for PP-based membrane adsorbers functionalized using reaction mixtures of functional (AA) and diluent monomer (AAm).
4.3 Inadvertent pH transient – an alternative determination of ion-exchange capacity
Inadvertent pH transient is a dynamic test and in situ characterization of resins and monoliths [127-128]. It is fast, simple, cheap and non-destructive for determining ionexchange capacity (c.f. see 3.7.2). This method is versatile and it is interesting to apply to membrane adsorber. There is an analogy to the dynamic protein binding experiment; one difference is that the detected counter ion (proton) is much smaller for the inadvertent pH transient than that detected during protein binding evaluation (protein molecule). Also, the actual stoichiometry between fixed and counter ions is not known a priori, for protons it depends on the concentration and composition of the buffer used, for proteins it depends on protein charge and size.
In this method, modified membrane had been pre-saturated with high concentration of buffer solution; followed by swift change to low concentration of buffer solution at the same pH value. The pH, absorbance and time of pH transient were measured until the
79
Chapter 4
Results and discussions
original pH values have been achieved. These pH values were constant with further increase in elution time.
4.3.1 Variation of functional monomer concentration
The membranes grafted with AA at different concentrations were evaluated in order to observe a relation between inadvertent pH transient capacities with the amount of functional groups introduced by grafting (Figure 4.17). Overall, the pH transient increases rapidly, as the transient time was increased until a maximum point was achieved. Further increase in elution time, decreases the pH transient reaching the original pH value. The membrane prepared with the lowest concentration of AA shows the smallest response. Both maximum and broadness of the pH “peak” response increase as the amount of carboxylic group in the membrane was increased (Figure 4.17). The reason for this phenomenon would be that the amount of protons taken up by the step decrease of concentration of salt cations in the buffer increase.
6.4 6.3 6.2 AA_5 AA_10 AA_15 AA_20
pH
6.1 6 5.9 5.8 5.7 5.6 5.5 0
50
100
150
200
250
300
Time (min)
Figure 4.17: Inadvertent pH transient for PP-based membrane adsorbers, functionalized with different monomer concentration (cf. Figure 4.2).
80
Chapter 4
Results and discussions
The area under the curve has then been used for measuring inadvertent pH transient capacity. These values were then correlated with the DG values (see Figure 4.18). A systematic correlation between inadvertent pH transient capacity and DG is achieved. As the DG was increased, the inadvertent pH would first increase; slightly increase in pH inadvertent is then observed with further increase in DG. The correlation between inadvertent pH and protein binding capacity will be explained in section 4.3.2.
Inadvertent pH transient area (-)
1600 1400 1200 1000 800 600 400 200 0 0
100
200
300
400
500
600
Degree of grafting (µg/cm²)
Figure 4.18: Inadvertent pH transient (correlation of peak area) with degree of grafting.
4.3.2 Variation of brush structure (Mixture of functional monomer and diluent or functional monomer and cross-linker)
The correlation between pH inadvertent and protein binding capacity was investigated for different modified membranes. The concentrations of AA, AAm and MBAA in the mixture solution were varied and the dynamic lysozyme binding capacity was also observed. The results are presented in Figure 4.19.
81
Chapter 4
Results and discussions
80
Protein binding capacity (mg/mL)
70
(436)
(389)
AAHMBAA
AALMBAA
(339)
60
(236)
AA_20
AA_15
(508)
AA_10 50
0.00 426.53
AA_5
AAAAm7525
(105)
40
(435)
AAAAm5050 (414)
Functional
30 AAAAm2575
20
FunctionalCross linker
(376)
10
AAm (520)
FunctionalDiluent
UPP
858.41 1186.4 9 1365.4 0 1466.1 2 1159.6 9 1174.0 0 865.61
0 0
200
400
600
800
1000
1200
1400
1600
Inadvertent pH transient area (-)
Figure 4.19: Relationship between inadvertent pH transient capacity and protein capacity for various PP-based membrane adsorbers. The number in bracket indicates the DG.
For the membranes with varied grafted structure by monomer solution composition, the pH transient capacity correlates quite well with the content of AA in the functional layer (see series AAm to AAAAm7525 or AALMBAA vs. AAHMBA, the latter containing more cross-linker and less AA). However, the comparison among the grafted AA homopolymer membranes (AA-15), AA with the “diluent” copolymer (AAAm7525) and AA with the cross-linker (AALMBAA) may also indicate that for too high carboxyl content in swollen grafted layer, the dynamic ion-exchange capacity from pH transient may be somewhat lower than according to the actual amount of carboxyl groups. This hypothesis is supported by data for the grafted AA homopolymer membranes with significantly higher DG than all other membranes (AA-20; ~510 µg/cm2), which shows protein binding capacity similar to the cross-linker membrane with lower DG (AALMBAA; ~390 µg/cm2).
Protein capacity and ion-exchange capacity from pH transient seems to be correlated, but both DG (for linear PAA) and grafted layer structure (at same DG) had an influence on the efficiency of protein binding (expressed as ratio between protein and ion-exchange
82
Chapter 4
Results and discussions
capacity). For a lower DG (~100 µg/cm2 obtained at 5 g/L AA), protein binding was significantly more efficient than for a higher DG (~510 µg/cm2 at 20 g/L AA, c.f. section 4.1.2). This can well be explained by steric hindrance for protein binding when the grafted layer is more extended into the pore space. The addition of cross-linker seems to provide a unique character because the highest protein capacities are combined with the highest dynamic ion-exchange capacities for small ions or the best efficiency of protein binding. Therefore, chemical cross-linking of the grafted ion-exchange layer seems to be most versatile for optimization of high-capacity porous membrane adsorber performance (three-dimensional).
Overall, it can be concluded that the alternative characterization method is also applicable for porous membrane adsorbers and it gives most useful information about dynamic ionexchange capacity.
4.4 System dispersion
The effects of the various volumes in the system (membrane stack volume vs. volume of all other components) as well as non-ideal flow such as mixing and channelling should be considered since their influence on breakthrough curves can be quite relevant. This is particularly true in the case of small separation units in which the layered stack of membranes has a volume that is smaller than the total volumes of capillaries, flow distributors and detector required in the chromatography system. All these effects contribute to what is generally called system dispersion [30] (cf. 2.3.1 and 3.7.3).
The dispersion model is based on the model for an ideal plug-flow reactor which is combined with axial dispersion of the substance [31]. The system dispersion can then be represented by the shape of breakthrough curve, if the response curve resembles step response (slope very steep) dispersion is not significant, while if the curve response deviates from step response (slope very broad) dispersion is significant and cannot be ignored in attempts to interpret dynamic performance of membrane adsorbers [30]. Acetone and protein (lysozyme) were used as the tracers in order to explain the behavior of membranes in the module as well as the additional impact of grafted brushes.
83
Chapter 4
Results and discussions
4.4.1 Acetone as a tracer at different flow rate: Breakthrough curve investigation.
In order to investigate the influence of grafted brush onto protein breakthrough curve, it is necessary to check whether there is any extra physical influence other than ionexchange (functionality). This was done by injecting acetone as a tracer (5 v/v % in buffer) at different flow rates starting from 0.5 to 3.0 mL/min. The experiments were done for CIM (empty module), UPP and modified membranes (AA, AAAAm, AALMBAA and AAHMBAA).
The result shows that similar breakthrough curve was observed in CIM for various flow rates, i.e., change in acetone flow rate does not influence the curve behaviour (Figure 4.20). Similar phenomena were observed for UPP and modified membranes. In addition, no difference in breakthrough curve for unmodified and all modified membranes was also observed (Figure 4.21). More breakthrough curves for different modules/membranes and different flow rates are presented in appendix A.
1
C/Co
0.8
CIM_Ace_05 CIM_Ace_10
0.6
CIM_Ace_15 CIM_Ace_20
0.4
CIM_Ace_25 CIM_Ace_30
0.2 0 0
0.2
0.4
0.6
0.8
1
Volume (ml) Figure 4.20: Breakthrough curves of CIM empty module from acetone at different flow rate.
84
Chapter 4
Results and discussions
1 0.8
CIM_Ace_20
C/Co
UPP_Ace_20
0.6
AA_Ace_20 AAAAm_Ace_20
0.4
AALMBAA_Ace_20 AAHMBAA_Ace_20
0.2 0 0
0.2
0.4 0.6 Volume (ml)
0.8
1
Figure 4.21: Breakthrough curves of CIM empty module, unmodified membrane (UPP) and modified membranes from acetone at 2 mL/min flow rate.
The similar shape of all breakthrough curves at various different flow rates in CIM empty module implies that the dispersion effect is not influenced by flow rate (Figure 4.20). Slight delay of the initial point of breakthrough for module with membrane could be understood due to addition of volume of the membrane (48 µL) leading to longer time is needed for acetone to pass the membrane pores (Figure 4.21).
Similar breakthrough curves (shape and initial point) for UPP and modified membrane indicate that there is no different dispersion among them and the modification only slightly alters the original character of membrane pore. This finding is supported by the observation via SEM and permporometry, i.e., no significant difference in pore size resulted from grafting (cf. 4.2.2, 4.2.3). However when the slope of the breakthrough curve within the range 30-70% (C/Co) was calculated as representative of dispersion, the difference among the CIM empty module, UPP and modified membrane was observed (Figure 4.22). The average slope value for CIM is 3.5 ± 1.3 mL-1, while for UPP it is 4.5 ± 0.3 mL-1, for AA modified membranes it is 3.6 ± 1.1 mL-1, AAAAm it is 5.1 ± 1.6 mL-1, AALMBAA is 4.5 ± 0.8 mL-1 and AAHMBAA is 5.2 ± 1.0 mL-1. Small slope value indicated the shape of breakthrough curve is broad; hence dispersion is big, while
85
Chapter 4
Results and discussions
greater slope value means the shape of breakthrough curve is sharp; hence dispersion is
S lo p e o f 30-70% B T C A ceto n e (m L -1 )
small.
CIM AA AALMBAA
8 7
UPP AAAAm AAHMBAA
6 5 4 3 2 1 0 0.5
1
1.5
2
2.5
3
Flow rate (mL/min)
Figure 4.22: Calculated breakthrough slope within the range 30-70% (C/Co) for CIM, UPP and membrane adsorbers based PP using acetone.
That the UPP has average slope value 28% higher than CIM indicates that the dispersion in UPP module is smaller related to module construction (Figure 2.6). Furthermore, even though the breakthrough curves of UPP and modified membranes are similar, the dispersion study suggests that there is difference in dispersion, i.e., the average slope value of modified membrane regardless of flow rate relative to UPP shows different value (AA less than 19%, AAAAm more than 13%, AALMBAA approximately the same and AAHMBAA more than 15%). The addition of membrane volume provides more defined solute pathway through frit and module contributes to small dispersion in membrane module relative to empty module. The defined solute pathway however will behave slightly different depending on grafted structure in the membrane pores.
Throughout the flow rate variation, only UPP shows constant breakthrough slope value indicates that the dispersion is not influenced by the flow rate. Different slope value for
86
Chapter 4
Results and discussions
CIM empty module at different flow rate indicates the dispersion is influenced by the flow rate leading to difference in turbulence. The effect of flow rate on dispersion was also observed for modified membranes due to different brush structure grafted on the pores.
4.4.2 Acetone as a tracer at different flow rate: Residence time distribution (RTD) analysis
In this study, the breakthrough curve was converted to residence time distribution function (RTD) using analysis of step input for non ideal reactor according to Missen [32]. The RTD curves of CIM empty module at different flow rates are presented in Figure 4.23 (other RTD curves are shown in appendix B). As the flow rate was increased from 0.5 to 3 mL/min, the duration of acetone molecule remained in the module becomes shorter as a results, RTD curve becomes narrow. 18
Residence Time Distribution (min -1)
16 14 12
CIM_05 CIM_10
10
CIM_15 8
CIM_20 CIM_25
6
CIM_30
4 2 0 0.0
0.2
0.4
0.6
0.8
1.0
1.2
1.4
1.6
1.8
2.0
Time (min)
Figure 4.23: RTD curve of CIM empty module at different flow rates.
The RTD curves of different modules at flow rate of 2 mL/min (c.f. Figure 4.21) are presented in Figure 4.24. The empty module, unmodified and modified PP membranes showed different behavior. The CIM empty module shows earlier starting point and
87
Chapter 4
Results and discussions
broader RTD than both unmodified and modified membranes. The maximum of RTD of unmodified membrane is higher compared to all modified membranes; nevertheless, their starting points are similar. The different RTD behavior between empty module and membrane module is due to the additional volume of membrane. As a result, it lengthens the solute pathway through frit and module (cf. section 4.4.1). Although it is quite small, the different of RTD behavior between different membrane modules could be due to the influence of grafted brush structure.
Residence Time Distribution (min -1)
16 14 12 CIM_20 10
UPP_20 AA_20
8
AAAAm_20 AALMBAA_20
6
AAHMBAA_20 4 2 0 0.0
0.1
0.2
0.3
0.4
0.5
Time (min)
Figure 4.24 RTD curves of CIM empty module, unmodified PP and modified membranes (AA, AAAAm, AALMBAA and AAHMBAA) at flow rate of 2.0 mL/min.
Considering the curve shape, significant deviations from ideal plug-flow behaviour are observed in all systems (Figure 4.23 and 4.24). This is could be due to back mixing in the modules as noticed by the exponential decay shape of the curve at the last points compared to the starting points for all types of module in all flow rates.
The mean residence times are presented in Table 4.5. As the flow rate was increased the mean residence time decreases in all modules and the lowest value was observed in CIM
88
Chapter 4
Results and discussions
empty module. No significant different value is found for unmodified PP and modified membranes (AA, AAAAm, AALMBAA and AHMBAA) as expected.
Table 4.5: Mean residence time of acetone molecule in different module at different flow rate.
Type of module/ Mean Residence time at different flow rate (second) membrane 0.5
1.0
1.5
2.0
2.5
3.0
mL/min mL/min mL/min mL/min mL/min mL/min CIM
37
17
11
8
7
6
UPP
38
20
13
10
8
6
AA
36
20
13
10
8
7
AAAAm
40
20
13
10
8
6
AALMBAA
37
20
13
10
8
6
AAHMBAA
41
19
13
10
8
7
No additional volume in empty module is the reason for the shortest period of acetone mean residence time, while the present of additional membrane volume (unmodified membrane (UPP)
and modified membranes (AA, AAAAm, AALMBAA and
AAHMBAA)) increases fluid flow defined pathway of acetone leading to higher mean residence time.
The dispersion was then analyzed by calculating the chromatography unit Peclet number (Per). These numbers are presented in Table 4.6. In all flow rates, CIM empty module show the lowest Per value due to no membrane volume present. For certain modification such as functional-diluent AAAAm, Per value range is very broad (highest 52 and lowest 19) This indicates the mixing influenced by the functional-dilute brush structure is sensitive to flow rate change. Generally, as the flow rate was increased Per would decrease even though some exceptional values are also found.
89
Chapter 4
Results and discussions
Table 4.6: The chromatography unit Peclet number (Per)of acetone in different module at different flow rate.
Type of module/ The chromatography unit Peclet number (Per) at different flow rate membrane 0.5
1.0
1.5
2.0
2.5
3.0
mL/min
mL/min
mL/min
mL/min
mL/min
mL/min
CIM
17
15
13
14
14
14
UPP
25
23
21
21
22
21
AA
24
21
18
17
18
36
AAAAm
52
52
19
19
20
19
AALMBAA
25
23
20
20
20
20
AAHMBAA
41
24
34
20
21
38
Overall, it is shown that most of Per values are within the range large to intermediate amount of dispersion (5 ≤ Per ≤ 40) [31, 35]. According to Suen et al. [35], for Per above 40, the dispersion effect could be ignored. In this case, since most of values are below 40 the dispersion cannot be neglected and must be considered during the modeling. This system might be modeled as a CSTR and PFR in series (cf. 2.3.1, Figure 2.4). Sarfert et al. has proposed a model for membrane chromatography by using combination of CSTR and PFR [43]. This model appears suitable and was adapted by Boi et al. [144]. The RTD obtained from acetone analysis provides the information that grafting brush structure causes minimum change to original morphology of PP membrane.
4.4.3 Lysozyme at variation of flow rate: Breakthrough curve investigation.
The investigation of dispersion in the module was then continued using lysozyme. This was done by injecting excess amount of lysozyme at different flow rates from 0.5 to 2.0 or 3.0 mL/min. Similar with investigation using acetone, the experiments were done for CIM, UPP and modified membranes (AA, AAAAm, AALMBAA and AAHMBAA).
90
Chapter 4
Results and discussions
As presented in Figure 4.25, the shape and initial point of breakthrough curve in CIM were similar for all different flow rates. Such behaviour is also observed for UPP membrane (see appendix A). These means no influence of flow rate variation was observed in both modules, this observation is analogous to inert tracer acetone (c.f. 4.4.1, for the lysozyme RTD analysis of CIM empty module and unmodified PP (see section 4.4.4). Note that for the unmodified membrane non-specific protein binding will take place, however it is small and insignificant.
1
0.8 CIM_Lys_05 CIM_Lys_10
C/Co
0.6
CIM_Lys_15 CIM_Lys_20
0.4
CIM_Lys_25 CIM_Lys_30
0.2
0 0
0.5
1
1.5
2
2.5
3
Volume (ml)
Figure 4.25: Breakthrough curves of CIM from lysozyme at different flow rate.
By contrast, the influence of flow rate variation on breakthrough curve behaviour is observed in AAAAm modified membrane as noticed by difference in initial point as well as slope value (Figure 4.26). However, this effect is not observed for AAHMBAA modified membrane as evidenced by similar initial point and slope value (Figure 4.27) (other breakthrough curve in appendix A). Further analysis was done by comparing breakthrough curve at the same flow rate (2 mL/min) for different modules. The results are presented in Figure 4.28.
91
Chapter 4
Results and discussions
1
0.8
AAAAm_Lys_05 AAAAm_Lys_10 AAAAm_Lys_15
0.4
AAAAm_Lys_20
C/Co
0.6
0.2
0 0
0.5
1
1.5
2
2.5
3
Volume (ml)
Figure 4.26:Breakthrough curves of AAAAm modified membrane from lysozyme at different flow rates.
1
AAHMBAA_Lys_05
0.8
AAHMBAA_Lys_10 C/Co
0.6 AAHMBAA_Lys_15 AAHMBAA_Lys_20
0.4
AAHMBAA_Lys_25 0.2 AAHMBAA_Lys_30 0 0
0.5
1
1.5
2
2.5
3
Volume (ml)
Figure 4.27: Breakthrough curves of AAHMBAA modified membrane from lysozyme at different flow rates.
92
Chapter 4
Results and discussions
1
C/Co
0.8
CIM_Lys_20 UPP_Lys_20
0.6
AA_Lys_20 AAAAm_Lys_20
0.4
AALMBAA_Lys_20 AAHMBAA_Lys_20
0.2 0 0
0.5
1
1.5
2
2.5
3
Volume (ml) Figure 4.28: Breakthrough curves of CIM, UPP and modified membranes using lysozyme as the tracer at flow rate of 2 mL/min.
First, a slight shift of breakthrough curve for unmodified membrane UPP compared to CIM empty module was observed in Figure 4.28. This is mainly due to the membrane stack volume (48 µL, cf. 4.4.1; protein binding to PP was only 2.7 mg/mL and would correspond to an additional volume of protein “tracer” solution of only ~0.5 µL), and this volume was indeed smaller than the volume of the rest of the system (225 µL). Second, the breakthrough curve of the unmodified membrane UPP was significantly steeper than all modified membranes indicating that dispersion has been increased, this phenomenon is presumably due to specific interaction start to occur in membrane adsorber pores in addition to defined solute pathway. Third, the breakthrough curves for all modified membrane adsorbers were considerably shifted to longer time as a result of grafted functional brush (larger elution volume). Binding capacities of modified membranes can be calculated from the area under the breakthrough curve subtracted by area of UPP membrane (see section 4.5).
The dispersion behaviour of CIM empty module, unmodified membrane UPP and modified membranes (AA,AAAAm, AALMBAA and AAHMBAA) are further analyzed by calculating the curve slope within the range 30-70% (C/Co). As presented in
93
Chapter 4
Results and discussions
Figure 4.29, a systematic pattern was observed. CIM and UPP have the highest slope value (~4.2 ± 0. 6 mL-1, ~3.6 ± 0.4 mL-1 respectively) while the modified membranes have smaller slope value in all flow rates (~1.2 ± 0.4 mL-1 for AA, ~0.8 ± 0.2 mL-1 for AAAAm, ~ 1.2 ± 0.2 mL-1 for AALMBAA, ~1.5 ± 0.2 m L-1 for AAHMBAA). The CIM has average slope value 4% and 33% higher than UPP at flow rate between 0.5 to 2 mL/min and 2.5 to 3 mL/min respectively. The slope value of modified membranes relative to UPP shows reduction pattern (AA: 67%, AAAAm: 79%, AALMBAA: 67% and AAHMBAA: 57%).
Slope of 30-70% of BTC Lys (mL-1)
6 5 CIM
4
UPP AA
3
AAAAm AALMBAA
2
AAHMBAA
1 0 0.5
1
1.5
2
2.5
3
Flow rate (mL/min)
Figure 4.29: Calculated breakthrough slope within the range 30-70% (C/Co) for CIM, UPP and membrane adsorbers based PP using lysozyme.
The interactions of lysozyme with UPP and modified PP membranes are different because of lysozyme and grafted brush properties (it should be noted that lysozyme has much bigger size than acetone and both lysozyme and grafted polymer brush have charge). No binding occurs in CIM, while it seems that in UPP, even though small amount of non-specific interactions is occurred (c.f. above), defined solute pathway lead to low mixing (small dispersion), while in modified membranes specific interactions (electrostatic interactions) are dominant. Among modified membranes, the dispersion properties are also different due to difference in variation structure of grafted brush. On
94
Chapter 4
Results and discussions
the one hand different flow rate results in different dispersion value for AAAAm modified membrane, on the other hand it results in similar dispersion for AAHMBAA.
4.4.4 Lysozyme as a tracer at variation of flow rate: Residence time distribution (RTD) analysis
Similar investigation on residence time distribution function (RTD) has been done via injection of lysozyme into module. The effect of flow rate on the residence time distribution (RTD) was studied using CIM empty module and unmodified PP (UPP) membrane. The CIM empty module results are presented in Figure 4.30 (see appendix B for results of unmodified PP membrane). As the flow rate was increased from 0.5 to 3 mL/min, the residence time would narrower be distributed and the maximum value of RTD increases due to duration of lysozyme molecule stay in the module becomes shorter.
20
Residence Time Distribution (min -1)
18 16 14
CIM_05
12
CIM_10 CIM_15
10
CIM_20
8
CIM_25 CIM_30
6 4 2 0 0.0
0.2
0.4
0.6
0.8
1.0
Time (min)
Figure 4.30 RTD curve of CIM empty module at different flow rate.
The residence time distribution (RTD) curve for CIM empty module and unmodified PP at flow rate 1.5 mL/min was then investigated (Figure 4.31). Again, the CIM empty module and unmodified membranes UPP showed different behavior (cf. Figure 4.24). The CIM empty module shows earlier starting point and higher RTD than unmodified
95
Chapter 4
Results and discussions
membrane UPP. The different is due to the addition of membrane gives additional volume, as a consequence lysozyme has more defined pathway. 9
Residence Time Distribution (min -1)
8 7 6 5
CIM_15 UPP_15
4 3 2 1 0 0.0
0.1
0.2
0.3
0.4
0.5
0.6
0.7
Time (min)
Figure 4.31: RTD curve of CIM empty module and unmodified PP membrane at flow rate of 1.5 mL/min.
The mean residence time when lysozyme was used as a tracer are presented in Table 4.7. The mean residence time decreases with increasing flow rate. The value obtained for unmodified PP is bigger than empty module due to additional membrane volume (cf. Table 4.5). In addition to that, the mean residence time value for unmodified membrane obtained from lysozyme is also bigger than obtained from acetone due to small nonspecific protein binding occur between lysozyme and UPP surface.
Table 4.7: Mean residence time of lysozyme molecule in different module at different flow rate. Type of module/ Mean Residence time at different flow rate (second) membrane 0.5
1.0
1.5
2.0
2.5
3.0
mL/min
mL/min
mL/min
mL/min
mL/min
mL/min
CIM
34
16
13
9
7
6
UPP
43
24
16
12
9
8
96
Chapter 4
Results and discussions
The chromatography unit Peclet numbers, (Per) when lysozyme was used as a tracer are presented in Table 4.8. This number shows UPP has higher value than CIM due to additional membrane volume (c.f. Table 4.6). Even though, the overall Per values obtained in lysozyme analysis are smaller than when acetone was used as a tracer, they are still in the range in which the dispersion cannot be ignored ( 5 ≤ Per ≤ 40).
Table 4.8: The chromatography unit Peclet number Per of lysozyme in different module at different flow rate.
Type of module/ The chromatography unit Peclet number (Per)at different flow membrane
rate 0.5
1.0
1.5
2.0
2.5
3.0
mL/min
mL/min mL/min mL/min mL/min
mL/min
CIM
9
10
12
12
8
8
UPP
20
21
20
21
23
22
The RTD obtained from lysozyme analysis shows there is occurrence of small nonspecific interaction between unmodified membrane UPP and protein. Acetone and lysozyme RTD analyses further clarify the mixing is significant and consequently should be considered in membrane adsorber modeling.
4.4.5 Acetone vs lysozyme: Breakthrough curve investigation
Comparing breakthrough curve resulted from acetone and protein suggests that the shape of breakthrough curve for CIM is the same for acetone and lysozyme (Figure 4.32). The initial point of breakthrough curve in CIM for both tracers is the same because no binding occurs. The average slope values of CIM with lysozyme are 20% higher than with acetone (although from Figure 4.32 it seems that slope is higher for acetone) indicating that the dispersion in CIM is lower with lysozyme than with acetone (c.f. Figure 4.22 and 4.29). This observation can be explained by different tracer properties. Acetone and lysozyme has different molecule size and charge; consequently, diffusivity is different. Acetone has much bigger diffusion coefficient than lysozyme.
97
Chapter 4
Results and discussions
1
0.8
0.6 C/Co
CIM_Ace_20 CIM_Lys_20
0.4
0.2
0 0
0.2
0.4
0.6
0.8
1
Volume (ml)
Figure 4.32: Breakthrough curves of CIM from acetone and lysozyme at 2 mL/min flow rate (c.f. Figure 4.21 and 4.28).
The shape of breakthrough curve for unmodified membrane UPP is slightly different in acetone and lysozyme (Figure 4.33). The initial point of breakthrough curve in unmodified membrane UPP is slightly delay with lysozyme due to small non-specific binding occurs. The average slope values of UPP with lysozyme are 20% lower than with acetone indicating that the dispersion in UPP is higher with lysozyme than with acetone (c.f. Figure 4.22 and 4.29). This observation is opposite than what was observed in CIM. Although the additional of membrane volume provided more defined solute pathway and suppose to reduce dispersion, the small non-specific interaction cause dispersion to increase. This could be due to the different tracer properties. Acetone is almost inert to unmodified PP and lysozyme is not totally inert to unmodified PP.
98
Chapter 4
Results and discussions
1
C/Co
0.8 0.6
UPP_Ace_20 UPP_Lys_20
0.4 0.2 0 0
0.2
0.4
0.6
0.8
1
Volume (ml) Figure 4.33: Breakthrough curves of UPP from acetone and lysozyme at 2 mL/min flow rate (c.f. Figure 4.21 and 4.28).
As a result from binding kinetics between lysozyme and grafted brush, the initial points of breakthrough curve of all modified membranes were delayed when protein is used as the tracer compared to acetone. For AAAAm modified membrane, significant difference in the slope of breakthrough curve is observed (in acetone is steeper than in lysozme), whereas less significant is observed for AAHMBAA modified membrane (Figure 4.34 and 4.35). In addition to that, the average slope value of modified membrane is much higher in acetone rather than in lysozyme indicating the kinetic binding influence becomes more dominant when protein is used rather than dispersion (AA: ~67%, AAAAm: ~85%, AALMBAA: ~73%, AAHMBAA: ~70%) (c.f. Figure 4.22 and 4.29). In particular for membrane adsorbers, the slope value also shows clearly the transition from no binding (acetone) to specific binding (lysozyme).
99
Chapter 4
Results and discussions
1
C/Co
0.8 0.6
AAAAm_Ace_20 AAAAm_Lys_20
0.4 0.2 0 0
0.5
1
1.5 2 2.5 Volume (ml)
3
3.5
4
Figure 4.34: Breakthrough curves of AAAAm at flow rate of 2 mL/min (c.f. Figure 4.21 and 4.28).
1
C/Co
0.8 0.6
AAHMBAA_Ace_20 AAHMBAA_Lys_20
0.4 0.2 0 0
0.5
1
1.5
2
2.5
3
Volume (ml)
Figure 4.35: Breakthrough curve for AAHMBAA from acetone and lysozyme at flow rate of 2 mL/min (c.f. Figure 4.21 and 4.28).
100
Chapter 4
Results and discussions
4.4.6 Variation of lysozyme concentration: Breakthrough curve investigation
Further investigation on the behaviour of grafted brush with different structure was done through variation of lysozyme concentration. As the protein concentration was increased the breakthrough curve appears earlier and sharper. This phenomenon was observed for all modified membranes. Figure 4.36 shows the breakthrough curve for AALMBAA modified membrane as an example (other breakthrough curves can be seen in appendix A).
1
C/Co
0.8 AALMBAA_Lys3_10
0.6
AALMBAA_Lys5_10 0.4
AALMBAA_Lys10_10
0.2 0 0
0.5
1
1.5
2
2.5
3
3.5
4
Volume (ml) Figure 4.36: Breakthrough curves of AALMBAA modified membrane at different concentration of lysozyme.
Figure 4.37 shows further analysis of the breakthrough curve at lysozyme concentration of 5 mg/mL concentration for different module/membranes (more breakthrough curves in appendix A). The CIM and UPP show the sharpest curve compared to all modified membranes. Among modified membranes, AAHMBAA shows the sharpest curve while AAAAm shows the broadest curve. The initial point of breakthrough curve is also different, i.e., CIM shows firstly followed by UPP. Thereafter, initial point of breakthrough curve for AAAAm can be observed, followed by AA, AALMBAA and AAHMBAA. Similar finding is observed in previous experiments (c.f. Figure 4.28).
101
Chapter 4
Results and discussions
1
C/Co
0.8
CIM_Lys5_10 UPP_Lys5_10
0.6
AA_Lys5_10 AAAAm_Lys5_10
0.4
AALMBAA_Lys5_10 AAHMBAA_Lys5_10
0.2 0 0
0.5
1
1.5
2
2.5
3
Volume (ml) Figure 4.37: Breakthrough curve of CIM, UPP and modified membranes from lysozyme with 5 mg/mL concentration.
The dispersion behavior of different modules at different concentration was then analyzed by calculating the curve slope within the range 30-70% (C/Co) and shown in Figure 4.38. An obvious pattern was observed; CIM has the highest slope value while the UPP and modified membranes have about the same slope value throughout variation concentration. As 3 mg/mL of lysozyme was injected, CIM has slope value 2.2 mL-1 while modified and unmodified has ~0.6 ± 0.2 mL-1. At lysozyme concentration of 5 mg/mL, CIM has slope value 4.3 mL-1 and modified and unmodified have ~1.1 ± 0.3 mL1
. As 10 mg/mL of lysozyme was injected, CIM has slope value 6.3 mL-1 and modified
(excluding AAHMBAA) and unmodified membranes have 3.7 ± 0.1 mL-1.
102
Slope of 30-70% BTC Lys (mL-1)
Chapter 4
Results and discussions
10 8
CIM AAAAm
UPP AALMBAA
AA AAHMBAA
6 4 2 0 3
5 10 Lys concentration in solution (mg/mL)
Figure 4.38: Calculated breakthrough slope within the range 30-70% (C/Co) for CIM, UPP and membrane adsorbers based PP at different lysozyme concentration.
In CIM module the dispersion is lower due to no binding occur regardless of protein concentration (c.f. 4.4.5). At 3 mg/mL and 5 mg/mL injected lysozyme, the average slope value of membrane (modified and unmodified) is ~74% lower than in CIM, while at 10 mg/mL injected lysozyme, the average slope value of modified membranes (excluding AAHMBAA modified membrane) is ~42% lower than in CIM. As the lysozyme concentration was increased the present of high amount of lysozyme quickly occupied binding site on functional brush and probably contribute to more define solute pathway, hence decrease dispersion. Surprisingly, the slope of AAHMBAA at 10 mg/mL of protein is quite high. This, however, is difficult to be explained. In general, the dispersion decreases as the concentration of protein was increased. However the level of reduction is not significant enough to distinguish between unmodified and modified membranes.
4.4.7 Variation of protein size (Lysozyme, BSA, IgG): Breakthrough curve investigation
Further investigation on the dispersion behaviour of grafted brush with different structure was done through variation of protein size. Different types of protein with respect to size
103
Chapter 4
Results and discussions
and isoelectric point (pI) were selected for this purpose (Table 4.9). Acetate buffer at pH 5 was used to suit the pI of all proteins for binding to cation exchanger.
Table 4.9: Different types of protein: size and isoelectric point (pI).
Type of protein
Size (kDa)
Isoelectric point (pI)
Dimension (nm)
Cytochrome c
12.2 [145]
10.8 [145]
sphere size with diameter 3.5-4.0 nm [146]
Lysozyme
14
11
4.5 x 3.0 x 3.0 [137]
BSA
66
4.7, 4.8 [147]
14.0 x 4.0 x 4.0 [148]
IgG
150
5.8 to 7.3 [149]
12.0 x 4.0 x 4.0 [150]
The breakthrough curve of CIM using different types of protein is shown in Figure 4.39. Similar breakthrough curve for all protein was obtained in CIM regardless their sizes due to no protein binding occur in this module.
1
C/Co
0.8 0.6
CIM_Lys_10 CIM_BSA_10
0.4
CIM_IgG_10
0.2 0 0
0.5
1
1.5 2 Volume (ml)
2.5
3
Figure 4.39: Breakthrough curves of CIM from different types of proteins.
104
Chapter 4
Results and discussions
The breakthrough curve of UPP using different types of protein is shown in Figure 4.40. Similar breakthrough curve was obtained for lysozyme and IgG and a slight shift of breakthrough curve was obtained for BSA, i.e., the initial point appears later than the others.
1
C/Co
0.8 0.6
UPP_Lys_10 UPP_BSA_10
0.4
UPP_IgG_10
0.2 0 0
0.5
1
1.5
2
2.5
3
Volume (ml) Figure 4.40: Breakthrough curves of UPP from different size of proteins.
Non-specific binding and hydrophobic interactions occur between protein and membrane pore surface. The reason for the later appearance of BSA breakthrough curve compared with other proteins is non-specific binding and hydrophobic interaction is stronger for this protein under experimental condition compared with other type of protein (it should be remembered that the experiments were done at pH 5 which is close to pI of BSA).
As presented in Figure 4.41, different breakthrough curves were obtained for different proteins in all modified membranes (other breakthrough curves are presented in appendix A). As the protein size was increased, the initial point was later and the slope of breakthrough curve becomes less steep. Breakthrough curve of lysozyme appears first followed by BSA and IgG, indicating that smaller protein will first appear even though it has more positive charge. The smaller protein size (lysozyme) could possibly have simpler structure, consequently, the protein can bind faster compared to the protein with bigger size (BSA and IgG) (c.f. Table 4.9). 105
Chapter 4
Results and discussions
1
C/Co
0.8 0.6
AALMBAA_Lys_10 AALMBAA_BSA_10
0.4
AALMBAA_IgG_10
0.2 0 0
0.5
1
1.5
2
2.5
3
Volume (ml) Figure 4.41: Breakthrough curves of AALMBAA from different size of proteins.
The breakthrough curve of all proteins is investigated in CIM, UPP and modified membranes. Figure 4.42 shows the breakthrough curve for lysozyme in CIM, UPP and modified membrane. The CIM and UPP have breakthrough curve earlier than modified membranes. The slopes of all modified membranes are less steep than slope of CIM and UPP membrane. The initial point of breakthrough curve is the same for all modified membranes, but the shape of the breakthrough curve is different, i.e., broad curve was observed for AAAAm.
106
Chapter 4
Results and discussions
1
C/Co
0.8
CIM_Lys_10 UPP_Lys_10
0.6
AA_Lys_10 AAAAm_Lys_10
0.4
AALMBAA_Lys_10 AAHMBAA_Lys_10
0.2 0 0
0.5
1
1.5
2
2.5
3
Volume (ml) Figure 4.42: Breakthrough curves of CIM, UPP and modified membranes for small protein (lysozyme, Mw: 14 kDa, Acetate buffer, pH 5). Comparing with HEPES buffer (c.f. section 4.4.3,4.4.6), the observation in this experiment is different with previous results in term of initial point of breakthrough curve (in previous experiment each modified membrane has different initial point (c.f. Figure 4.28 and 4.37), while in this work it appears simultaneously). At pH 7, lysozyme has net positive charge and many carboxyl groups is deprotonated; therefore, the condition for lysozyme binding is very good. At pH 5, lysozyme has higher net positive charge than in pH 7, however only few carboxyl groups are deprotonated due to its pKa close to pH solution. As a result, the place available for protein binding is limited. Most probably due to this reason the different structure of brush becomes less sensitive to binding.
The breakthrough curve of big protein, e.g., BSA for CIM, UPP and modified membrane was shown in Figure 4.43 (the breakthrough for IgG can be seen in appendix A). The CIM and UPP have breakthrough curve earlier than modified membranes. Among modified membranes, the initial point of breakthrough curve is the earliest for AA membrane and the latest for AAAAm membrane. The slopes of all modified membranes
107
Chapter 4
Results and discussions
are less steep than slope of CIM and UPP membrane. Among modified membranes, the slope of AA membrane and AAAAm is less steep than AALMBAA and AAHMBAA.
1
C/Co
0.8
CIM_BSA_10 UPP_BSA_10
0.6
AA_BSA_10 AAAAm_BSA_10
0.4
AALMBAA_BSA_10 AAHMBAA_BSA_10
0.2 0 0
0.5
1
1.5
2
2.5
3
Volume (ml) Figure 4.43: Breakthrough curves of CIM, UPP and modified membranes of big protein (BSA, Mw: 66 kDa, Acetate buffer, pH 5). The dispersion behavior of various protein sizes in different modules is then analyzed by calculating the curve slope within the range 30-70% (C/Co) and shown in Figure 4.44. In lysozyme experiment, the slope value of CIM is 4.0 mL-1, while UPP is 3.9 mL-1, and all modified membranes are 3.7 ± 1.3 mL-1. In BSA test, the slope values are 3.4 mL-1, 3.5 mL-1 and 2.0 ± 0.4 mL-1 for CIM, UPP and all modified membranes, respectively. In IgG experiment, the slope value of CIM is 2.6 mL-1, while UPP is 4.3 mL-1 and all modified membranes are 1.8 ± 0.5 mL-1. Regardless of protein sizes, AAAAm shows the smallest slope value (average: 1.4 ± 0.3 mL-1) and the biggest dispersion in each system.
108
Chapter 4
Results and discussions
Slope of 30-70% BTC (m L-1 )
5 4
CIM UPP
3
AA AAAAm
2
AALMBAA AAHMBAA
1 0 Lys (14 kDa)
BSA (66 kDa)
IgG (150 kDa)
Different type of protein Figure 4.44: Calculated breakthrough slope within the range 30-70% (C/Co) for CIM, UPP and membrane adsorbers based PP using different protein types.
In all protein tests, the average slope value of all modified membranes is smaller than UPP membrane (lysozyme ~7%, BSA ~ 45% and IgG ~58%). This finding is systematic indication that dispersion increases as the protein size was increased. In addition, the closer of buffer pH to pI of protein results in the higher non-specific binding leading to increase in dispersion.
Overall, significant difference in dispersion was observed between UPP and modified membranes. The dispersion of AAAAm modified membrane is clearly influenced by the protein flow rate. However, in some cases the effects of protein flow rate and concentration on dispersion in modified membranes cannot significantly be observed. The effect of protein size on dispersion is clearly identified in all modified membranes. Thus, the effects of different grafted structure on the porous membrane adsorber could be differentiated via analysing the flow pattern inside the module with the membrane stack by breakthrough curves. Further, there is a direct correlation of increasing dispersion with reduction of water permeability at high pH and/or low salt concentration (c.f. section 4.2.5). This provides significant evidence that for porous membrane adsorbers with three-
109
Chapter 4
Results and discussions
dimensional functional layers on the pore walls, the diffusion of the solute to these binding sites should be considered.
4.5 Dynamic evaluation of protein binding capacity based on breakthrough curve
Based on previous breakthrough curve, investigations on protein capacity were continued in this section (c.f. 4.4.3, 4.4.6, 4.4.7). Protein capacity based on 10% of initial point breakthrough curve (10% BTC) and complete breakthrough curve (complete BTC) were calculated and compared in section 4.5.1, while for other section, only 10% BTC is used for discussion.
4.5.1 Variation of flow rate
Based on 10% BTC (Figure 4.45), the capacity of AA is not affected by flow rate variation (average: 62 ± 3 mg/mL). While for AAAAm, the capacity is affected by flow rate variation and gradually increases as flow rate was increased from 0.5 mL/min to 1.5 mL/min. Thereafter, the capacity reduces at flow rate of 2 mL/min (average: 51 ± 8 mg/mL). Slightly increase of protein capacity is observed for AALMBAA as flow rate was increased from 0.5 to 1.5 mL/min, capacity of membrane remains similar when flow rate increases to 2 mL/min (average: 74 ± 6 mg/mL). The capacity of AAHMBAA is almost independent on flow rate variation (average: 79 ± 3 mg/mL). In addition to that, only high cross-linker structure is able to be run at flow rate above 2 mL/min without excessive pressure problem.
110
10% of Initial point BTC Lys (mg/mL)
Chapter 4
Results and discussions
90 80 70 60
AA
50
AAAAm
40
AALMBAA
30
AAHMBAA
20 10 0 0.5
1
1.5
2
2.5
3
Flow rate (mL/min)
Figure 4.45: Membrane adsorber protein capacity based on 10% of initial point breakthrough curve (10% BTC).
Based on complete breakthrough curve (Figure 4.46), the AA shows fluctuation in result, at flow rate of 0.5, 1 and 2 mL/min it has approximately the same capacity but at flow rate of 1.5 mL/min it has quite high capacity (average: 67 ± 19 mg/mL). For AAAAm, the capacity gradually increases as flow rate increases from 0.5 to 2 mL/min (average: 74 ± 23 mg/mL). Constant capacity was observed for AALMBAA (average: 78 ± 4 mg/mL) and AAHMBAA (average: 72 ± 4 mg/mL) throughout flow rate variation.
111
Capacity of com plete BTC Lys (m g/m L)
Chapter 4
Results and discussions
110 100 90 80 70 60 50 40 30 20 10 0
AA AAAAm AALMBAA AAHMBAA
0.5
1
1.5
2
2.5
3
Flow rate (mL/min)
Figure 4.46: Membrane adsorber capacity based on integral complete area under the curve.
The AA shows consistent value and pattern in both measurements except for flow rate of 1.5 mL/min; complete BTC shows 9% higher average capacity than 10% BTC. The AAAAm shows capacity value much higher in complete BTC than in 10% BTC (about 45%), however it shows consistent pattern, i.e., protein capacity increases with increasing flow rate in both measurement. The AALMBAA shows slightly inconsistence value and pattern in both measurements (complete BTC capacity shows 5% higher average capacity than 10% BTC). Similar trend is observed for AAHMBAA (complete BTC shows 8% lower average capacity than 10% BTC). The different value is addressed by the shape of breakthrough curve from initial point to point where it becomes constant. It is quite obvious that all modified membranes have average capacity different less than 10 % in both measurements except for AAAAm (45%), and this information gives clue about the stability of grafted brush structure. Very high different value capacity between both measurements in AAAAm (Figure 4.45 and 4.46) shows the development of breakthrough curve in this structure is not normal compared with other modified membranes (c.f. Figure 4.28). As the protein binding occurred the brush slightly collapse [150]. AAAAm modified structure allows more protein binding but in other type of
112
Chapter 4
Results and discussions
modified membranes (especially structure containing cross-linker) this slightly collapse structure does not allow more protein binding. It suggests, as the binding process proceeds in AAAAm, the accessibility of functional brush increases. The degree of dispersion could be used as an indicator of the membrane performance stability (c.f. 4.4.3). Previous investigation already showed that AAAAm has the highest dispersion (most unstable structure) and AAHMBAA has the lowest dispersion (most stable structure) (c.f. Figure 4.29).
4.5.2 Variation of protein concentration
As shown in Figure 4.47, as the injected protein concentration increases from 3 to 10 mg/mL, the capacity of AA increases from 52 to 71 mg/mL (average: 61 ± 10 mg/mL) while for AAAAm increases capacity from 42 to 51 mg/mL (average: 48 ± 5 mg/mL). AALMBAA increases capacity from 70 to 80 mg/mL (average: 72 ± 7 mg/mL). For AAHMBAA, as protein concentration injected increases from 3 to 5 mg/mL, its capacity
10% o f Initial p oint BT C L ys (m g/m L )
increases from 65 to 80 mg/mL, thereafter it becomes constant (average: 74 ± 9 mg/mL).
90 80 70 60
AA
50
AAAAm
40
AALMBAA AAHMBAA
30 20 10 0 3
5
10
Lys concentration in solution (mg/mL) Figure 4.47: Membrane adsorber capacity based on 10% of initial point breakthrough curve (10% BTC).
113
Chapter 4
Results and discussions
As the concentration of injected protein increases from 3 to 10 mg/mL, the dynamic protein binding capacity of AA has 37 % increased, while for others modified membrane (AAAAm, AALMBAA and AAHMBAA) they have 20% increased. Although limited amounts of binding site available in all membrane adsorber. The increase of injected protein concentration apparently increases the binding capacity in each membrane adsorber. Among the membrane adsorbes, the dynamic binding capacity is not similar due to different brush structure. Regardless of injected protein concentration, membrane adsorbers grafted with functional-cross-linker have the highest capacity while membrane adsorber grafted with functional-diluent has the lowest capacity. Similar capacity pattern was observed in previous investigation (c.f. section 4.2.6).
4.5.3 Variation of protein size
Based on 10% BTC (Figure 4.48), all modified membranes had low capacity when small protein was used (lysozyme; average 42 ± 4 mg/mL), while higher capacity is obtained when bigger protein was used (BSA; average 71 ± 18 mg/mL, IgG; average~82 ± 13 mg/mL). As protein size increases from 14 kDa (lys) to 150 kDa (IgG), the capacity of AA increases from 38 to 70 mg/mL (average: 54 ± 16 mg/mL) while for AALMBAA increases capacity from 47 to 87 mg/mL (average: 68 ± 20 mg/mL), for AAHMBAA, its capacity increases from 41 to 73
mg/mL (average: 59 ± 16 mg/mL). For AAAAm, as
protein size increases from 14 kDa to 66 kDa (BSA), its capacity increases from 42 to 96 mg/mL, thereafter it becomes constant (average: 78 ± 32 mg/mL). Generally, the capacity for all modified membranes is increased with the increasing of protein sizes. More specifically, AA membrane shows the lowest capacity for all protein sizes, while AAAAm shows the highest capacity for bigger protein size.
114
10% of Initial point BTC (mg/mL)
Chapter 4
Results and discussions
110 100 90 80 70 60 50 40 30 20 10 0
AA AAAAm AALMBAA AAHMBAA
Lys (14 kDa)
BSA (66 kDa)
IgG (150 kDa)
Different type of protein Figure 4.48: Membrane adsorber capacity based on 10% of initial point breakthrough curve data.
As the protein sizes increases from 14 to 150 kDa, the dynamic protein binding capacity of AA and AALMBAA have 84 % increased, while for others modified membrane such as AAAAm, and AAHMBAA they have 133% and 79% increased respectively. The increase of protein size apparently increases the accessibility of binding site in each membrane adsorber although the grafted structure and the amounts of binding site available remained the same in all membrane adsorber. No size exclusion effect was observed.
It is interesting to observe the flexibility performance of different grafted brush under variation of protein sizes. The preceding investigation shows that the dispersion value of AAAAm for all protein is the biggest whereas other modified membranes have similar value regardless the protein size (c.f. 4.4.7). AAAAm has interesting features in this experiment since the biggest dispersion value is combined with the highest capacity of membrane. This is contradicting with previous finding that the biggest dispersion will accompany with the lowest capacity (c.f. 4.5.1 and 4.5.2). This is due to the characteristics of pH and buffer used. In this experiment, acetate buffer at pH 5 was used,
115
Chapter 4
Results and discussions
while in previous experiment HEPES at pH 7 was used. The use of different buffer and pH apparently changes the dispersion and capacity character of modified membranes.
Focusing on average lysozyme capacity for all modifies membranes, 56% lower capacity was obtained when acetate buffer at pH 5 was used compared with HEPES buffer at pH 7 (c.f. 4.5.1 and 4.5.2). Lysozyme has more positive charge at pH 5 but the carboxyl group is less dissociates at this pH, while lysozyme has less positive charge at pH 7 but the carboxyl is more dissociates. Clearly, the reduction of binding site as a result of less dissociate of carboxyl group remarkably reduces the membrane adsorber performance.
4.5.4 Modified membrane adsorber performance with lower protein excess
Further investigation of membrane adsorber performance was performed using small amount of injected protein (c.f. 3.7.1, Table 3.2). Two types of buffer at different pH were used in order to suit the pI of protein, HEPES buffer at pH 7 was used for cytochrome C and lysozyme (lysozyme A) and acetate buffer at pH 5 was used for lysozyme (lysozyme B), BSA and IgG (Figure 4.49).
As given in Figure 4.49, the averages capacities of all modified membrane adsorbers are 75 ± 10, 58 ± 11, 69 ± 8, 49 ± 13, 60 ± 8 mg/mL examined using cytochrome C, lysozyme A, lysozyme B, BSA and IgG, respectively.
116
Chapter 4
Results and discussions
Protein binding capacity (m g/m L)
100 90 80 70 AA
60
AAAAm
50
AALMBAA
40
AAHMBAA
30 20 10 0 Cytochrome c Lysozyme A Lysozyme B
BSA
IgG
Type of protein
Figure 4.49: Modified membrane protein capacity for different type of proteins.
At pH 7 (HEPES buffer), cytochrome c and lysozyme have positive net charge because their isoelectric points are higher than buffer pH. On the other hand, the carboxyl group of modified membrane which has lower pKa (pKa AA is 4.7) than pH will dissociate resulting in negative net charge. Consequently, specific binding via electrostatic attraction will be pronounced. All modified membranes have 29% higher average capacity for cytochrome c than for lysozyme. Since both proteins have approximately the same isoelectric point (c.f. 4.4.7 Table 4.9), the difference in electrostatic driving force should not be the reason. Hence, it could be due to cytochrome c has smaller size than lysozyme (cytochrome c, Mw: 12.2 kDa, lysozyme, Mw: 14 kDa) and sphere structure (lysozyme has different structure). As a result, cytochrome c can access carboxyl brush more than lysozyme leading to higher capacity.
Comparing each modified membrane, membrane modified with cross-linker have the highest capacity and membrane modified with diluent have the lowest capacity for small proteins (cytochrome c and lysozyme) (Figure 4.49). The presence of cross-linker yields network structure and as consequence more accessible binding site would be resulted. By contrast, the presence of diluent structure would increase the distance among carboxylic groups. As a result, the protein density attached on the brush would decrease. Similar 117
Chapter 4
Results and discussions
observation for the brush sensitivity is found during permeability measurements in HEPES buffer at pH 7 with different salt concentrations (c.f. 4.2.5). In addition to that, this observation is in agreement with the results obtained from inadvertent pH transient (c.f. 4.3.1).
At pH 5 (acetate buffer), on the one hand, both BSA and IgG have net charge close to neutral (see their isoelectric points, c.f. 4.4.7, Table 4.9). On the other hand the carboxyl group will slightly dissociate and has less amount net negative charge. This condition causes the specific interaction would be less pronounced. The membrane proteininteractions are probably due to hydrophobic interactions (Figure 4.49). It should be noted that at pH close to isoelectric point a protein has the highest hydrophobic character. Experiments using larger protein size show that all modified membranes have greater average capacity (19%) for IgG than for BSA. At experiment pH, IgG has more positive charge to bind with negative carboxyl brush than BSA (isoelectric point value c.f. 4.4.7, Table 4.9). Furthermore, this observation suggests that no size exclusion occurred, i.e., although IgG has bigger size compared with BSA (IgG, Mw~150 kDa, BSA, Mw~66 kDa), the capacity is still higher. This means the IgG can still access the carboxylic brush.
For big protein (IgG and BSA), membrane modified with diluent AAAAm have the highest capacity and membrane modified with high amount of cross-linker AAHMBAA have the lowest capacity (Figure 4.49). The high capacity for modified membrane containing diluent can be explained as follow: even though the diluent structure increase the distance of carboxylic group but the big size of protein used can compensate this distance, consequently high density of attached protein can be achieved. Probably, the brush length is higher than other modified membranes (c.f. section 4.2.5, permeability data). This yields the amount of protein bound on the carboxylic brush would be larger. In contrast, the presence high amount of cross-linker decreases protein capacity for these big proteins. This may be due to decreasing brush length (c.f. section 4.2.5, permeability data). Overall, these observations are supported by the previous investigations (c.f. 4.4.7 and 4.5.3).
Lysozyme binding capacity is lower when buffer at pH 7 was used rather than buffer at pH 5. This implies that the overall driving force for electrostatic attraction at pH 7 is less than at pH 5. At pH 5 the net charge of lysozyme is more positive than at pH 7 but the 118
Chapter 4
Results and discussions
amount of negative charge of carboxyl group is less. However, from the result, it is quite clear that the positive net charge of lysozyme is more dominant than reduction of functional binding site. The protein utilizes binding site more optimum at pH 5 even though the binding site is less than at pH 7. Overall, this condition is found for all modified membranes except for modified membrane with high cross-linker structure AAHMBAA. This membrane shows constant capacity for both pHs indicating the functional group in the high network structure has similarly been utilized in both pHs. Nevertheless, the capacity based on BTC analysis does not support this finding, i.e., BTC analysis shows that reduction of functional site for binding via decreasing pH is more dominant than positive net charge of lysozyme and the value obtained from BTC is much lower than the actual capacity (cf. 4.5.3). Nevertheless, to the best of author knowledge, it is difficult to correlate both results.
4.6 Protein separation - Cytochrome c and lysozyme mixture
Protein separation is the final evaluation of membrane adsorber performance in this dissertation. The attention is paid only at preliminary stage of separation. Cytochrome c and lysozyme mixtures were chosen for this investigation.
The experiments were initially done with the study of mobile phase effects using AA modified membrane and for this purpose gradient slope parameter are considered. Thereafter, study was focused on how different physical structure of brush effect (stationary phase) on the separation of protein. Modified membranes (AA, AAAAm, AALMBAA and AAHMBAA) were selected for this evaluation.
4.6.1 Separation attempt: gradient slope variation
The separation is begun with gradient slope of 2.5 M/mL, however, the protein mixture is eluted simultaneously. The separation cannot be done at such high slope and therefore, to enable separation it is necessary to decrease the gradient slope. Three different gradients were chosen for this purpose, G20 = 0.0555 M/mL, G40 = 0.0277 M/mL and G80 = 0.0139 M/mL (Figure 4.50).
119
Chapter 4
Results and discussions
Gradient Profile
% Buffer B (Buffer A + 0.5 M NaCL)
120 100 80
G20
60
G40 40
G80
20 0 0
10
20
30
40
50
Volume (ml) Figure 4.50: Profiles of new gradient slope.
Figure 4.51 shows the protein separation using gradient slope of 0.0555 M/mL. Single and mixture of protein were injected. The protein, cytochrome c and lysozyme, mixture is separated at different peak with this new gradient slope. First peak represents cytochrome c and second peak represents lysozyme and this is known by overlapping the single and mixture protein curve together.
120
Chapter 4
Results and discussions
800
UV adsorbance (m AU)
700 600
AA_G20_MixCytoLys
500
AA_G20_CytoC
400
AA_G20_Lys
300 200 100 0 7
8
9
10 11 Volume (ml)
12
13
14
Figure 4.51: Individual and mixture peak of elution curve for cytochrome c, lysozyme and mixture cytochrome c and lysozyme, at elution gradient slope is 0.0555 M/mL.
As presented in Figure 4.52, protein separation using gradient slope of 0.0277 M/mL is clearly observed. Compared to higher gradient slope (c.f. Figure 4.51) the curve becomes wider and the distant between two peaks becomes farther (Figure 4.52). Similar phenomenon is also observed for the smallest gradient slope. These results indicate that the separation performance is higher at smaller gradient slope. In addition, the resolution increases with decreasing gradient slope. Quantitative analysis is presented in Table 4.10.
121
Chapter 4
Results and discussions
600
UV adsorbance (mAU)
500
400 AA_G40_MixCytoCLys AA_G40_CytoC
300
AA_G40_Lys 200
100
0 8
9
10
11
12
13
14
15
16
17
18
Volume (ml)
Figure 4.52: Individual and mixture peak of elution curve for cytochrome c, lysozyme and mixture cytochrome c and lysozyme. at elution gradient slope 0.0277 M/mL.
Table 4.10: Effect of gradient slope variation on separation factor for mixture cytochrome c and lysozyme.
Gradient Slope (M/mL)
Separation
factor Resolution
(α) 0.0555
1.25
0.84
0.0277
1.30
0.86
0.0139
1.35
0.91
Essentially, two compounds can be separated only if separation factor is higher than 1.0 in the selected phase system. Since the data show that cytochrome c and lysozyme mixture has separation factor more than 1.0, as a result the separation of them is possible. Although the selectivity factor (α) describes the separation of band centres, it does not take into account peak widths. Another analysis of how well species have been separated is provided by measurement of the resolution (R). Baseline resolution is achieved when R = 1.5. Since the value of the resolution of cytochrome c and lysozyme mixture is less than 122
Chapter 4
Results and discussions
1.5, the baseline separation is not achieved. It is clear that as the gradient slope was decreased 50%, the separation factor and resolution increase 4% and 2.4%, respectively. Further decrease of 75% gradient slope, the separation factor and resolution increase 8% and 8.3% respectively. The speed of the salt to penetrate into the pores becomes slower as gradient slope was decreased. As a result, salt has more time to replace the protein on the brush leading to higher separation.
There are several reasons of lysozyme appeared later than cytochrome c in elution. Since the driving force for specific interaction (charged base) between protein and membrane is approximately the same for both proteins, other factor should be considered (c.f. section 4.4.7, Table 4.9). One could be a possible reason is elution behaviour is affected by protein geometry. Cytochrome c and lysozyme are two small globular proteins with very different structural and functional properties. Cytochrome c is a compact globular protein whose structure as a single particle is well established both in crystalline and solution state [151]. On the contrary, the three-dimensional structure of lysozyme consists of two domains: an α-domain with helical structure and a β-domain with predominantly βsheets, separated by the active site cleft [152]. In addition to that, measurement of hydrodynamic radius and dipole moment between cytochrome c and lysozyme under similar condition revealed that the difference between these proteins [153], cytochrome c shows both hydrodynamic radius and dipole moment with a monodomain structure remains unchanged, denoting the absence of any structural and conformational effect, while lysozyme shows the hydrodynamic radius variation and the dipole moment is inconsistent, denoting the strong present of structural and conformational effect.
4.6.2 Effect of different brush structure on protein mixture separation
Previous study on beads ion exchange chromatography showed stationary phase structure has significant role in protein separation performance [154-157]. It is interesting to know whether the same phenomena can be observed on membrane adsorber. There were also studies in membrane adsorber indicated the stationary phase is important [158]. In their study, they compared between cation and anion exchange type. This work however will
123
Chapter 4
Results and discussions
investigate stationary phase in form of grafted brush with the same functional group but has different physical structure.
Different types of modification show different separation behaviors (Figure 4.53). Modified membrane AAAAm shows the earliest and the broadest separation peak, while AA and AALMBAA membranes show later separation. The peak separation for AAHMBAA modified membrane is in between those modified membranes. This phenomenon is observed for all ranges gradient slopes (see appendix C). Gradient slope of 0.0277 M/mL was chosen as representative for further analysis (Figure 4.53). 400
UV adsorbance (mAU)
350 300 250
AA_G40 AAAAm_G40
200
AALMBAA_G40 AAHMBAA_G40
150 100 50 0 8
10
12
14
16
18
Volume (ml)
Figure 4.53: Profile of elution curve for mixture cytochrome C and lysoyzme with different modified membrane all at gradient slope G40 = 0.0277 M/mL.
Quantitative measurement shows that the highest value of separation factor belongs to AAAAm and AAHMBAA, while the lowest belongs to AALMBAA (Table 4.11). The highest resolution is found for modify membrane AAHMBAA and the lowest is for AAAAm.
124
Chapter 4
Results and discussions
Table 4.11: Effect of different brush structure on protein mixture separation.
Type of membrane
Separation factor (α)
Resolution
AA
1.30
0.86
AAAAm
1.38
0.68
AALMBAA
1.26
0.71
AAHMBAA
1.37
0.96
Although AAAAm has the longest distance between peaks but the separation of this peak is the lowest. AAHMBAA membrane shows the best combination, i.e., it shows the longest distance between peak and separation of this peak is the highest compared with other modified membranes.
The presence of diluent and cross-linker leads to spacer and network structure in both grafted brush. This structure influences the protein separation performance of membrane adsorber. Each protein has different potential charge, size and shape. The presence of spacer and network effectively enlarge the difference between those properties compared with structure which do not have them.
It should be noted that the good membrane adsorber should have high permeability, minimum dispersion, high protein binding capacity and high separation factor as well as good resolution. Overall, results show that membrane modified with AAHMBAA fit for these criteria.
125
Chapter 5: Conclusion Surface selective photo-grafting via photo-initiator entrapping method for membrane adsorber preparation was optimized by investigating several key parameters. No significant effect was observed in entrapping time variation. As the functional monomer concentration increases the degree of grafting also increases but the efficiency of protein binding reduces. Variation of UV grafting time reveals that at certain point additional time for UV irradiation produces optimum and constant results. Variation of photoinitiator concentration shows that by using 1 wt% photo-initiator produces grafted structure with high degree of grafting, good protein capacity and high permeability. Overall, standard method was achieved using 1 wt% of BP concentration with 60 minutes entrapping time and 15 minutes UV irradiation for further preparation of membrane adsorber with different grafted structure.
Different grafted structure was successfully prepared using standard method of surface selective photo-grafting via photo-initiator entrapping method. It was achieved through variation of monomer composition between functional, diluent and cross-linker. Attempt to produce membrane adsorber with approximately the same degree of grafting was possible by controlling the monomer mixture composition and ratio. Visualization via SEM and pore size distribution reveals the pore structures in dry state has minimal change after modification. Functional group signal in FTIR spectra shows the grafting was successfully done according to the ratio of monomer mixture composition prior to grafting process. Permeability at different pH and salt concentration together with protein binding investigation further confirm that different structure of functional monomer was successfully grafted. Mixture of diluent and functional monomer introduces spacers in grafted layer; up to 50% of diluent composition did not reduce protein capacity much. The membrane adsorber from this preparation shows very low permeability at high pH and low salt concentration beside very pronounced sensitivity to changes in pH and salt. Mixture of cross-linker and functional monomer introduces a network in grafted layer. This structure leads to higher protein binding capacity and increases permeability considerably and insensitivity to pH and salt increases also.
126
Chapter 5
Conclusion
Inadvertent pH transient is reliable method to determine membrane adsorber capacity; results from this experiment are systematically supported by degree of grafting and dynamic protein capacity.
System dispersion investigation using breakthrough curve shows the effect of grafting on dispersion is small when acetone is used as a tracer. Different dispersion behaviour of membrane with different grafted structure was observed at flow rate variation although no systematic pattern can be deduced. In contrast, the effect of grafting is significant by using lysozyme. Systematic different dispersion behaviour of membrane with different grafted structure was observed at flow rate variation. The dispersion effect is significant for all structures, bigger effect was observed with functional-diluent structure and smaller effect was observed with functional-cross-linker structure. Dispersion in all modified membrane reduces systematically as the lysozyme concentration increases. Modified membrane with functional-diluent structure shows consistency significant dispersion in all size of protein. For other type of structure, less significant dispersion in small protein and significant dispersion in big protein was observed. Residence time distribution data further support system dispersion investigation. No systematic pattern can be contemplated when acetone was used as tracer although different mixing behaviour of membrane with different grafted structure was observed at flow rate variation. While by using lysozyme, different mixing behaviour of empty module and unmodified PP was observed at flow rate variation. Both results indicated mixing is significant and should be considered during membrane adsorber modeling.
Protein dynamic binding capacity for most membrane adsorber is not sensitive to flow rate variation except membrane adsorber grafted with functional-diluent structure. Systematic increase of protein binding capacity was observed for all modified membranes as protein concentration and size increase. The functional-cross-linker structure has the highest capacity regardless protein concentration. The functional-diluent structure has the highest capacity for big protein size. Generally in all types of membrane adsorbers, breakthrough curve result can be used to predict the lower excess of protein capacity. In addition to buffer pH, protein isoelectric point, brush pKa; protein dynamic binding capacity are also sensitive to structure of grafted brush.
127
Chapter 5
Conclusion
Separation of cytochrome c and lysozyme mixture shows dependency on gradient slope; the separation and resolution increase as the gradient slope decrease. In addition to that, different brush structure also influences separation; functional-dilute show high separation factor but low resolution while functional and high amount cross-linker show high separation and high resolution value.
Ideal membrane adsorber in this work is membrane prepared using functional and high amount of cross-linker since it has high permeability under different pH and salt concentration; minimized dispersion, high inadvertent pH transient and protein dynamic capacity and good ability to separate protein mixture. Overall, high performance of membrane adsober could be produced from surface selective photo-grafting entrapping method via tailoring the brush structure.
Future work that could be done is the breakthrough curve data from this work could be used to model membrane adsober, since it gives information regarding how different brush structure effect membrane adsorber performance. In addition to that, preparation of membrane adsorber with different structure could be extended on hydrophilic base membrane using the same method. High anti fouling and more variation of pore size of hydrophilic membrane are attractive characters to be considered.
128
Chapter 6: References [1]
E.N. Lightfoot, J.S. Moscariello, Bioseparations, Biotechnol. Bioeng. 87 (2004), p. 259-273.
[2]
N. Labrou, Y.D. Clonis, The affinity technology in downstream processing, J. of Biotech. 36 (1994), p. 95-119.
[3]
D. McCormick, Bioseparations look ahead to the past, Pharm. Tech. 29 (2005), p. 36-44.
[4]
K. Keller, T. Friedmann, A. Boxman, The bioseparation needs for tomorrow, Trends Biotechnol. 19 (2001), p. 438-441.
[5]
P.C. Sigh, R.K. Singh, Choosing an appropriate bioseparation technique, Trends Food Sci. Technol.7 (1996), p. 49-58.
[6]
E.L. Cussler, H. Ding, “Hollow fibers” in bioseparation processses in foods (R.K. Singh, S.S.H. Rizvi, eds) Marcel Dekker, New York (1995).
[7]
T.M. Przybycien, N.S. Pujar, L.M. Steele, Alternative bioseparation operations: life beyond packed-bed chromatography, Current Opin. in Biotech. 15 (2004), p. 469-478.
[8]
K. Mondal, M.N. Gupta, The affinity concept in bioseparation: Evolving paradigms and expanding range of applications, Biomol. Eng. 23 (2006), p. 59-76.
[9]
D.K. Roper, E.N. Lightfoot, Separation of biomolecules using adsorptive membranes, J. of Chromatog. A 702 (1995), p. 3-26.
[10]
C. Charcosset, Purification of proteins by membrane chromatography,
J. of
Chem. Tech. Biotech. 71 (1998), p. 95-110.
129
Chapter 6 [11]
References
X. Zeng, E. Ruckenstein, Membrane Chromatography: Preparation and Applications to Protein Separation, Biotechnol. Prog. 15 (1999), p. 1003-1019.
[12]
E. Klein, Affinity membranes: A 10-year review, J. Membr. Sci. 179 (2000), p. 127.
[13]
R. Ghosh, Protein separation using membrane chromatography: opportunities and challenges, J. of Chromatog. A 952 (2002), p. 13-27.
[14]
H. Zou, Affinity membrane chromatography for the analysis and purification of proteins, J. Biochem. Biophys. Methods 49 (2001), p. 199-240.
[15]
C. Charcosset, Membrane process in biotechnology: An overview, Biotech. Adv. 24 (2006), p. 482-492.
[16]
M. Kaufmann, Unstable proteins: how to subject them to chromatographic separations for purification procedures.J. of Chromatogr. B 699 (1997), p. 347369.
[17]
Saiful, Z. Borneman, M. Wessling, Enzyme capturing and concentration with mixed matrix membranes adsorbers, J. Membr. Sci. 280 (2006), p. 406-417.
[18]
Sartobind® Membrane adsorber for Rapid Purification of Proteins; Product information of Sartorious AG, Göttingen, Germany, in http://www.sartorius.com
[19]
Mustang® Membrane Chromatography Starter Kits; Product information of Pall Corporations Inc., East Hills, New York, USA, in http://www.pall.com
[20]
T. Kawai, K. Saito, W. Lee, Protein binding to polymer brush, based on ionexchange, hydrophobic, and affinity interactions. J. Chromatogr. B 790 (2003), p.131-142.
130
Chapter 6 [21]
References
M. Ulbricht, H. Yang, Porous polypropylene membranes with different carboxyl polymer brush layers for reversible protein binding via surface initiated graftcopolymerization, Chem. Mater. 17 (2005), p. 2622-2631.
[22]
M. A. Teeters, Adsorptive membrane chromatography of large biomolecules, PhD Thesis. University of Wisconsin-Madison, USA (2003).
[23]
K. Saito, Charged polymer brush grafted onto porous hollow-fiber membrane improves separation and reaction in biotechnology, Sep. Sci. Technol. 37 (2002), p. 535-554.
[24]
M.R. Etzel, Layered stacks in chromatography. J. Chrom. Libr. 67 (2003), p. 213-234.
[25]
R.V. Reis, A. Zydney, Bioprocess membrane technology, J. Membr. Sci. 297 (2007), p. 16–50.
[26]
J. Thömmes, M.R. Kula, Membrane chromatography-an integrative concept in the downstream processing of proteins, Biotechnol. Prog. 11 (1995), p. 357-367.
[27]
C. Boi, Membrane adsorbers as purification tools for monoclonal antibody purification, J. of Chromatogr. B 848 (2007), p. 19–27.
[28]
R. Janzen, K.K. Unger, W. Mueller, M.T.W Hearn, Adsorption of proteins on porous and non-porous poly(ethyleneimine) and tentacle-type anion exchangers, J. Chromatogr. 522 (1990), p. 77-93.
[29]
S. Tsuneda, K. Saito, T. Sugo, K. Makuuchi, Protein adsorption characteristics of porous and tentacles anion-exchange membrane prepared by radiation-induced graft polymerisation, Radiat. Phys. Chem. 46 (1995), p. 239-245.
[30]
S-Y. Suen, M.R. Etzel, Sorption kinetics and breakthrough curves for pepsin and chymosin using pepstatin A affinity membranes, J. Chromatogr. A 686 (1994), p. 179-192. 131
Chapter 6
[31]
References
H.S. Fogler, L.F. Brown, “Analysis of Nonideal Reactors” in Elements of Chemical Reaction Engineering (H.S. Fogler ed.) Prentice-Hall Inc., New Jersey (1986).
[32]
R.W. Missen, C.A. Mims, B.A. Saville, “Non Ideal Flow” in Introduction to Chemical Reaction Engineering and Kinetics, Wiley, New York (1999).
[33]
R. Aris, On the dispersion of a solute in a fluid flowing through a tube, Proc. Roy. Soc. London Ser. A 235 (1956), p. 67-77.
[34]
H.Yang, M. Bitzer, M.R. Etzel, Analysis of protein purification using ionexchange membranes, Ind. Eng. Chem. Res. 38 (1999), p. 4044-4050.
[35]
S.-Y Suen, M.R. Etzel, A Mathematical Analysis of Affinity Membrane Bioseparations, Chem. Eng. Sci. 47 (1992), p. 1355-1364.
[36]
E. Klein, D. Yeager, R. Seshadri, U. Baurmeister, Affinity adsorption devices prepared from microporous poly(amide) hollow fibres and sheet membranes, J. Membr. Sci. 129 (1997), p. 31-46.
[37]
K.H. Gebauer, J. Thommes, M.R. Kula, Plasma protein fractionation with advanced membrane adsorbents, Biotechnol. Bioeng. 54 (1997), p. 181-189.
[38]
K.H. Gebauer, J. Thommes, M.R. Kula, Breakthrough performance of highcapacity membrane adsorbers in protein chromatography, Chem. Eng. Sci. 52 (1997), p. 405-419.
[39]
R.V. Reis, A. Zydney, Membrane separations in biotechnology, Curr. Opin. Biotechnol. 12 (2001), p. 208-211.
[40]
R. Ghosh, T.Wong, Effect of module design on the efficiency of membrane chromatographic separation processes, J. Membr. Sci. 281 (2006), p. 532–540.
132
Chapter 6 [41]
References
Product specific information sheet: Complete Housing For CIM® Disks-POM type (2008) in http://www.biaseparations.com.
[42]
R. Ghosh, Membrane adsorption module, Canada
Patent Application,
PCT/CA2005/000468.
[43]
F.T. Sarfert, M.R. Etzel, Mass transfer limitations in protein separations using ion-exchange membranes, J. Chromatogr. A 764 (1997), p. 3-20.
[44]
I.A. Adisaputro, M.R. Etzel, Y.-J. Wu, Strong cation and anion exchange membranes with beads for protein isolation from whey, J. Liq. Chrom. & Rel. Technol. 19 (1996), p. 1437-1450.
[45]
S. Brandt, R.A. Goffe, S. Kessler, J.L. O’Connor, S.E. Zale, Membrane-based affinity technology for commercial scale purifications, Biotechnology 6 (1988), p. 779–782.
[46]
T.C. Beeskow, W. Kusharyoto, F.B. Anspach, K.H. Kroner and W.D. Deckwer, Surface modification of microporous polyamide membranes with hydroxyethyl cellulose and their application as affinity membrane, J. Chromatogr. A 715 (1995), p. 49–65.
[47]
A.M. Mika, R.F. Childs, J.M. Dickson, B.E. McCarry and D.R. Gagnon, Porous, polyelectrolyte-filled membranes: effect of cross-linking on flux and separation, J. Membr. Sci. 135 (1997), p. 81–92.
[48]
D.M. He, M. Ulbricht, Preparation and characterization of porous anion-exchange membrane adsorbers with high protein-binding capacity, J. Membr. Sci. 315 (2008), p. 239–259.
[49]
M. Ulbricht, Advanced functional polymer membranes, Polymer 47 (2006), p. 2217-2262.
133
Chapter 6 [50]
References
D.E. Bergbreiter, Polyethylene surface chemistry, Prog. Polym. Sci. 19 (1994), p. 529-560.
[51]
L.S. Penn, H. Wang, Chemical modification of polymer surfaces: a review, Polym. Adv. Technol. 5 (1994), p. 809-817.
[52]
J.H. Lee, H.B. Lee, J.D. Andrade, Blood compatibility of polyethylene oxide surfaces, Pro. Polym. Sci. 20 (1995), p. 1043-1079.
[53]
Y. Uyama, K. Kato, Y. Ikada, Surface modification of polymers by grafting, Adv. Polym. Sci. 137 (1998), p. 1-39.
[54]
B. Zhao, W.J. Brittain, Polymer brushes: surface-immobilized macromolecules, Pro. Polym. Sci. 25 (2000), p. 677-710.
[55]
K. Kato, E. Uchida, E. Kang, T. Uyama, Y. Ikada, Polymer surface with graft chains, Progr. Polym. Sci. 28 (2003), p. 209-259.
[56]
J. Jagur-Grodzinski, Heterogeneous modifications of polymers: matrix and surface reactions, Wiley, New York (1997).
[57]
T. Heinze, T. Liebert, Unconventional methods in cellulose functionalization, Prog Polym. Sci. 26 (2001), p. 1689-1762.
[58]
T. Liebert, S. Hornig, S. Hesse, T. Heinze, Microscopic Visualization of Nanostructures of Cellulose Derivatives, Macromol. Symp. 223 (2005), p. 253266.
[59]
N.S. Allen, M. Edge, Fundamentals of polymer degradation and stabilization, Kluwer Academic Publishers, Dordrecht (1992).
[60]
M.M. Nasef, E.S.A. Hegazy, Preparation and applications of ion exchange membranes by radiation-induced graft copolymerization of polar monomers onto non-polar films, Prog. Polym. Sci. 29 (2004), p. 499-561. 134
Chapter 6 [61]
References
F.S. Denes, S. Manolache, Macromolecular plasma-chemistry: an emerging field of polymer science, Prog. Polym. Sci. 29 (2004), p. 815-885.
[62]
M. Ulbricht, G. Belfort, Surface modification of ultrafiltration membranes by low temperature plasma. I. Treatment of polyacrylonitrile, J. Appl. Polym. Sci. 56 (1995), p. 325-343.
[63]
P.W. Kramer, Y.S. Yeh, H. Yasuda, Low temperature plasma for the preparation of separation membranes, J. Memb.r Sci. 46 (1989), p. 1-28.
[64]
Q. Zhang, C.R. Wang, Y. Babukutty, T. Ohyama, M. Kogoma, M. Kodama, Biocompatibility evaluation of ePTFE membrane modified with PEG in atmospheric pressure glow discharge, J. Biomed. Mater. Res. 60 (2002), p. 502509.
[65]
V. Thom, K. Jankova, M. Ulbricht, J. Kops,G. Jonsson, Synthesis of photoreactive α-4-azidobenzoyl-ω-methoxy-poly(ethylene glycol)s and their endon photo-grafting onto polysulfone ultrafiltration membranes, Macromol. Chem. Phys. 199 (1998), p. 2723-2729.
[66]
Z.M. Liu, Z.K. Xu, L.S. Wan, J. Wu, M. Ulbricht, Surface modification of polypropylene microfiltration membranes by the immobilization of poly(N-vinyl2-pyrrolidone): a facile plasma approach, J. Membr. Sci. 249 (2005), p. 21-31.
[67]
S.M.C. Ritchie, L.G. Bachas, T. Olin, S.K. Sidkar, D. Bhattacharyya, Surface Modification of Silica- and Cellulose-Based Microfiltration Membranes with Functional Polyamino Acids for Heavy Metal Sorption, Langmuir 15 (1999), p. 6346-6357.
[68]
L.R. Castilho, W.D. Deckwer, F.B. Anspach, Influence of matrix activation and polymer coating on the purification of human IgG with protein A affinity membranes, J. Membr. Sci. 172 (2000), p. 269-277.
135
Chapter 6 [69]
References
V. Thom, G. Altankov, T. Groth, K. Jankova, G. Jonsson, M. Ulbricht, Optimizing Cell-Surface Interactions by Photografting of Poly(ethylene glycol), Langmuir 16 (2000), p. 2756-2765.
[70]
M. Ulbricht, G. Belfort, Surface modification of ultrafiltration membranes by low temperature plasma II. Graft polymerization onto polyacrylonitrile and polysulfone, J. Membr. Sci. 111 (1996), p. 193-215.
[71]
R.Q. Kou, Z.K. Xu, H.T. Deng, Z.M. Liu, P. Seta, Y.Y. Xu, Surface modification of
microporous
polypropylene
membranes
by
plasma-induced
graft
polymerization of α-allyl glucoside, Langmuir 19 (2003), p. 6869-6875.
[72]
H. Yamagishi, J. Crivello, G. Belfort, Development of a novel photochemical technique for modifying poly(arylsulfone) ultrafiltration membranes, J. Membr. Sci. 105 (1995), p. 237-247.
[73]
J. Pieracci, D.W. Wood, J. Crivello, G. Belfort, UV-assisted graft polymerization of N-vinyl-2-pyrrolidinone onto poly(ether sulfone) ultrafiltration membranes: Comparison of dip versus immersion modification techniques, Chem. Mater. 12 (2000), p. 2123-2133.
[74]
J. Pieracci, D.W. Wood, G. Belfort, UV-assisted graft polymerization of N-vinyl2-pyrrolidinone conto poly(ether sulfone) ultrafiltration membranes using selective UV wavelengths, Chem. Mater. 14 (2002), p. 256-265.
[75]
M. Taniguchi, J. Pieracci, W.A. Samsonoff, G. Belfort, UV-assisted graft polymerization of synthetic membranes: Mechanistic studies, Chem. Mater. 15 (2003), p. 3805-3812.
[76]
M. Taniguchi, G. Belfort, Low protein fouling synthetic membranes by UVassisted surface grafting modification: Varying monomer type, J. Membr. Sci. 231 (2004), p. 147-157.
136
Chapter 6 [77]
References
C.H. Bamford, K.G. Al-Lamee, Polymer surface functionalisation and grafting by a simple and inexpensive method, Macromol. Rapid Commun. 15 (1994), p. 379384.
[78]
C.H. Bamford, K.G. Al-Lamee, Studies in polymer surface modification and grafting for biomedical uses: 2. Application to arterial blood filters and oxygenators, Polymer 37 (1996), p. 4885-4889.
[79]
D.H. Garg, W. Lenk, S. Berwald, K. Lunkwitz, F. Simon, K.J. Eichhorn, Hydrophilization of microporous polypropylene celgard® membranes by the chemical modification technique, J. Appl. Polym. Sci. 60 (1996), p. 2087-2104.
[80]
S. Belfer, Y. Purinson, R. Fainshtein, Y. Radchenko, Surface modification of commercial composite polyamide reverse osmosis membranes, J. Membr. Sci. 139 (1998), p. 175-181.
[81]
V. Freger, J. Gilron, S. Belfer, TFC polyamide membranes modified by grafting of hydrophilic polymers: An FT-IR/AFM/TEM study, J. Membr. Sci. 209 (2002), p. 283-292.
[82]
R.S. Faibish, Y. Cohen, Fouling-resistant ceramic-supported polymer membranes for ultrafiltration of oil-in-water microemulsions, J. Membr. Sci. 185 (2001), p. 129-143.
[83]
C. Geismann, M. Ulbricht, Photoreactive functionalization of poly(ethylene terephthalate) track-etched pore surfaces with "smart" polymer systems, Macromol. Chem. Phys. 206 (2005), p. 268-281.
[84]
M. Ulbricht, A. Oechel, C. Lehmann, G. Tomaschewski, H.G. Hicke, Gas-phase photoinduced graft polymerization of acrylic acid onto polyacrylonitrile ultrafiltration membranes, J. Appl. Polym. Sci. 55 (1995), p. 1707-1723.
137
Chapter 6 [85]
References
M. Ulbricht, H. Matuschewski, A. Oechel, H.G. Hicke, Photo-induced graft polymerization surface modifications for the preparation of hydrophilic and lowprotein-adsorbing ultrafiltration membranes, J. Membr. Sci. 115 (1996), p. 31-47.
[86]
M. Ulbricht, M. Riedel, U. Marx, Novel photochemical surface functionalization of polysulfone ultrafiltration membranes for covalent immobilization of biomolecules, J. Membr. Sci. 120 (1996), p. 239-259.
[87]
M. Ulbricht,
Photograft-polymer-modified
microporous
membranes
with
environment-sensitive permeabilities, React. Funct. Polym. 31 (1996), p. 165-177.
[88]
M. Ulbricht, K. Richau, H. Kamusewitz, Chemically and morphologically defined ultrafiltration membrane surfaces prepared by heterogeneous photo-initiated graft polymerization, Colloids Surf. A 138 (1998), p. 353-366.
[89]
M. Ulbricht, M. Riedel, Ultrafiltration membrane surfaces with grafted polymer 'tentacles': Preparation, characterization and application for covalent protein binding, Biomaterials 19 (1998), p. 1229-1237.
[90]
S.A. Piletsky, H. Matuschewski, U. Schedler, A. Wilpert, E.V. Piletskaya, T.A. Thiele, Surface functionalization of porous polypropylene membranes with molecularly imprinted polymers by photograft copolymerization in water, Macromolecules 33 (2000), p. 3092-3098.
[91]
D.M. He, M. Ulbricht, Surface-selective photo-grafting on porous polymer membranes via a synergist immobilization method, J. Mater. Chem. 16 (2006), p. 1860 – 1868.
[92]
T. Peng, Y.L. Cheng, pH-responsive permeability of PE-g-PMAA membranes, J. Appl. Polym. Sci.76 (2000), p. 778-786.
[93]
Z.K. Xu, J.L. Wang, L.Q. Shen, D.F. Men, Y.Y. Xu, Microporous polypropylene hollow fiber membrane. Part I. Surface modification by the graft polymerization of acrylic acid, J. Membr. Sci. 196 (2002), p. 221-229. 138
Chapter 6
[94]
References
B. Yang, W.T. Yang, Photografting Modification of PET Nucleopore Membranes, J. Macromol. Sci. Pure A 40 (2003), p. 309-320.
[95]
S.K. Tripathy, J. Kumar, H.S. Nalwa, “Preface” in Handbook of polyelectrolytes and their applications (S.K. Tripathy, J. Kumar, H.S. Nalwa Eds) American Scientific Publishers, California (2002).
[96]
M. Biesalski, J. Rühe, R. Kügler, W. Knoll, “Polyelectrolytes at Solid Surfaces: Multilayers and brushes” in Handbook of polyelectrolytes and their applications (S.K. Tripathy, J. Kumar, H.S. Nalwa Eds) American Scientific Publishers, California (2002).
[97]
A. Wittemann, B. Haupt, M. Ballauff, Adsorption of proteins on spherical polyelectrolyte brushes in aqueous solution, Phys. Chem. Chem. Phys., 5 (2003), p. 1671-1677.
[98]
T.A. Camesano, B.E. Logan, Probing bacterial electrosteric interactions using atomic force microscopy, Environ. Sci. Technol. 34 (2000), p. 3354-3362.
[99]
P.L. Hansen, J.A. Cohen, R. Podgornik, V.A. Parsegian, Osmotic Properties of Poly (Ethylene Glycols): Quantitative Features of Brush and Bulk Scaling Laws, Biophys J. 84 (2003), p. 350–355.
[100] S. Alexander, Adsorption of chain molecules with a polar head: a scaling description. J. Physique (Paris) 38 (1977), p. 983–987.
[101]
P.G. de Gennes, Polymers at an interface: a simplified view, Adv. Colloid Interface Sci. 27 (1987), p. 189–209.
[102] I. Luzinov, S. Minko,V.V. Tsukruk, Adaptive and responsive surfaces through controlled reorganization of interfacial polymers layers, Prog. Polym. Sci. 29 (2004), p. 635-698.
139
Chapter 6
References
[103] L. Breitbach, E. Hinke, E. Staude, Heterogeneous functionalizing of polysulfone membranes, Angew. Makromol. Chem. 184 (1991), p. 183-196.
[104] M.D. Guiver, P. Black, C.M. Tam, Y. Deslandes, Functionalized polysulfone membranes by heterogeneous lithiation, J. Appl. Polym. Sci. 48 (1993), p. 15971606.
[105] H.G. Hicke, P. Böhme, M. Becker, H. Schulze, M. Ulbricht, Immobilization of enzymes onto modified polyacrylonitrile membranes: Application of the acyl azide method, J. Appl. Polym. Sci. 60 (1996), p. 1147-1161.
[106]
K. Ishihara, K. Fukumoto, H. Miyazaki, N. Nakabayashi, Improvement of hemocompatibility on a cellulose dialysis membrane with a novel biomedical polymer having a phospholipid polar group, Artif. Organs 18 (1994), p. 559-564.
[107]
S. Akhtar, C. Hawes, L. Dudley, I. Reed, P. Strathford, Coatings reduce the fouling of microfiltration membranes, J. Membr. Sci. 107 (1995), p. 209-218.
[108] Z.K. Xu, Q.W. Dai, J. Wu, X.J. Huang, Q. Yang, Covalent Attachment of Phospholipid Analogous Polymers To Modify a Polymeric Membrane Surface: A Novel Approach, Langmuir 20 (2004), p. 1481-1488.
[109] E. Ostuni, R.G. Chapman, R.E. Holmlin, S. Takayama, G.M. Whitesides, A survey of structure-property relationships of surfaces that resist the adsorption of protein, Langmuir 17 (2001), p. 5605-5620.
[110] R.G. Chapman, E. Ostuni, M.N. Liang, G. Meluleni, E. Kim, L. Yan, Polymeric thin films that resist the adsorption of proteins and the adhesion of bacteria,, Langmuir 17 (2001), p. 1225-1233.
[111] H. Yang, D. Lazos, M. Ulbricht, Thin, highly cross-linked polymer layer synthesized via photoinitiated graft copolymerization on a self-assembledmonolayer-coated gold surface, J. Appl. Polym. Sci. 97 (2005), p. 158-164.
140
Chapter 6
References
[112] H. Susanto, M. Balakrishnan, M. Ulbricht, Via surface functionalizations by photograft copolymerization to low-fouling polyethersulfone-based ultrafiltration membranes, J. of Membr. Sci. 288 (2007), p.157-167.
[113] H. Susanto, M. Ulbricht, High-performance thin-layer hyrogel composite membranes for ultrafiltration of natural organic matter, Water Research 42 (2008), p. 2827-2835.
[114] N. Singh, S.M. Husson, B. Zdyrko, I. Luzinov, Surface modification of microporous PVDF membranes by ATRP, J. Membr. Sci. 262 (2005), p. 81- 90.
[115] L. Sun, J. Dai, G.L Baker, M.L Bruening, High-capacity protein-binding membranes based on polymer brushes grown in porous substrates, Chem. Mater. 18 (2006), p. 4033 – 4039.
[116] H. Borcherding, H.G. Hicke, D. Jorcke, M. Ulbricht, Affinity membranes as a tool for life science applications, Ann. N. Y. Acad. Sci. 984 (2003), p. 470-479.
[117] V. Kochkodan, W. Weigel, M. Ulbricht, Thin layer molecularly imprinted microfiltration membranes by photofunctionalization using a coated α-cleavage photoinitiator, Analyst 126 (2001), p. 803-809.
[118] F. Schneider, S. Piletsky, E. Piletska, A. Guerreiro, M. Ulbricht, Comparison of thin-layer and bulk MIPs synthesized by photoinitiated in situ crosslinking polymerization from the same reaction mixtures, J. Appl. Polym. Sci. 98 (2005), p. 362-372.
[119] S.R. Wickramasinghe, J.O. Carlson, C. Teske, J. Hubbuch, M. Ulbricht, Characterizing solute binding to macroporous ion exchange membrane adsorbers using confocal laser scanning microscopy, J. Membr. Sci. 281 (2006), p. 609-618.
[120] S. Tsuneda, H. Kagawa, K. Saito, T. Sugo, Hydrodynamic evaluation of threedimensional adsorption of protein to a polymer chain grafted onto a porous substrate, J. Colloid Interface Sci. 176 (1995), p. 95-100. 141
Chapter 6
References
[121] K. Miyoshi, K.Saito, T. Shiraishi, T. Sugo, Introduction of taurine into polymer brush grafted onto porous hollow-fiber membrane, J. Membr. Sci. 264 (2005), p. 97-103.
[122] L.J Zeman, A.L Zydney, “Characterization of MF/UF membranes” in Microfiltration and ultrafiltration: principles and applications, Marcel Dekker, New York (1996).
[123] O. Šolcová, V. Hejtmánek, H. Šnajdaufová, P. Schneider, Liquid Expulsion Permporometry–a Tool for Obtaining the Distribution of Flow-Through Pores, Part. Part. Syst. Charact. 23 (2006), p. 40–47.
[124] J. Johansen, T.D. Elmøe, Preparation of porous ceramic membranes by deposition of flame synthesized nano-particles, Journal of The Danish Ceramic Society, 9 (2007), p. 14-17.
[125] V.R. Meyer, Pitfalls and Errors of HPLC in Pictures, 2nd edition, Wiley-VCH, Weinheim (2006).
[126] Chromatography Introductory Theory in http://teaching.shu.ac.uk/hwb/chemistry/tutorials/chrom/chrom1.htm
[127] A. Podgornik, J. Vidic, J. Jandar, N. Lendero, V. Frankovic, A. Strancar, Noninvasive Methods for Characterization of Large-Volume Monolithic Chromatographic Columns, Chem. Eng. Techn. 28 (2005), p. 1435-1441.
[128] N. Lendero, J. Vidic, P. Brne, A. Podgornik, A. Strancar, Simple method for determining the amount of ion-exchange groups on chromatographic supports, J. Chromatogr. A 1065 (2005), p. 29–38.
[129] D.D. Frey, Local-Equilibrium behaviour of retained pH and ionic-strength, Biotechnol. Prog. 12 (1996), p. 65-72.
142
Chapter 6
References
[130] P.C. Wankat, Rate-Controlled Separations, Elsevier Applied Science, New York, (1990).
[131] R.C. Bates, X. Kan, D.D. Frey, High-performance chromatofocusing using linear and concave pH gradients formed with simple buffer mixtures I. Effect of buffer composition on the gradient shape, J. of Chromatogr. A 890 (2000), p. 25-36.
[132] J.S. Pérez, D. D. Frey, Behavior of the Inadvertant pH Transient Formed by a Salt Gradient in the Ion-Exchange Chromatography of Proteins, Biotechnol. Progr. 21 (2005), p. 902-910.
[133] M.R. Etzel, W.T. Riordan, Membrane chromatography: analysis of breakthrough curves and viral clearance, Biotechnol. Bioprocess 31 (2007), p. 277-296.
[134] A. P. Mar’in, M. Bonora, L. Greci, Washing out oligomeric triazinic-hindered amine from polypropylene, J. Appl. Polym. Sci. 78 (2000), p. 2158-2165.
[135] A. S. Michaels, W. R. Vieth, H. H. Alcalay, The solubility parameter of polypropylene, J. Appl. Polym. Sci. 12 (1968), p. 1621-1624.
[136] A. Bhattacharya, B.N. Misra, Grafting: A versatile means to modify polymers Techniques, factors and applications, Progr. Polym. Sci. 29 (2004), p. 767-814.
[137]
C. C. F. Blake,D. F.Koenig,G. A Mair, A. C. T. North,; D. C.Phillips, V. R. Sarma, Structure of hen egg-white lysozyme--a three-dimensional Fourier synthesis at 2 A. resolution. Nature 206 (1965), p. 757-761.
[138] H.J. Chun, S.M. Cho, Y.M. Lee, H.K. Lee, T.S. Suh, K.S. Shinn, Graft copolymerization of mixtures of acrylic acid and acrylamide onto polypropylene film, J. Appl. Polym. Sci. 72 (1999), p. 251-256.
[139] Y. Hu, M. Ulbricht, Preparation and characterization of polypropylene membranes grafted with different hydrophilic polymer architectures, Aachener Membran Kolloquium Proc. 9th (2003), P 6.4 p. 1-7. 143
Chapter 6
References
[140] J. O. Karlsson, P. Gatenholm, Surface mobility of grafted hydrogels, Macromolecules 32 (1999), p. 7594-7598.
[141] Jun Wang, Lehrstuhl Technische Chemie II, Universität Duisburg-Essen, unpublished results.
[142] M. Silberberg-Bouhnik, O. Ramon, I. Ladyshinski, S. Mizrahi, Osmotic deswelling of weakly charged poly(acrylic acid) solutions and gels, J. Polym. Sci., Poly. Phys. 33 (1995), p. 2269-2279.
[143] D.E. Bergbreiter, G. Tao, J.G Franchina, L. Sussmann, Polyvalent HydrogenBonding Functionalization of Ultrathin Hyperbranched Films on Polyethylene and Gold, Macromolecules 34 (2001), p. 3018-3023.
[144] C. Boi, S. Dimartino, G.C. Sarti, Modelling and simulation of affinity membrane adsorption, J. Chromatogr. A 1162 (2007), p. 24-33.
[145] P.G. Righetti, T. Caravaggio, Isoelectric points and molecular weights of proteins a table, J. Chromatogr. 127 (1976), p. 1-28.
[146] A. Szucs, G.D. Hitchens, J. O'M. Bockris, Ellipsometry of cytochrome c on gold surfaces: effect of 4,4′-dipyridyl disulfide, Electrochim. Acta 37 (1992), p. 403412.
[147] P.L Heider, A. Venkiteshwaran, W. Silkworth, G. Belfort, Recovery of immunoglobulins
from
bovine
serum using crossflow ultrafiltration.
Abstracts, 35th Northeast Regional Meeting of the American Chemical Society, Binghamton, NY, United States, October 5-7 (2006).
[148] N. Watanabe, T. Shirakawa, M. Iwahashil, K. Ohbu, T. Seimiya, Effect of surface charge on adsorption of bovine serum albumin as studied by ellipsometry 1. Adsorption on cationic monolayer, Colloid. Polym. Sci. 264 (1986), p. 903-908.
144
Chapter 6
References
[149] Principles of Downstream Processing in http://biotech.nhctc.edu/BT220/Section_1_7_0.html
[150] E. Delamarche, G. Sundarababu, H. Biebuyck, B. Michel, C. Gerber, H. Sigrist, H. Wolf, H. Ringsdorf, N. Xanthopoulos, H.J. Mathieu, Immobilization of antibodies on a photoactive self-assembled monolayer on gold, Langmuir 12 (1996), p. 1997-2006.
[151] R.A. Scott, A.G. Mauk, Cytochrome-c: a multidisciplinary approach. University Science Books, San Salito, CA (1996).
[152] J. A. Mc Cammon, B. R. Gelin, M. Karplus, The hinge-bending mode in lysozyme, Nature 262 (1976), p. 325–326.
[153 ] A. Bonincontro, S. Cinelli, G. Onori, A. Stravato, Dielectric Behavior of Lysozyme and Ferricytochrome-c in water/Ethylene-Glycol Solutions, Biophys J. 86 (2004), p.1118–1123.
[154] A. Staby, R.H. Jensen, M. Bensch, J. Hubbuch, D.L. Dünweber, J. Krarup, J. Nielsen, M. Lund, S. Kidal, T.B. Hansen, I.H. Jensen, Comparison of chromatographic ion-exchange resins VI. Weak anion-exchange resins, J. Chromatogr. A 1164 (2007), p. 82-94.
[155] A. Staby, M-B. Sand, R.G. Hansen, J.H. Jacobsen, L.A. Andersen, M. Gerstenberg, U.K. Bruus, I.H Jensen, Comparison of chromatographic ionexchange resins IV. Strong and weak cation-exchange resins and heparin resins, J. Chromatogr. A 1069 (2005), p. 65-77.
[156] N. Tugcu, S.S. Bae, J. A. Moore, S.M. Cramer, Stationary phase effects on the dynamic affinity of low-molecular-mass displacers, J. Chromatogr. A 954 (2002), p.127-135.
145
Chapter 6
References
[157] D. Wu, R.R Walters, Effects of stationary phase ligand density on high performance ion-exchange chromatography of proteins, J. Chromatogr.
598
(1992), p.7-13.
[158] O.W. Reif, R. Freitag, Characterization and application of strong ion-exchange membrane adsorbers as stationary phases in high-performance liquid chromatography of proteins, J. Chromatogr. A 654 (1993), p. 29-41.
146
Appendix A: System dispersion
A.1 Acetone as a tracer at different flow rate 1 0.8
UPP_Ace_05 UPP_Ace_10
0.6 C/Co
UPP_Ace_15 UPP_Ace_20
0.4
UPP_Ace_25 UPP_Ace_30
0.2 0 0
0.2
0.4
0.6
0.8
1
Volume (ml)
Figure A-1: Breakthrough curves of unmodified membrane (UPP) from acetone at different flow rate.
1 0.8
C/Co
AALMBAA_Ace_05 AALMBAA_Ace_10
0.6
AALMBAA_Ace_15 AALMBAA_Ace_20
0.4
AALMBAA_Ace_25 AALMBAA_Ace_30
0.2 0 0
0.2
0.4
0.6
0.8
1
Volume (ml)
Figure A-2: Breakthrough curves of AALMBAA modified membrane from acetone at different flow rate.
147
Appendix A
System dispersion
1
0.8 CIM_Ace_25 UPP_Ace_25
0.6 C/Co
AA_Ace_25 AAAAm_Ace_25 AALMBAA_Ace_25
0.4
AAHMBAA_Ace_25
0.2
0 0
0.2
0.4
0.6
0.8
1
Volume (ml)
Figure A-3: Breakthrough curves of CIM , unmodified membrane (UPP) and modified membranes from acetone at 2.5 ml/min flow rate.
A.2 Lysozyme as a tracer
A.2.1 Variation of flow rate
1
0.8 UPP_Lys_05 0.6 C/Co
UPP_Lys_10 UPP_Lys_15 UPP_Lys_20
0.4
UPP_Lys_25 UPP_Lys_30 0.2
0 0
0.5
1
1.5
2
2.5
3
Volume (ml)
Figure A-4: Breakthrough curves for UPP from lysozyme at different flow rate.
148
Appendix A
System dispersion
1
0.8
C/Co
0.6 AA_Lys_05 AA_Lys_10 AA_Lys_15
0.4
AA_Lys_20 0.2
0 0
0.5
1
1.5
2
2.5
3
Volume (ml)
Figure A-5: Breakthrough curves for AA modified membrane from lysozyme at different flow rate.
1
C/Co
0.8
AALMBAA_Lys_05
0.6
AALMBAA_Lys_10 0.4 AALMBAA_Lys_15 0.2
AALMBAA_Lys_20
0 0
0.5
1
1.5
2
2.5
3
Volume (ml)
Figure A-6: Breakthrough curves of AALMBAA modified membrane from lysozyme at different flow rates.
149
Appendix A
System dispersion
1
C/Co
0.8
CIM_Lys_05 UPP_Lys_05
0.6
AA_Lys_05 AAAAm_Lys_05
0.4
AALMBAA_Lys_05 AAHMBAA_Lys_05
0.2 0 0
0.5
1
1.5
2
2.5
3
Volume (ml)
Figure A-7: Breakthrough curves of CIM, UPP and modified membranes from lysozyme at 0.5 ml/min flow rate.
A.2.2 Variation of concentration
1
C/Co
0.8 0.6
AA_Lys3_10 AA_Lys5_10
0.4
AA_Lys10_10
0.2 0 0
0.5
1
1.5
2
2.5
3
3.5
4
Volume (ml)
Figure A-8: Breakthrough curves of AA modified membrane from different concentration of lysozme.
150
Appendix A
System dispersion
1
C/Co
0.8 0.6
AAAAm_Lys3_10 AAAAm_Lys5_10 AAAAm_Lys10_10
0.4 0.2 0 0
0.5
1
1.5
2
2.5
3
3.5
4
Volume (ml)
Figure A-9: Breakthrough curves of AAAAm modified membrane from different concentration of lysozme.
1 0.8
C/Co
AAHMBAA_Lys3_10 0.6 AAHMBAA_Lys5_10 0.4 AAHMBAA_Lys10_10 0.2 0 0
0.5
1
1.5
2
2.5
3
3.5
4
Volume (ml)
Figure A-10: Breakthrough curves of AAHMBAA modified membrane from different concentration of lysozme.
151
Appendix A
System dispersion
1
0.8 CIM_Lys3_10
C/Co
0.6
UPP_Lys3_10 AA_Lys3_10
0.4
AAAAm_Lys3_10 AALMBAA_Lys3_10 AAHMBAA_Lys3_10
0.2
0 0
1
2
3
4
5
Volume (ml)
Figure A-11:Breakthrough curve of CIM, UPP and modified membranes from lysozyme with 3 mg/ml concentration.
1
0.8
C/Co
CIM_Lys10_10
0.6
UPP_Lys10_10 AA_Lys10_10 AAAAm_Lys10_10
0.4
AALMBAA_Lys10_10 AAHMBAA_Lys10_10
0.2
0 0
0.2
0.4
0.6
0.8
1
Volume (ml)
Figure A-12:Breakthrough curve of CIM, UPP and modified membranes from lysozyme with 10 mg/ml concentration.
152
Appendix A
System dispersion
A.2.3 Variation of protein size (Lysozyme, BSA, IgG)
1
C/Co
0.8 AA_Lys_10
0.6
AA_BSA_10 0.4
AA_IgG_10
0.2 0 0
0.5
1
1.5
2
2.5
3
Volume (ml)
Figure A-13: Breakthrough curves of AA from different size of proteins.
1
C/Co
0.8 0.6
AAAAm_Lys_10 AAAAm_BSA_10
0.4
AAAAm_IgG_10
0.2 0 0
0.5
1
1.5
2
2.5
3
Volume (ml)
Figure A-14: Breakthrough curves of AAAAm from different size of proteins.
153
Appendix A
System dispersion
1
C/Co
0.8 AAHMBAA_Lys_10
0.6
AAHMBAA_BSA_10 0.4
AAHMBAA_IgG_10
0.2 0 0
0.5
1
1.5
2
2.5
3
Volume (ml)
Figure A-15: Breakthrough curves of AAHMBAA from different size of proteins.
1 0.8
CIM_IgG_10
C/Co
UPP_IgG_10
0.6
AA_IgG_10 AAAAm_IgG_10
0.4
AALMBAA_IgG_10 AAHMBAA_IgG_10
0.2 0 0
0.5
1
1.5
2
2.5
3
3.5
4
Volume (ml)
Figure A-16: Breakthrough curves of CIM, UPP and modified membranes from big protein (IgG: 150 kDa, Acetate buffer, pH 5).
154
Appendix B- Residence time distribution (RTD) analysis B.1 Acetone as a tracer Residence Time Distribution (min -1)
20 18 16 14
UPP_05 UPP_10
12
UPP_15
10
UPP_20
8
UPP_25 UPP_30
6 4 2 0 0.0
0.5
1.0
1.5
2.0
Time (min)
Figure B-1: RTD curve of UPP at different flow rates.
Residence Time Distribution (min -1)
30
25
AA_05
20
AA_10 AA_15
15
AA_20 AA_25
10
AA_30
5
0 0.0
0.5
1.0
1.5
2.0
Time (min)
Figure B-2: RTD curve of AA at different flow rates.
155
Appendix B
Residence time distribution (RTD) analysis
18
Residence Time Distribution (min -1)
16 14 AAAAm_05
12
AAAAm_10 10
AAAAm_15 AAAAm_20
8
AAAAm_25 6
AAAAm_30
4 2 0 0.0
0.5
1.0
1.5
2.0
Time (min)
Figure B-3: RTD curve of AAAAm at different flow rates.
18
Residence Time Distribution (min -1)
16 14 AALMBAA_05
12
AALMBAA_10 10
AALMBAA_15 AALMBAA_20
8
AALMBAA_25 6
AALMBAA_30
4 2 0 0.0
0.5
1.0
1.5
2.0
Time (min)
Figure B-4: RTD curve of AALMBAA at different flow rates.
156
Appendix B
Residence time distribution (RTD) analysis
Residence Time Distribution (min -1)
30
25
AAHMBAA_05
20
AAHMBAA_10 AAHMBAA_15
15
AAHMBAA_20 AAHMBAA_25
10
AAHMBAA_30
5
0 0.0
0.5
1.0
1.5
2.0
Time (min)
Figure B-5: RTD curve of AAHMBAA at different flow rates.
5
Residence Time Distribution (min -1)
4.5 4 3.5
CIM_05 UPP_05
3
AA_05
2.5
AAAAm_05
2
AALMBAA_05 AAHMBAA_05
1.5 1 0.5 0 0.0
0.5
1.0
1.5
2.0
Time (min)
Figure B-6: RTD curves of CIM empty module, unmodified PP and modified membranes (AA, AAAAm, AALMBAA and AAHMBAA) at flow rate of 0.5 mL/min.
157
Appendix B
Residence time distribution (RTD) analysis
10
Residence Time Distribution (min -1)
9 8 7
CIM_10
6
UPP_10 AA_10
5
AAAAm_10
4
AALMBAA_10 AAHMBAA_10
3 2 1 0 0.0
0.2
0.4
0.6
0.8
1.0
Time (min)
Figure B-7: RTD curves of CIM empty module, unmodified PP and modified membranes (AA, AAAAm, AALMBAA and AAHMBAA) at flow rate of 1.0 mL/min.
Residence Time Distribution (min -1)
12
10
CIM_15
8
UPP_15 AA_15
6
AAAAm_15 AALMBAA_15
4
AAHMBAA_15
2
0 0.0
0.1
0.2
0.3
0.4
0.5
0.6
Time (min)
Figure B-8: RTD curves of CIM empty module, unmodified PP and modified membranes (AA, AAAAm, AALMBAA and AAHMBAA) at flow rate of 1.5 mL/min.
158
Appendix B
Residence time distribution (RTD) analysis
18
Residence Time Distribution (min -1)
16 14 CIM_25
12
UPP_25 10
AA_25 AAAAm_25
8
AALMBAA_25 6
AAHMBAA_25
4 2 0 0.0
0.1
0.1
0.2
0.2
0.3
0.3
0.4
0.4
Time (min)
Figure B-9: RTD curves of CIM empty module, unmodified PP and modified membranes (AA, AAAAm, AALMBAA and AAHMBAA) at flow rate of 2.5 mL/min.
Residence Time Distribution (min -1)
30
25
CIM_30
20
UPP_30 AA_30
15
AAAAm_30 AALMBAA_30
10
AAHMBAA_30
5
0 0.0
0.1
0.1
0.2
0.2
0.3
0.3
0.4
Time (min)
Figure B-10: RTD curves of CIM empty module, unmodified PP and modified membranes (AA, AAAAm, AALMBAA and AAHMBAA) at flow rate of 3.0 mL/min.
159
Appendix B
Residence time distribution (RTD) analysis
B.2 Lysozyme as a tracer 18
Residence Time Distribution (min -1)
16 14 12
UPP_05 UPP_10
10
UPP_15 UPP_20
8
UPP_25 6
UPP_30
4 2 0 0.0
0.2
0.4
0.6
0.8
1.0
Time (min)
Figure B-11: RTD curve of unmodified PP at different flow rate.
Residence Time Distribution (min -1)
3
2.5
2 CIM_05
1.5
UPP_05
1
0.5
0 0.0
0.5
1.0
1.5
2.0
2.5
Time (min)
Figure B-12: RTD curve of CIM empty module and unmodified PP membrane at flow rate of 0.5 mL/min.
160
Appendix B
Residence time distribution (RTD) analysis
Residence Time Distribution (min -1)
7 6 5 4
CIM_10 UPP_10
3 2 1 0 0.0
0.2
0.4
0.6
0.8
1.0
1.2
Time (min)
Figure B-13: RTD curve of CIM empty module and unmodified PP membrane at flow rate of 1.0 mL/min.
Residence Time Distribution (min -1)
12
10
8 CIM_20
6
UPP_20
4
2
0 0.0
0.1
0.2
0.3
0.4
0.5
Time (min)
Figure B-14: RTD curve of CIM empty module and unmodified PP membrane at flow rate of 2.5 mL/min.
161
Appendix B
Residence time distribution (RTD) analysis
Residence Time Distribution (min -1)
16 14 12 10
CIM_25 UPP_25
8 6 4 2 0 0.0
0.1
0.2
0.3
0.4
0.5
Time (min)
Figure B-15: RTD curve of CIM empty module and unmodified PP membrane at flow rate of 2.5 mL/min.
20
Residence Time Distribution (min -1)
18 16 14 12 CIM_30
10
UPP_30
8 6 4 2 0 0.0
0.1
0.2
0.3
0.4
0.5
Time (min)
Figure B-16: RTD curve of CIM empty module and unmodified PP membrane at flow rate of 3.0 mL/min.
162
Appendix C: Protein separation - Cytochrome c and lysozyme mixture protein separation data
C.1 Separation attempt: gradient slope variation and effect of different brush structure on separation 600
UV adsorbance (mAU)
500
400 AA_G20 AAAAm_G20
300
AALMBAA_G20 AAHMBAA_G20
200
100
0 7
8
9
10
11
12
13
Volume (ml)
Figure C-1: Profile of elution curve for mixture cytochrome c and lysoyzme with different modified membrane all at gradient slope G20 = 0.0555M/mL.
300
UV adsorbance (mAU)
250
200 G80_AA G80_AAAAm
150
G80_AALMBAA G80_AAHMBAA
100
50
0 10
12
14
16
18
20
22
24
26
Volume (ml)
Figure C-2: Profile of elution curve for mixture cytochrome c and lysoyzme with different modified membrane all at gradient slope G80 = 0.0139 M/mL.
163
Appendix C
Protein separation
Table C-1: The effects of AA brush structure on separation factor and resolution of mixture cytochrome c and lysozyme at different gradient slope.
Gradient
Retention Retention Width Width Retention Retention Separation Resolution
Slope
time 1
time 2
1
2
factor
1 factor 2
(M/mL)
(min)
(min)
(min)
(min)
(K1)
(K2)
21.57
4.5
2
1.35
1.69
1.25
0.84
0.0555
18.85
factor (α)
0.0277
23.91
28.63
7.5
3.5
2.01
2.60
1.30
0.86
0.0139
32.67
41.29
12.5
6.5
3.08
4.15
1.35
0.91
Table C-2: The effects of AAAAm brush structure on separation factor and resolution of mixture cytochrome c and lysozyme at different gradient slope.
Gradient
Retention Retention Width Width Retention Retention Separation Resolution
Slope
time 1
time 2
1
2
factor
1 factor 2
(M/mL)
(min)
(min)
(min)
(min)
(K1)
(K2)
0.0555
17.65
20.76
6
3.8
1.20
1.59
1.32
0.63
0.0277
21.93
27.28
9.9
5.8
1.73
2.40
1.39
0.68
0.0139
29.26
38.8
17
10.9
2.67
3.86
1.45
0.68
factor (α)
Table C-3: The effects of AALMBAA brush structure on separation factor and resolution of mixture cytochrome c and lysozyme at different gradient slope.
Gradient
Retention Retention Width Width Retention Retention Separation Resolution
Slope
time 1
time 2
1
2
factor
1 factor 2
(M/mL)
(min)
(min)
(min)
(min)
(K1)
(K2)
0.0555
19.32
21.7
5.6
2.5
1.42
1.72
1.21
0.59
0.0277
24.70
29.05
8.2
4.1
2.10
2.64
1.26
0.71
0.0139
33.46
42.08
12
6.3
3.20
4.23
1.34
0.94
factor (α)
164
Appendix C
Protein separation
Table C-4: The effects of AAHMBAA brush structure on separation factor and resolution of mixture cytochrome c and lysozyme at different gradient slope.
Gradient
Retention Retention Width Width Retention Retention Separation Resolution
Slope
time 1
time 2
1
2
factor
1 factor 2
(M/mL)
(min)
(min)
(min)
(min)
(K1)
(K2)
0.0555
18.16
21.32
4.6
2.2
1.26
1.66
1.31
0.93
0.0277
22.80
28.34
8
3.6
1.85
2.55
1.37
0.96
0.0139
30.61
40.98
15
7
2.84
4.13
1.46
0.94
factor (α)
165
Appendix D
List of award, papers, conferences and additional training during doctoral study
Award:
The best prepared manuscript in International Membrane Science and Technology Conference, IMSTEC 07, 5-9th November 2007, Sydney, Australia for the paper with title: Structure variations of the grafted functional polymer brush enhance membrane adsorber performance.
Paper in journal (Peer-Reviewed):
(1) A.H.M. Yusof, M. Ulbricht, Structure variations of the grafted functional polymer brush enhance membrane adsorber performance, submitted to Desalination (2008).
(2) A.H.M. Yusof, M. Ulbricht, Polypropylene-based membrane adsorbers via photoinitiated graft copolymerization: Optimizing separation performance by preparation conditions, J. Membr. Sci. 311 (2008), p. 294-305.
(3) A.H.M. Yusof, M. Ulbricht, Effects of photo-initiation and monomer composition onto performance of graft-copolymer based membrane adsorbers, Desalination, 200 (2006), p. 462-463.
Paper in proceedings:
(1) A.H.M. Yusof, M. Ulbricht, Entrapping method surface modification for preparation of membrane adsorber. Proc. of the 1st International Conference on Natural Resources Engineering & Technology 2006, 24-25th July 2006, Putrajaya, Malaysia, 218-225.
(2) A.H.M. Yusof, M. Ulbricht, Porous polypropylene membrane with grafted cationexchange layers for protein separation. Aachener Membran Kolloqium Proc. 10th (2005) 379-386.
166
Appendix D
List of award, papers and conferences
Conferences:
(1)
Euromembrane 2004, 28th Sept- 1st Oct. 2004 , Hamburg, Germany.
(2)
Aachen
Membrane
Colloquium
(10th)
16–17th
March
2005,
Aachen,
Germany. Poster presentation, title: Porous polypropylene membranes with grafted cation-exchange polymer layers for protein separation.
(3)
Engineering with Membranes: Medical and Biological Applications 15-18th May, 2005
Camogli,
Italy. Poster
presentation,
title:
Weak
cation-exchange
chromatography membranes with grafted polymer layers for protein separation.
(4)
International Conference on Natural Resources Engineering & Technology 2006, 24-25th July 2006, Putrajaya, Malaysia. Oral presentation, paper title: Entrapping method surface modification for preparation of membrane adsorber.
(5)
Euromembrane
2006,
24–28th
Sept.
Taormina
(Messina)
Italy. Poster
presentation, title: Effects of photo-initiation and monomer composition onto performance of graft-copolymer based membrane adsorbers.
(6)
International Membrane Science and Technology Conference, IMSTEC 07, 5-9th November 2007, Sydney, Australia. Oral presentation, paper title: Structure variations of the grafted functional polymer brush enhance membrane adsorber performance.
Trainings:
(1)
Network Young Membrains 7, 22-24th June 2005, Enschede, The Netherlands. Oral presentation, paper title: The effect of photo-initiator concentration in photografting process onto final performance of porous weak cation exchange membrane adsorbers.
(2)
Comsol Multiphysics simulation training, 7-9th May 2007, Delft, The Netherlands. 167
Appendix D
(3)
List of award, papers and conferences
European BioPerspective 30th May - 1st June 2007, Cologne, Germany. Poster presentation, title: Tailoring grafted functional layers provides better control of membrane adsorber performance.
168
List of abbreviations and symbols
Appendix E Curriculum Vitea
Full Name: Abdul Halim Bin Mohd Yusof Date of birth: 19th of June 1980 Place of birth: Melaka, Malaysia Education: 2003-2008
University of Duisburg-Essen (UDE), ESSEN
GERMANY
Dr. rer. nat. (Membrane Chromatography research)
2001 – 2002
University of Manchester Institute of Science and Technology (UMIST), MANCHESTER
UNITED KINGDOM
MSc. in Biotechnology
1998 - 2001
University of Technology Malaysia (UTM), SKUDAI JOHOR
MALAYSIA
B. Eng. Chemical-Bioprocess
169