Ionics (2014) 20:389–397 DOI 10.1007/s11581-013-0988-9
ORIGINAL PAPER
Preparation and characterization of sodium binary system (NaI–Na3PO4) inorganic solid electrolyte A. H. Ahmad & N. Hassan & M. A. Abrani
Received: 3 May 2013 / Revised: 18 July 2013 / Accepted: 18 August 2013 / Published online: 11 September 2013 # Springer-Verlag Berlin Heidelberg 2013
Abstract New binary inorganic salt such as sodium iodide (NaI)–sodium phosphate (Na3PO4) has a great potential to be used as a solid electrolyte, and this solid electrolyte system exhibits high ionic conductivity up to 10−4 S cm−1. The solid electrolyte compounds were prepared by mechanical milling followed by pelletizing and sintering at low temperature. The electrical conductivity study was carried out as a function of NaI concentration by impedance spectroscopy technique and the maximum conductivity of (1.02±0.19)×10−4 S cm−1 at room temperature was obtained for the composition 0.50 NaI:0.50 Na3PO4. The increase in conductivity is probably due to the increase in number of mobile charge carriers through the conducting pathway provided by tetrahedral structures of Na3PO4. The presence of P–O and PO43− bands was detected by the infrared technique Fourier transform infrared spectroscopy had been shifted indicating changes in polyhedral structure which in turn led to the formation of conducting channel by corner sharing or through edges. The mobility of the charge carriers in the various compositions of the binary system was investigated by using 23Na magic angle spinning solid-state nuclear magnetic resonance. The narrowing of the line width 23 Na spectra in the optimum composition of the binary NaI– Na3PO4 system can be assigned to Na population with higher ion mobility. X-ray diffraction technique revealed that the This paper was presented at the International Conference of Functional Materials & Devices 2013 in Penang, Malaysia. A. H. Ahmad : N. Hassan : M. A. Abrani Faculty of Applied Sciences, Universiti Teknologi MARA, 40450 Shah Alam, Selangor D.E., Malaysia N. Hassan e-mail:
[email protected] M. A. Abrani e-mail:
[email protected] A. H. Ahmad (*) : N. Hassan Institute of Science, Universiti Teknologi MARA, 40450 Shah Alam, Selangor D.E., Malaysia e-mail:
[email protected]
addition of NaI resulted in reducing the crystallinity of the samples. Field emission scanning electron microscopy micrographs revealed finer microstructure of the milling samples with grains growth formation and densification upon sintering. Keywords Sodium solid electrolyte . Ionic conductivity . Impedance spectroscopy . Solid-state nuclear magnetic resonance . Fourier transform infrared spectroscopy . X-ray diffraction . Field emission scanning electron microscopy
Introduction Solid electrolytes have been used widely in electrochemical devices especially in battery development. The interest in inorganic solid electrolytes could be due to their promising properties such as thermal stability and fast ion transport [1]. Solid compound such as Na1+xZr2SixP3−xO12 referred as sodium super ionic conductor (NASICON) was prepared and used as solid electrolyte for Na+ ion-based batteries [2]. The specific attraction of NASICON composition lies on its structure which consists of corner-sharing PO4–SiO4 tetrahedral and ZrO6 octahedral. These types of structures create a 3-D network channels for the transportation of sodium ions [3]. It has been reported that iodide-based solid electrolytes have a great potential for use in thermal batteries due to their low melting point and high ionic conductivity [4, 5]. Ahmad and Arof reported that a binary system containing Lil exhibited high ionic conductivity of 3.0×10⁻³ S cm−1 [6]. In their work, xLil+(1−x)Li2WO4 solid mixtures prepared by low sintering method has shown reasonably good ionic conductivity. In literatures, various techniques have been used in preparing crystalline solid compounds such as ball milling, sol–gel technique, and solid-state reaction [7–9]. Ahmad and Ghani, in their work [10], reported that by mechanical milling of 0.3
390
Ionics (2014) 20:389–397
MgI2–0.7 Mg3(PO4)2 crystalline starting powders, the mixture became homogeneously mixed and maximum conductivity of 7.00×10⁻⁴ S cm−1 was obtained. The ionic conductivity was measured by using impedance technique. Recently, ion diffusion in sulfide-based solid electrolyte (Li2S)7(P2S5)3 was investigated by using 7Li nuclear magnetic resonance (NMR) spectroscopy and it was found that high conductivity values can be achieved for the sample with fast ion diffusion through the solid [11]. As an alternative to lithium, sodium-based electrolyte has become the attention of the investigation due to small cation based on the fact that sodium is below lithium element in the periodic table. Furthermore, it is very stable in air as compared to lithium. In addition, due to its natural abundance, sodium is cheap and hazard free. In this study, sodium iodide (NaI) was added to sodium phosphate (Na3PO4), ground and mechanically milled. The fine mixture then pelletized and sintered at 50 °C for 3 days to excite the ions and to allow reaction to take place. Ionic mobility and the electrical properties of NaI–Na3PO4 were studied by solidstate nuclear magnetic resonance and impedance spectroscopy. Samples then characterized by using Fourier transform infrared spectroscopy (FTIR), X-ray diffraction (XRD), and field emission scanning electron microscopy (FESEM). Thus, these studies will bring about new knowledge on inorganic solid electrolyte and discover new information on structural properties and conductivity of NaI–Na3PO4.
Experimental Sample preparation of NaI–Na3PO4 solid electrolyte Nal and Na3PO4 of high purity were varied according to different
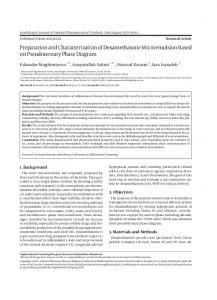
Fig. 1 Conductivity versus sintering time
percentage in order to determine optimum composition with maximum conductivity. Of the NaI, 5–60 wt% was ground with different percentage of Na3PO4 in an agate mortar and milled for 3 h at a rate of 300 rpm. Then, the mixtures were pelletized in a mold at 2,000 psi using ENERPAC hydraulic press (max, 1,000 psi/700 bar). The thickness and diameter of pellets were about 0.19 and 2.0 cm, respectively. The samples were placed in test tubes and corked by using glass wool [5, 6, 12] then sintered at 50 °C for 72 h in a vacuum oven. Sintering in vacuum assisted in disposal of residual water in the peletized samples [13]. In order to determine the sintering time and sintering temperature, samples with fixed composition of NaI were prepared and subjected to three different sintering temperatures (40, 50, and 60 °C). The sintering temperature must not exceed 73.5 °C since Na3PO4 will start to melt at 73.5 °C [14]. Result showed that maximum conductivity was achieved when the sample was heated at 50 °C. Then, the samples were sintered at 50 °C for different number of days. Figure 1 shows the variation of the conductivity of NaI– Na3PO4 with fixed composition of NaI for different sintering time. The sample exhibits maximum conductivity when it was sintered for 3 days. Therefore, in this work, the sintering temperature and time chosen were 50 °C and 3 days, respectively. Measurement of electrical conductivity The electrical conductivity of the samples were measured by using ac impedance technique. HIOKI 3520-01 LCR HI Tester that was interfaced to computer used to measure complex impedance. The measurements were carried out using frequency range of 50– 106 Hz. The electrical conductivity of the sample was
1.20E-04
1.00E-04
Conductivity (S/cm)
8.00E-05
6.00E-05
4.00E-05
2.00E-05
0.00E+00 0
1
2
3
-2.00E-05 Numbers of days
4
5
Ionics (2014) 20:389–397
391
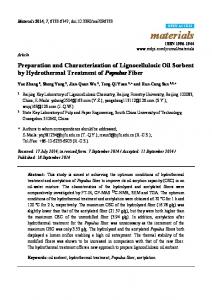
Fig. 2 Conductivity plot with different weight percent of NaI
1.20E-04
Conductivity (S/cm)
1.00E-04
8.03E-05
6.03E-05
4.03E-05
2.03E-05
2.85E-07 0
5
10
15
20
25
30
35
40
45
50
55
60
65
Wt% of NaI
Nuclear magnetic resonance NMR spectra were recorded using a Bruker DSX 400 NMR spectrometer operated at 105.8 MHz. Fine ground binary samples were spun using ZrO2 rotor at 35 kHz . Room temperature magic angle spinning (MAS) NMR spectra were accomplished with highspeed MAS NMR probe (Bruker).
calculated using the bulk resistance, R b , determined from impedance spectra using the equation below. σ¼
t Rb ˙ A
ð1Þ
Where, is the electrical conductivity is the thickness of the electrolyte is the bulk resistance is the area of the electrolyte
Fig. 3 Impedance spectra of the samples with different weight percent of NaI
1.20E+05
1.20E+03 1.00E+03
1.00E+05
Zi (Ohm)
σ t Rb A
Fourier transform infrared spectroscopy FTIR measurements were carried out by using Perkin Elmer FTIR Spectrometer SPECTRUM 2000 using KBr method. The spectrum was acquired in the range of 400– 4,000 cm−1.
8.00E+02
6.00E+02 50wt.% NaI
4.00E+02 2.00E+02
Zi (Ohm)
8.00E+04
0.00E+00 0.00E+00
5.00E+02
1.00E+03 60wt.% NaI
Zr (Ohm)
40wt.% NaI
6.00E+04
30wt.% NaI" 20wt.% NaI 10wt.% NaI
4.00E+04
2.00E+04
0.00E+00 0.00E+00
2.50E+04
5.00E+04
7.50E+04 Zr (Ohm)
1.00E+05
1.25E+05
392
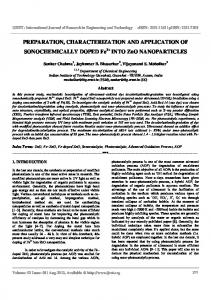
Fig. 4
Ionics (2014) 20:389–397
23
MAS NMR spectra of a 20 wt% NaI, b 60 wt% NaI, c 30 wt% NaI, d 40 wt% NaI, and e 50 wt% NaI
X-ray diffraction XRD measurements were used for phase identification (Siemens D500). The current used to heat filaments was 30 mA and the accelerating voltage of the electron was 40 kV. Filtered CuKα radiation was passed through a graphite monochromator. The diffractograms was taken in the region of 2θ° between 5° and 75°. Fig. 5 FTIR full spectra of samples Na3PO4 with various wt% of NaI a pure NaI, b 50 % NaI, c 40 % NaI, d 30 % NaI, e 20 % NaI, f 10 % NaI, g pure Na3PO4
Field emission scanning electron microscopy The morphological characteristics of the surface of NaI–Na3PO4 binary samples were examined and recorded using scanning electron microscopy by Carl Zeiss. This study revealed the grain size and the structural arrangement of the sample electrolytes.
(a) (b) % Transmission (a.u)
(c) (d) (e) (f) (g)
4000 3800 3600 3400 3200 3000 2800 2600 2400 2200 2000 1800 1600 1400 1200 1000 wavenumber, cm-1
800
600
400
Ionics (2014) 20:389–397
393
Results and discussion Low sintering method at 50 °C for 3 days was chosen as optimum parameter in preparing solid electrolytes in order to ensure good electrical contact around each particle and to avoid particles coalescence of the material [15]. In determination of the sintering time, the sample with fixed composition of NaI was sintered for different number of days and the electrical conductivity of the samples were measured. The electrical conductivity of the samples sintered at different number of days is shown in Fig. 1. The increase in conductivity with sintering time is due to the formation of conducting channels at the interface of the two mixtures. Sintering temperature of 50 °C and sintering time of 3 days yield a
maximum conductivity and it is expected that a sufficient number of conducting pathways have been formed allowing a maximum number of ions to traverse through the material. However, as sintering time exceeds 3 days, a sudden drop in conductivity was observed as the sintering time increased. This could be that some of conducting channels get blocked and some channels may joined up to form one single channel that limits ion mobility [16]. Figure 2 shows the variation of electrical conductivity of the binary NaI–Na3PO4 with different wt% of NaI. It can be seen that the conductivity of the sample increase as wt% of NaI increases until maximum conductivity of (1.02±0.19)× 10−4 S cm−1 is achieved for the sample contains 50 wt% of NaI. When the NaI content is low, many voids exist between
(a) (b) (a) (b)
(c)
(c) % Transmission (a.u)
% Transmission (a.u)
(d)
(e) (f)
(d)
(e) (f) (g)
(g)
1200
1000
800
(a) Pure NaI
(a) Pure NaI
(b) 50% NaI
(b) 50% NaI
(c) 40% NaI
(c) 40% NaI
(d) 30% NaI
(d) 30% NaI
(e) 20% NaI
(e) 20% NaI
(f) 10% NaI
700
600
500
(f) 10% NaI
wavenumber cm-1 wavenumber cm-1
(g) Pure Na3PO4
Fig. 6 FTIR spectra of orthophosphate (PO43−) with different wt% of NaI, pure NaI, and pure Na3PO4 in the range of 1,200–800 cm−1
(g)Pure Na3PO4
Fig. 7 FTIR spectra of P–O bending with different weight percent of NaI, pure NaI and pure Na3PO4 in the range of 700–500 cm−1
394
depicted in the spectrum are the fingerprints of Na3PO4 [23]. The broadband at 3,400 cm−1 is assigned to OH− stretching vibrational mode indicating that samples were physiosorbed water [12]. Similar results were obtained from the literatures that is the presence of OH− stretching vibrational mode can be detected within the region of 2,800–3,800 cm−1 [10, 12]. It can be observed that the OH− stretching become shallow and the bands have decreased with increased in Na3PO4 indicating that the amount of water has reduced and the samples became more stable against the atmospheric attack [12]. It also implies that the conductivity is due to the Na+ motions and not H+ from OH hydroxyl group [10].
(a)
(b) (c)
(d)
% Transmission (a.u)
Na3PO4 particles. Thus, the addition of NaI content initially facilitates the sodium ionic conduction. The increase in conductivity is due to the increase in Na+ ions from NaI. High conductivity value is achieved effectively due to the main charge carriers Na+ ions since Na+ ions are smaller and more mobile as compared to anion, I− who has large ionic radii. Large ionic radius is related to the low lattice energy which has been found to facilitate dissociation of salt [17–19]. However, sudden drop in the conductivity can be seen when wt% of NaI is more than 50 %. This is due to the increase of overall resistance to the sodium ion since there are large numbers of charge carriers to migrate in the existing conducting pathway. Hence, the decrease in conductivity for the sample contains more than 50 wt% NaI is due to the blocking effect [5, 10]. Figure 3 shows the complex impedance spectra for binary samples with different wt% of NaI. The R b obtained from these impedance spectra were used in the calculation of electrical conductivity using the Eq. (1). The 23Na NMR spectra of the various weight percent of NaI can be used to demonstrate the dynamic behavior of sodium in the binary compound. Figure 4 shows 23Na NMR line widths (full width at half maximum) for each sample which signify on the bulk mobility of Na where narrow line shapes are assigned to high ion mobility while broad line shapes referred to low ion mobility [20]. The spectrum of sample having maximum conductivity which is at 50 wt% NaI (Fig. 4(e)) shows narrowest line width that indicates the highest ionic mobility among the samples. However, at 20 wt% of NaI (Fig. 4(a)), the line width at half maximum becomes broader than the other spectra (Fig. 4(b,c,d,e)) which indicates the ion mobility for 20 wt% NaI sample is lower than the ions in 30, 40, 50, and 60 wt% NaI. The line width at 60 wt% NaI and 30 wt% NaI which signifies the mobility of the ions in those samples are slightly differed in size. This explains why the electrical conductivity values for 60 wt% NaI and 30 wt% NaI varies slightly that are (1.46±0.32)×10−5 and (1.52±0.29)×10−5 S cm−1, respectively. Further addition of NaI that is more than 50 wt% (60 wt% NaI) gave narrower line width than the samples at 30 wt% NaI, 40 wt% NaI and 50 wt% NaI which is caused by excessive number of mobile ions which restricted the movement of each other to get through the limited pathway which is known as blocking effect. Hence, the conductivity has dropped. Infrared analysis was done on pure samples of NaI, Na3PO4, and samples containing different weight percent of NaI. The spectrums of these samples are shown in Fig. 5. In the NaI spectrum, a sharp peak can be seen at the wave number 1,618 cm−1 and this is a fingerprint of NaI. Similar peak of spectrum has been reported by Bhargav et al. [21] and Tiwari [22]. The two distinct peaks at 1,010 and 571 cm−1
Ionics (2014) 20:389–397
(e) (f)
(a) Pure NaI
(g)
(b) 50% NaI (c) 40% NaI (d) 30% NaI (e) 20% NaI
1800
1600
1400
(f) 10% NaI
wavenumber cm-1
(g)Pure Na3PO4
Fig. 8 FTIR spectra of NaI–Na3PO4 with different weight percent of NaI, pure NaI and pure Na3PO4 in the range of 1,800–1,400 cm−1
Ionics (2014) 20:389–397
395
From the spectra shown in Fig. 6, the band from pure Na3PO4 is more likely from orthophosphate anion, PO43− vibrations at wave number 1,010.38 cm−1 [23]. As the weight percent of NaI increase, the peak has shifted to lower wave number 1,009.41 cm−1. Similar reaction using metal halides reported by Kaus and Ahmad [5] indicates this shifting is due to some distortion of tetrahedral units or complexity between Na+ in NaI and oxygen double bonded to the phosphate atom. Figure 7 implies that shifting in wave number from 579.49 to 568.03 cm−1 (from g to b) indicates P–O bending vibrations [5]. The low sintering method is predicted to cause some changes in the structure of the samples through the shifting of PO43− bands and P–O bending wavenumber from 1,010.38 to 1,009.41 and 579.49 to 568.03 cm−1, respectively. This shifting is due to tetrahedral unit's distortion because of corner or face sharing of units in creating the conducting channel for Na+ ions migration. Figure 8 depicts that by adding more NaI, the band at 1,668.72 cm−1 has shifted to 1,618.92 cm−1 indicating that some interaction have occurred in the metal halides compound [5] due to complexity between Na+ in NaI with the oxygen double bonded to the phosphate atom in PO43− unit. Na+ is expected to be weakly bind to the oxygen of the phosphate that can easily broken down when an incoming Na+ ion knocks the Na+ in Na+–O bond. Previous studies also reported similar mechanism of channel-like structures that assisted for the ion mobility and contribute for better conductivity [24, 25].
Figure 9 illustrates the XRD diffractogram of pure Na3PO4, NaI, and samples with different weight percent of NaI in the range of (2θ =5–75°). For pure samples, it is clearly seen that both NaI and Na 3 PO 4 exhibit crystalline in nature. Diffractogram of pure Na3PO4 exhibits peaks at 18.88°, 20.80°, 23.25°, 32.41°, 33.08°, 34.22°, 35.25°, 39.52°, 42.07°, 43.74°, 47.50°, 49.14°, 60.51°, and 61.20°. Due to hygroscopic nature, we have decided to seal the pure NaI with tape during the sample preparation and the peaks at 13.973°, 16.829°, 18.308°, 25.448°, and 28.032° indicate the existence of the tape. For pure NaI, peaks could be seen at 23.833°, 27.025°, 38.979°, 46.547°, 48.013°, 56.861°, 62.549°, and 71.025°. Addition of NaI into Na3PO4 have made the binary system become less crystalline and this is proven by broadening of the peak at 2θ =34.22°. At this angle, the intensity of peak starts to decrease as the NaI increases. As the content of NaI increased to 50 wt% (maximum conductivity of the sample), the peaks become more broad and less intense. Results reveal that the sample with maximum conductivity has become more amorphous in nature. This implies that some reaction have occurred in the binary compound. This could be due to the disruption of the crystalline structure of the Na3PO4 by NaI that led to greater ionic diffusivity. Hodge et al. [26] observed that with the addition of dopant, the amorphous nature of the sample has increased as the intensity of XRD peak decreased. This observation confirmed a correlation between the degree of crystallinity and intensity of the peak.
Counts/s (a.u)
Fig. 9 Diffractograms of a pure NaI, b pure Na3PO4, different wt% NaI of samples c 50 % NaI, d 40 % NaI, e 30 % NaI
(a) (b) (c) (d) (e) 5
15
25
35
45 2θ (degree)
55
65
75
85
396
Ionics (2014) 20:389–397
small fragments during the process while sintering promotes microstructural densification.
Conclusion The binary compound of NaI–Na3PO4 with varied compositions were prepared by ball milling and sintering method. The sintering temperature at 50 °C for 3 days was able to produce a sample with high conductivity. The binary system with 0.5 NaI–0.5 Na3PO4 exhibits the highest conductivity of (1.02± 0.19)×10−4 S cm−1 at room temperature. Solid-state 23Na NMR spectrum demonstrated narrow line width assigned to Na population with higher ion mobility in the optimum composition. XRD and FTIR concluded that reaction had occurred between NaI and Na3PO4. The presence of tetrahedral structure of phosphate units could produce channel-like structure that assist in the Na+ movement which can be used as an electrolyte in solid-state battery. Acknowledgments The authors acknowledge Universiti Teknologi Mara, Malaysia for funding this project. The authors also like to thank Ionic, Colour and Coating (ICC laboratory) as well as Institute of Science, Faculty of Applied Sciences and last but not least Malaysian Rubber Board for helping with the ssNMR instrument.
References
Fig. 10 FESEM micrographs 50 wt% NaI–50 wt% Na3PO4 pellets of a unmilled and unsintered, b unmilled and sintered, c milled and sintered
Figure 10 shows the FESEM micrographs of the 50 wt% NaI–50 wt% Na3PO4 pellets at various conditions. The micrograph shows narrow grain size distribution in the homogeneous and porous microstructure for unmilled and unsintered samples (Fig. 10a). From the micrograph (Fig. 10b), sintering at 70 °C resulted in grain growth and densification of the samples. The number of pores was reduced and the grains are closed together. It is clearly seen that the sintering process promote the growth of grain boundaries in a straight line manner and this could be due to the conducting pathways forming at the interface [27]. Upon sintering, these pathways can also grow in size and join with one another allowing fast ions to migrate throughout the material. Milling of the sintered 50 wt% NaI–50 wt% Na3PO4 compound (Fig. 10c) helped to produce finer particles as the mixture was breakdown into
1. Kobayashi M (2004) From caterpillar model to solid-state ionics. Solid State Ionics 174:57–66. doi:10.1016/j.ssi.2004.04.040 2. Fuentes RO, Figueiredo FM, Marques FMB, Franco JI (2001) Influence of microstructure on the electrical properties of NASICON materials. Solid State Ionics 140:173–179. doi:10.1016/ S0167-2738(01)00701-9 3. Anantharamulu N, Rao KK, Rambabu G, Kumar BV, Radha V, Vithal M (2011) A wide-ranging review on NASICON type materials. J Mater Sci 46:2821–2837. doi:10.1007/s10853-011-5302-5 4. Masset P, Henry A, Poinso JY, Poignet JC (2006) Ionic conductivity measurements of molten iodide-based electrolytes. J Power Sources 160:752–757. doi:10.1016/j.jpowsour.2006.01.014 5. Kaus NH, Ahmad AH (2009) Conductivity studies and ionic transport mechanism in Lil–Li3PO4 solid electrolyte. Ionics 15:197–201. doi:10.1007/s11581-008-0252-x 6. Ahmad AH, Arof AK (2002) Structural studies and ionic conductivity of lithium iodide-lithium tungstate solid electrolytes. Ionics 8: 433–438. doi:10.1007/BF02376058 7. Shimura T, Murahashi D, Iwahara H, Yogo T (2002) Solid state ionics: trends in the millenium. B.V.R Chowdari (eds). World Scientific Publishing Co. Pte. Ltd.: Singapore, pp 613–620. doi:10. 1142/9789812776259_0072 8. Obayashi H, Gotoh A, Nagai R (1981) Composition dependence of lithium ionic conductivity in lithium nitride-lithium iodide system. Mat Res Bull 16:581–585. doi:10.1016/0025-5408(81)90124-0 9. Ardel G, Golodnitsky Peled DE, Wang Y, Wang G, Bajue S, Greenbaum S (1998) Bulk and interfacial ionic conduction in LiI/ Al2O3 mixtures. Solid State Ionics 113–115:477–485. doi:10.1016/ S0167-2738(98)00313-0
Ionics (2014) 20:389–397 10. Ahmad AH, Ghani FA (2009) Conductivity and structural studies of magnesium based solid electrolytes. AIP Conf Proc 1136:1–35. doi: 10.1063/1.3160156 11. Hayamizu K, Aihara Y (2013) Lithium ion diffusion in solid electrolyte (Li2S)7(P2S5)3 measured by pulsed-gradient spin-echo 7Li NMR spectroscopy. Solid State Ionics 238:7–14. doi:10.1016/j.ssi.2013.02.014 12. Ahmad AH, Arof AK (2004) XRD, Conductivity and FTIR studies on Lil–Li2WO4–LI3PO4 prepared by low tempering sintering. Ionic 10:200–205. doi:10.1007/BF02382817 13. Akridge JR, Vourlis H (1986) Solid state batteries using vitreous solid electrolytes. Solid State Ionics 18–19:1082–1087. doi:10.1016/01672738(86)90313-9 14. Budavari (1996) The Mack Index. In: Budavari S (ed) An encyclopedia of chemicals, drugs, and biologicals, 12th edn. Merck, Whitehouse Station, NJ, USA 15. Delacourt C, Wurm C, Laffont L, Leriche JB, Masquelier C (2006) Electrochemical and electrical properties of Nb-and/or C-containing LiFePO4 composites. Solid State Ionics 177:333–341. doi:10.1016/j. ssi.2005.11.003 16. Han TK, Ahmad R, Johan MR (2011) Phase thermal and impedance studies of nanosize via mechanical milling and sintering. Superlattice Microst 49:17–31. doi:10.1016/j.spmi.2010.10.003 17. Armand M, Gorecki W, Andreani R (1990) .Proceeding of the 2nd International Meeting on polymer electrolytes. B. Scrosati (eds). Elsevier: New York, pp 91 18. Nagae SI, Nekoomanesh HM, Booth C, Owen JR (1992) The effect of salt concentration on the properties of poly[oxymethylene-oligo (oxyethylene)]/LiClO4 polymer electrolytes. Solid State Ionics 53– 56:1118–1124. doi:10.1016/0167-2738(92)90300-E
397 19. Armand M (1994) The history of polymer electrolytes. Solid State Ionics 69:309–319. doi:10.1016/0167-2738(94)90419-7 20. Gupta A, Murugan R, Paranthaman MP, Bi Z, Bridges CA, Nakanishi M, Solokov AP, Han KS, Hagaman EW, Xie H, Mullins CB, Goodenough JB (2012) Optimum lithium-ion conductivity in cubic Li7−xLa3Hf2−xTaxO12. J Power Sources 209:184–188. doi:10. 1016/j.jpowsour.2012.02.099 21. Bhargav PB, Mohan VM, Sharma AK, Rao VN (2007) Structural and electrical studies of sodium iodide doped poly (vinyl alcohol) polymer electrolyte films for their application in electrochemical cells. Ionics 13:173–178. doi:10.1007/s11581-007-0102-2 22. Tiwari T, Srivastava N, Srivastava PC (2011) Electrical transport study of potato starch-based electrolyte system. Ionics 17:353–360. doi:10.1007/s11581-010-0516-0 23. Nuquis RA, Kagel RO (1971) Infrared spectra of inorganic compound. Academic, New York, pp 339–465 24. Suzuki T, Yoshida K, Uematsu K, Kodama T, Toda K (1998) Structure refinement of lithium ion conductors Li3Sc2(PO4)3 and Li3−2x(Sc1− xMx)2 (PO4)3 (M =Ti, Zr) with x =0.10 by neutron diffraction. Solid State Ionics 113–115:89–96. doi:10.1016/S0167-2738(98)00279-3 25. Tomaszewski PE, Mączka M, Majchrowski A, Waśkowska A, Hanuza J (2005) Crystal structure and vibrational properties of KMg4(PO4)3. Solid State Sci 7:1201–1208. doi:10.1016/j.solidstatesciences.2005.06.002 26. Hodge RM, Edward GH, Simon GP (1996) Water absorption and states of water in semicrystalline poly (vinyl alcohol) films. Polymer 37:1371–1376. doi:10.1016/0032-3861(96)81134-7 27. Dieterich W, Durr O, Pendzing P, Bundle P, Nitzan A (1999) Percolation concepts in solid state ionics. Physica A 266:229–237. doi:10.1016/S0378-4371(98)00597-4