materials Article
Preparation, Characterization and Thermo-Chromic Properties of EVA/VO2 Laminate Films for Smart Window Applications and Energy Efficiency in Building Onruthai Srirodpai 1 , Jatuphorn Wootthikanokkhan 1,2, *, Saiwan Nawalertpanya 2,3 , Kitti Yuwawech 1 and Vissanu Meeyoo 2,4 1 2
3 4
*
School of Energy, Environment and Materials, King Mongkut’s University of Technology Thonburi (KMUTT), Bangkok 10140, Thailand;
[email protected] (O.S.);
[email protected] (K.Y.) Nanotec–KMUTT Center of Excellence on Hybrid Nanomaterials for Alternative Energy, King Mongkut’s University of Technology (KMUTT), Thonburi, Bangkok 10140, Thailand;
[email protected] (S.N.);
[email protected] (V.M.) Department of Chemical Engineering, Faculty of Engineering, King Mongkut’s University of Technology Thonburi (KMUTT), Bangkok 10140, Thailand Department of Chemical Engineering, Mahanakorn University of Technology, Bangkok 10530, Thailand Correspondence:
[email protected]; Tel.: +66-2-4708-6559 (ext. 316)
Academic Editor: Massimo Lazzari Received: 1 December 2016; Accepted: 3 January 2017; Published: 11 January 2017
Abstract: Thermochromic films based on vanadium dioxide (VO2 )/ethylene vinyl acetate copolymer (EVA) composite were developed. The monoclinic VO2 particles was firstly prepared via hydrothermal and calcination processes. The effects of hydrothermal time and tungsten doping agent on crystal structure and morphology of the calcined metal oxides were reported. After that, 1 wt % of the prepared VO2 powder was mixed with EVA compound, using two different mixing processes. It was found that mechanical properties of the EVA/VO2 films prepared by the melt process were superior to those of which prepared by the solution process. On the other hand, percentage visible light transmittance of the solution casted EVA/VO2 film was greater than that of the melt processed composite film. This was related to the different gel content of EVA rubber and state of dispersion and distribution of VO2 within the polymer matrix phase. Thermochromic behaviors and heat reflectance of the EVA/VO2 film were also verified. In overall, this study demonstrated that it was possible to develop a thermochromic film using the polymer composite approach. In this regard, the mixing condition was found to be one of the most important factors affecting morphology and thermo-mechanical properties of the films. Keywords: thermochromic; VO2 ; smart windows; EVA; composite
1. Introduction It has been reported that energy use for heating and air conditioning (HVAC) accounted for 48%, 55% and 52% of buildings’ energy consumption in the USA, UK and Spain [1], respectively. To reduce the energy consumption in buildings, there has been a considerable interest in a development of so called “energy efficient windows” or “smart windows”. This effect can be achieved by several approaches including by coating chromic material onto glass substrate. In general, different types of chromic materials are available, depending on the types of external stimulus such as light (photo-chromic), heat (thermo-chromic), and electricity (electro-chromic). In this regard, thermo-chromic smart windows have received particular interest due to the fact that they can
Materials 2017, 10, 53; doi:10.3390/ma10010053
www.mdpi.com/journal/materials
Materials 2017, 10, 53
2 of 20
be responded to the environmental temperature and yet the visible light transparency of the thermo-chromic smart windows remains almost unchanged. Transition metal oxides such as Ti2 O3 , V2 O3 , and VO2 are known to be capable of exhibiting thermo-chromic behavior. These materials are basically semi-conductors at low temperature and change to a metallic state at a temperature above its critical transition temperature. Among these metal oxides, VO2 has received interest and is being considered as a promising candidate for this technology. Upon heating to above its critical transition temperature (Tc, 68 ◦ C), the material exhibits a structural change from a monoclinic to a tetragonal phase. This brings about some changes in optical and electrical properties of the material. Specifically, above Tc, the material is capable of reflecting the near infrared (NIR) light. Besides this, the transition temperature of the material can be further reduced using doping agents such as tungsten [2]. In this regard, the higher the molar percentage of dopants, the lower the transition temperature [3]. In addition, Wang et al. [4] reported that co-doping of VO2 with tungsten (W) and magnesium (Mg) could provide a synergistic effect in which both transition temperature and luminous transmittance of the VO2 film can be improved. It is of noteworthy that, as single crystal, VO2 lattice cannot resist to the stress received during phase transformation and will crack after undergoing only some transition cycle. Prepared as thin film coated on selected substrate, VO2 film can stand more transition cycle and would be more effective for smart window application. Progress in the developments of VO2 for smart thermo-chromic coatings has been recently reviewed by Wang et al. [5]. Various aspects related to the development of the materials have been discussed, including the fabrication process of VO2 films, strategies for improving thermo-chromic properties, and the future research directions. In terms of the fabrication processes, various methods can be used to prepare the VO2 thermo-chromic coating glass, including sol-gel [6], sputtering deposition [7] and chemical vapor deposition [8]. The gas phase techniques are superior in term of the precise control of process parameters and film features (thickness, microstructure). However, complex equipment is usually required. On the other hand, the sol-gel method is of low cost and feasible for metal doping. Recently, an alternative solution-based process for preparing VO2 thin film, namely the “polymer-assisted deposition (PAD) process” has been developed [9–11]. VO2 film with a greater transparency (40%–84%) has been claimed. This technique is interesting and might be used to fabricate smart glass at a laboratory scale. However, to fabricate larger-sized smart glass for industrial use, a different manufacturing process needs to be developed. In this study, to avoid the above limitations, a different approach was proposed for fabricating an energy efficient window. Rather than coating thermo-chromic material onto the glass substrate, the thermo-chromic material in a powder form was directly incorporated into a polymer matrix prior to fabricating the laminated glasses. In this regard, the VO2 in a powder form has to be prepared. This can be done by using methods such as spray pyrolysis [12] and hydrothermal [13,14]. Chemicals used as precursor for preparing the VO2 include V2 O5 [15,16], and NH4 VO3 [17,18]. However, the synthesis of monoclinic vanadium dioxide (VO2 (M)) via the hydrothermal process is not straight forward. This is due to the facts that vanadium oxide (VOx ) comprise of up to 20 stable phases and the reaction is very sensitive to many parameters such as the calcination temperature [19] and the size and design of the reactor, which was in turn affecting the heat flow and the actual residence time. In this study, the effects of hydrothermal time and concentration of the tungsten doping agent on micro-structure of the synthesized VOx were studied and reported. The VO2 (M) powder has been utilized by mixing with some polymers. Shi et al. [19] for example, investigated structure-properties of glass coating, based on an acrylic polymer composite. The polymer was firstly mixed with VO2 via a solution process, using xylene as a solvent. Results from the Vis/NIR transmittance spectra at 15 ◦ C and 40 ◦ C indicate that the coating exhibited a good thermo-chromic performance. It was also found that XRD (X-ray powder diffraction) patterns and DSC (differential scanning calorimetry) thermograms of the W-doped VO2 changed with the size of VO2 particles, which was controlled by the grinding process. Similarly, Suzuki et al. [20] prepared
Materials 2017, 10, 53
3 of 20
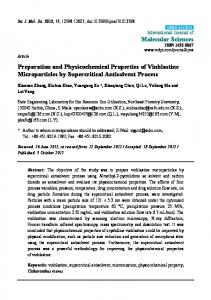
VO2 coated SiO2 nanoparticles. The co-metal oxides were then mixed with poly(lactic acid) (PLA) using N,N-dimethylholmamid as solvent and the composite film was fabricated via a solvent casting technique. From FTIR spectra of the composite, it was found that percentage transmittance of the peaks recorded at 80 ◦ C was lower than that of which recorded at a room temperature. This was claimed as evidence supporting the thermo-chromic behavior of the system. As aforementioned, it is rather clear that thermo-chromic behaviors of the neat VO2 (M) still exist once after the material has been incorporated into the polymer films. These properties are also dependent with morphology of the polymer/VO2 composites. This was, in turn, affected by the mixing process and the mixing conditions. In relation to our present study, the ethylene-vinyl acetate copolymer (EVA), commonly used as a binder film for the laminated glass industry, was selected as a matrix for mixing with the VO2 particles Normally, the commercial EVA film for either solar cell module or laminated glass is prepared via a polymer melted process such as an extrusion. In relation to this study, it is of unfortunate that a study on structure-properties of the EVA/VO2 film prepared by melted mixing process has been seldom reported in any open literature. In our opinion, this is an aspect deserving a consideration, taking into account that structure and properties of the EVA/VO2 composite prepared via a melt mixing could have been different to those of which prepared via a solution based process. Therefore, the primary aim of this work was to investigate the effect of monoclinic VO2 particles on heat reflectance, thermo-chromic behavior, optical transparency, and mechanical properties of the EVA based films. Comparisons on properties of the EVA/VO2 films prepared by two different mixing and fabrication techniques, which are a melted mixing process and a solution mixing process, were also of our interest. 2. Results and Discussion 2.1. Crystal Structures of VO2 Figure 1 shows XRD patterns of the products obtained from the hydrothermal and calcination processes. The characteristic XRD peaks at 2 theta of 27.11◦ , 34.49◦ , 39.59◦ , and 56.33◦ , representing the VO2 (B) phase, can be observed after the hydrothermal treatment. These correspond to the (−311), (−312), (−222), and (−531) planes of the metal oxide crystal. Besides, additional peaks at 35.58◦ and 61.13◦ also exist. These are attributed to the (602) and (306) plane of V4 O9 , which could be an intermediate product of the process (see Equations (1)–(3)). However, by further treating these materials through the calcination process, the above XRD peaks disappeared whereas those of which representing the characteristic pattern of monoclinic vanadium dioxide (VO2 (M)) immerged. The latter include the peaks at 2θ of 27.86◦ , 37.05◦ , 42.23◦ , 55.53◦ , 57.53◦ , 65.00◦ and 70.44◦ , corresponding to the crystal planes of (011), (200), (210), (220), (022), (013) and (202) of VO2 (M), respectively [17,21]. Furthermore, by analyzing the XRD peak of (011) plane with the Scherrer’s equation, crystal size of the VO2 (M) can be calculated. The value obtained was 26.9 nm which is close to that was reported by Ji et al. (17.8 nm) [22] and Chen et al. (25 nm) [18]. 2V2 O5 (s) + N2 H4 ·HCl(s) + 7HCl(l) → 4VOCl2 (aq) + N2 (g) + 6H2 O(g)
(1)
2VOCl2 (aq) ——–hydrothermal process—–> 2VO2 (B)(s) + 2Cl2 (aq)
(2)
VO2 (B)(s) —-annealing process—-> VO2 (M)(s)
(3)
Noteworthy, the XRD patterns significantly changes with hydrothermal time used. The XRD peak at 2θ = 27.11◦ , representing the VO2 (B) intermediate was observed when the sample was treated by the hydrothermal process for about 5–12 h. However, an intensity of the above peak tended to decrease with time and eventually disappeared after treated by the hydrothermal process for 48 h. Likewise, intensity of the XRD peak representing the VO2 (M) phase increased with time, suggesting that a sufficient time is needed for the VO2 (B) phase to be completely converted into the VO2 (M) phase [13,23,24]. The optimum time for achieving the completed formation of VO2 (M) from this study
Materials 2017, 10, 53
4 of 20
is shorter than that was reported by Lv et al. [15] and Cao et al. [25]. In those cases, the hydrothermal time required to achieve a complete formation of VO2 (M) was about 3–7 days, which is much longer MaterialsIn 2017, 10, opinion, 53 4 of 19 than herein. our the above discrepancies can be attributed to the different hydrothermal conditions used. A one step hydrothermal process was used in the literature work whereas two steps conditions used. A one step hydrothermal process was used in the literature work whereas two steps processprocess was used in this study. was used in this study.
Figure 1. XRD patterns of the products from hydrothermal and calcination processes.
Figure 1. XRD patterns of the products from hydrothermal and calcination processes. The similar XRD patterns were obtained when the VO2 was doped with 0.5 at % of tungsten (W) (see FigureXRD 2). Bypatterns further increasing the W content to 1% 2% atom, additional peaks at 2θ of The similar were obtained when the VOand 2 was doped with 0.5 at % of tungsten (W) 25.47° and 27.11° which represent the meta stable tetragonal structure of VO2(A) and VO2(B) phases (see Figure 2). By further increasing the W content to 1% and 2% atom, additional peaks at 2θ of 25.47◦ were also noted. The intensity values of both peaks tend to increase with the percentage atom of ◦ which and 27.11 represent the meta stable tetragonal structure of VO2 (A)for and VO2 (B) phases were tungsten used. This was probably due to the differences in energy required the formation of also noted. The intensity values of both peaks tend to increase with the percentage atom of tungsten VO2(M), VO2(B) and VO2(A), which are −7.18 eV, −6.66 eV and −7.14 eV, respectively [26]. In this case, used. This was probably due to the differences in energy required forfavorable, the formation of VO it was possible that the formation of VO2(A) and VO2(B) became more especially when the VO2 (B) 2 (M), of tungsten used are sufficiently high. and VOamount (A), which are − 7.18 eV, − 6.66 eV and − 7.14 eV, respectively [26]. In this case, it was possible 2 From the of enlarged XRD patterns (Figure 3), it was noted that the peaks, representing VO2(M) that the formation VO2 (A) and VO2 (B) became more favorable, especially when the amount of (2θ = 27°–29°) and those of which representing the tungsten doped VO2 (V1−xWxO2) (2θ = 24°–26° ) tungsten used are sufficiently high. slightly shifted downward after doping. This can be related to an increase of inter-planar distance or From the enlarged XRD patterns (Figure 3), it cation was noted thethan peaks, representing d-spacing of the crystal. Since the radius of tungsten (W6+) isthat greater that of the vanadiumVO2 (M) ◦ ◦ 4+) [15,18,27], 6+ in (2θ = 27cation –29 (V ) and those ofitwhich representing the tungsten 24◦ –26◦ ) 2 (V x Wx O 2 ) (2θ =of was possible that the replacement of doped V4+ by WVO the1− crystal structure 2 contributed to the increase of d-spacing. In addition, by using data from plane of VO 2 slightlyVO shifted downward after doping. This can be related to anthe increase of (011) inter-planar distance or in combination withSince the Scherrer’s equation, the sizes of the VO (M) and Vthan 1−xWxO 2 crystal were d-spacing of the crystal. the radius of tungsten cation (W6+ ) 2is greater that of the vanadium calculated and summarized in Table that 1. It was that crystal VO2 crystal decreased as 4+ ) [15,18,27], 6+ in the cation (V it was possible the found replacement of size V4+ofbytheWdoped structure of compared to that of the normal VO2(M). This could be attributed to the capability of W6+ in inhibiting VO2 contributed to the increase of d-spacing. In addition, by using the data from (011) plane of VO2 growth process of the crystal. However, as the concentration of tungsten dopant was further in combination with 0.5 theatScherrer’s equation, the sizes of the and V1−x Wx O2tocrystal 2 (M) increased above %, sizes of the crystals increased again. TheVO above trend is contradicted that were calculated summarized 1. It was found size of the VO was and observed by Xiao et in al. Table [27] whereby crystal size that of thecrystal tungsten doped VOdoped 2 linearly decreased 2 decreased as 6+ in withtothe dopant concentration. our opinion, the above discrepancy be attributed facts compared that of the normal VOIn2 (M). This could be attributed to could the capability of to Wthe inhibiting that different type of reactors and calcination conditions were used. Consequently, the VO 2(A) bygrowth process of the crystal. However, as the concentration of tungsten dopant was further increased product was obtained in this study. The formation of VO2(A) could compete with the growth process above 0.5 at %, sizes of the crystals increased again. The above trend is contradicted to that was of VO2. This led to the non-linear relationship between crystal size and the dopant concentration. It observed by Xiao et al. [27] whereby crystal size of the tungsten doped VO2 linearlytodecreased with was worth mentioning that the above XRD pattern lacks the presence of peaks belonging the neat the dopant concentration. In our opinion, the above discrepancy could be attributed to the facts that tungsten oxide [18,24,28]. different type of reactors and calcination conditions were used. Consequently, the VO2 (A) by-product was obtained in this study. The formation of VO2 (A) could compete with the growth process of VO2 . This led to the non-linear relationship between crystal size and the dopant concentration. It was worth
Materials 2017, 10, 53
5 of 19
Materials 2017, 10, 53
5 of 20
mentioning that the above XRD pattern lacks the presence of peaks belonging to the neat tungsten Materials 2017, 10, 53 5 of 19 oxide [18,24,28].
Figure 2. XRD patterns of VO2(M) and the varied tunsten doped VO2 (V1−xWxO2) obtained from the calcination process. Table 1. Inter-planar distance or d-spacing of the (011) plane and size of the VO2(M) and (V1−xWxO2) crystals which were prepared by using various concentration of tungsten dopant.
d-Spacing (nm) Crystal Size (nm) From XRD From TEM 0 0.3199 0.3550 26.9 0.5 of VO2(M) and the 0.3209 0.3586VO2 (V1−xWxO222.2 Figure 2. XRD patterns varied tunsten doped ) obtained from the Figure 2. XRD patterns of VO2 (M) and the varied tunsten doped VO2 (V1−x W x O2 ) obtained from the 1.0 0.3202 n/a 25.6 calcination process. calcination process. 2.0 0.3209 0.2460 28.1 Tungsten (% Atom)
Table 1. Inter-planar distance or d-spacing of the (011) plane and size of the VO2(M) and (V1−xWxO2) crystals which were prepared by using various concentration of tungsten dopant.
Tungsten (% Atom) 0 0.5 1.0 2.0
d-Spacing (nm) From XRD From TEM 0.3199 0.3550 0.3209 0.3586 0.3202 n/a 0.3209 0.2460
Crystal Size (nm) 26.9 22.2 25.6 28.1
Figure 3. The enlarged XRD patterns (24°–29°) of VO2(M) and the doped metal oxides (V1−xWxO2)
Figure 3. The enlarged XRD patterns (24◦ –29◦ ) of VO2 (M) and the doped metal oxides (V1−x Wx O2 ) obtained by applying various concentration of the dopant (W). obtained by applying various concentration of the dopant (W). Table 1. Inter-planar distance or d-spacing of the (011) plane and size of the VO2 (M) and (V1−x Wx O2 ) crystals which were prepared by using various concentration of tungsten dopant.
Tungsten (% Atom)
d-Spacing (nm)
Crystal Size (nm)
Figure 3. The enlarged XRD patterns (24°–29°) 2(M) and the doped metal oxides (V1−xWxO2) From XRDof VO From TEM obtained by applying various concentration of the dopant (W).
0 0.5 1.0 2.0
0.3199 0.3209 0.3202 0.3209
0.3550 0.3586 n/a 0.2460
26.9 22.2 25.6 28.1
Materials 2017, 10, 53
Materials 2017, 10, 53
6 of 20
6 of 19
The (XPS) spectra spectra of of both bothpure pureand anddoped dopedVO VO depicted TheX-ray X-ray photoelectron photoelectron spectroscopy spectroscopy (XPS) 22 isisdepicted in in Figure 4. The peaks representing vanadium, oxygen atoms can be noted. After doping VO Figure 4. The peaks representing vanadium, oxygen atoms can be noted. After doping VO22with with 0.5 , which is normally occurs at 32.4 eV, 4f7/2 0.5atat%%ofofW, W,the thecharacteristic characteristicpeak peakrepresenting representingthe theWW 4f7/2, which is normally occurs at 32.4 eV, cannot be clearly seen. This was probably due to a small amount cannot be clearly seen. This was probably due to a small amountof ofthe thedopant dopantused. used.However, However,ititwas was of noteworthy that an intensity of the V2p peak, representing the monoclinic phase of noteworthy that an intensity of the V2p peak, representing the monoclinic phaseVO VO2 2increased increased after afteradding adding0.5 0.5atat% %W Wto tothe thesystem. system.A Aconsideration considerationof ofthe thehigh highresolution resolutionXPS XPSspectra spectra(Figure (Figure4b) 4b) shows that the V2p peak can be separated into two peaks which are V2p and V2p . Furthermore, 1/21/2 and V2p 3/2 shows that the V2p peak can be separated into two peaks which are V2p 3/2. Furthermore, by peak, using the Shirley function, it was found that 3/2 bycarrying carryingout outaadeconvolution deconvolutionofofthe theV2p V2p 3/2 peak, using the Shirley function, it was found that 4+ [29] of the doped VO (V addition peak at 517.1 eV, representing valence stateVV W ) can Obe 4+ [29] 2) addition peak at 517.1 eV, representing valence state of the doped VO2 (V20.995W0.995 0.005O20.005 can be noted. The binding energy of this peak is considered higher than that of the pure VO (M) 2 eV) noted. The binding energy of this peak is considered higher than that of the pure VO2(M) (515.8 (515.8 eV)This [22,30]. This indicates thatare there are 2 valence the vanadium doping. This [22,30]. indicates that there 2 valence states states of theofvanadium afterafter doping. This cancan be be considered as an indirect evidence supporting the incorporation of tungsten into the VO (M). 2 considered as an indirect evidence supporting the incorporation of tungsten into the VO2(M).
Figure4.4.XPS XPSsurvey surveyspectra spectra(a) (a)and andthe thehigh highresolution resolutionorordetailed detailedspectra spectra(b) (b)ofofVO VO2and andthe thedoped doped Figure 2 2 (0.5% tungsten). VO VO2 (0.5% tungsten).
Materials Materials 2017, 2017, 10, 10, 53 53
77 of of 19 20
2.2. Morphology 2.2. Morphology Figure 5 show the SEM images of the products obtained from hydrothermal and calcination processes. tretrahedral prism shape, corresponding to the VO 2(B)hydrothermal phase, was obtained after the FigureThe 5 show the SEM images of the products obtained from and calcination hydrothermal. above morphology changed to granularto shape particles after calcination, some of processes. TheThe tretrahedral prism shape, corresponding the VO (B) phase, was obtained after 2 which are being agglomerated. This corresponds totothe VO2(M)shape phase. Similarly, calcined the hydrothermal. The above morphology changed granular particles afterthe calcination, vanadium dioxide whichagglomerated. was doped with 0.5corresponds wt % of tungsten a kindSimilarly, of an irregular shape some of which are being This to the exhibited VO2 (M) phase. the calcined morphology. However, increasing the 0.5 concentration of theexhibited dopant, SEM images of V0.99Wshape 0.01O2 vanadium dioxide whichby was doped with wt % of tungsten a kind of an irregular and V0.98W0.02O 2 shows the presence ofthe a rod-like structure. This was attributed to the of2 morphology. However, by increasing concentration of the dopant, SEM images of Vpresence 0.99 W0.01 O VO [26,31–33]. The above result is in a good with to thethe XRD results, and2(A) V0.98by-product W0.02 O2 shows the presence of a rod-like structure. Thisagreement was attributed presence of indicated that the presence of VO 2(A) by-product apparent at the the XRD high results, concentration of VO2 (A) by-product [26,31–33]. The above result is became in a goodmore agreement with indicated W dopant. that the presence of VO2 (A) by-product became more apparent at the high concentration of W dopant.
Figure 5. SEM images of VO2 obtained from hydrothermal (a); and calcination (b); and the doped Figure 5. SEM images of VO obtained from hydrothermal (a); and calcination (b); and the doped VO2(M); V0.995W0.005O2 (c); and 2V0.98 W0.02O2 (d). VO2 (M); V0.995 W0.005 O2 (c); and V0.98 W0.02 O2 (d).
Figure 6 shows lattice fringe in the higher resolution TEM images of the normal VO2 and the Figure 6 shows fringe inshape the higher resolution TEM images of the normal 2 and the doped VO2 (0.5 at % lattice W). Granular particles were observed for both cases. This VO is consistent doped VO (0.5 at % W). Granular shape particles were observed for both cases. This is consistent 2 with that was observed from the SEM image. Size of the un-doped VO2 particles ranges 59with nm that was observed SEM image. SizeLiu of the un-doped VO2 particles rangesof59VO nm2/Si-Al increased to increased to 72 nmfrom afterthe doping. Similarly, et al. [34] examined morphology gel by 72 nmand afterfound doping. [34]composite examinedwas morphology of VOof2 /Si-Al by TEM and TEM thatSimilarly, particle Liu sizeetofal.the in the range 20 nm.gel Attempts werefound also that particle size of the composite was in the range of 20 nm. Attempts were also made to determine the made to determine the d-spacing of the VO2, The results summarized in Table 1 shows that the values d-spacing of the VO , The results summarized in Table 1 shows that the values from both techniques from both techniques2 are comparable, excepting the VO2 doped with 2 at % in which the lattice fringe arethe comparable, excepting the VO2 doped with 2In at addition, % in which the lattice fringe in the image in TEM image was overlapped and unclear. SAED patterns of the VOTEM 2 (Figure 7) was overlapped and unclear. In addition, SAED patterns of the VO (Figure 7) show the presence 2 polycrystalline. The similar show the presence of various crystal planes, indicating that VO2 is of various crystal planes,from indicating similar patterns were 2 is polycrystalline. patterns were observed the 0.5that at %VO doped VO2. However,The as the concentration of Wobserved dopant from the 0.5 at % doped VO . However, as the concentration of W dopant was further increased to 2 was further increased to 2 at %, the SAED pattern shows the presence of other planes corresponding 2 at %, the SAED pattern shows the presence of other planes corresponding to the additional VO (B) 2 to the additional VO2(B) and VO2(A) phases. The above results are in good agreement with those and VO TheXRD above results (Figure are in good 2 (A) phases. were obtained from the patterns 2). agreement with those were obtained from the XRD patterns (Figure 2).
Materials 2017, 10, 53
8 of 20
Materials 2017, 10, 53 Materials 2017, 10, 53
8 of 19 8 of 19
Figure 6. TEM images of of the synthesized VO22(M); (M);VV0.995 O2 (b). Figure 6. TEM images the synthesizedVO VO2 2(a); (a);and and the the doped VO WW 0.005 O2 (b). 0.995 0.005 Figure 6. TEM images of the synthesized VO 2 (a); and the doped VO2(M); V0.995W0.005O2 (b).
(a) (a)
(b) (b)
(c) (c) Figure 7. SAED patterns of VO2 (a); V0.995W0.005O2 (b); and V0.98W0.02O2 (c). Figure 7. SAED patterns of VO2 (a); V0.995W0.005O2 (b); and V0.98W0.02O2 (c). Figure 7. SAED patterns of VO2 (a); V0.995 W0.005 O2 (b); and V0.98 W0.02 O2 (c).
2.3. 2.3. Thermal Thermal Behaviors Behaviors 2.3. Thermal Behaviors Figure Figure 88 shows shows DSC DSC thermograms thermograms of of VO VO22(M) (M) both both before before and and after after doping. doping. An An exothermic exothermic peak peak at 74 °C can be seen from the thermogram of the un-doped VO 2.after This refers to phase transition Figure 8 shows DSC thermograms of VO (M) both before and doping. An exothermic peak 2 at 74 °C can be seen from the thermogram of the un-doped VO2. This refers to phase transition ◦ C can beofseen the thermo-chromic material, changing from semiconductor (M) to metallic (R) at temperature 74 from the thermogram of the un-doped VO . This refers to phase transition 2 temperature of the thermo-chromic material, changing from semiconductor (M) to metallic (R) structures. exothermic peak, transition of also temperature of the thermo-chromic material,thermo-chromic changing from semiconductor (M)oxide to metallic structures. The The exothermic peak, representing representing thermo-chromic transition of the the metal metal oxide also was was(R) observed after doping it with 0.5 at % of tungsten. Noteworthy, the peak became broader after structures. peak, thermo-chromic the metal oxide also observed The after exothermic doping it with 0.5representing at % of tungsten. Noteworthy,transition the peak of became broader after doping, due to a mal-distribution of factors, which caused the change in transition temperature was observed it with 0.5 % of tungsten. Noteworthy, the in peak becametemperature broader after doping, dueafter to a doping mal-distribution ofatfactors, which caused the change transition [12,18]. Nevertheless, in peaks shifted downward from to the doping, due to a mal-distribution factors, the change transition temperature [12,18]. Nevertheless, in this this case, case,ofthe the peakswhich shiftedcaused downward from 74 74in°C °C to 50 50 °C. °C. This This indicates indicates[12,18]. the
Materials 2017, 10, 53
9 of 20
Materials 2017, 10, 53
9 of 19
Materials 2017, 53 case, the peaks shifted downward from 74 ◦ C to 50 ◦ C. This indicates the9 tungsten of 19 Nevertheless, in10, this dopant was capable effectively the lowering transitionthe temperature of the metalofoxide. Wang et al. [4] tungsten dopantofwas capable lowering of effectively transition temperature the metal oxide. tungsten dopant was capable ofeffects effectively lowering the transition temperature ofeffect. the metal oxide. Wang et al. [4] studied doping of Mg/W in VO 2. film and found the similar For the VO studied doping effects of Mg/W in VO2 film and found the similar effect. For the VO2 doped2with Wang etwith al. [4] doping effects of Mg/W VO2.film and found the that similar effect. For the VO2 2 atstudied % of(without pure tungsten (without Mginit co-dopant), it was temperature 2 at %doped of pure tungsten Mg co-dopant), was found thatfound transitiontransition temperature of the neat doped with VO 2 at2 % of film puredecreased tungsten◦(without Mg°C co-dopant), was found◦that transition temperature of thefilm neat thin from 63.89 to a lowerittemperature (27.05 °C) as compared towork. VO2 of thin decreased from 63.89 C to a lower temperature (27.05 C) as compared to ourto the neat The VO2discrepancy thin film decreased 63.89 to °Cthe to afact lower (27.05 °C) as compared our work. could be from attributed that temperature different percentage atomic of tungsten The discrepancy could be attributed to the fact that different percentage atomic of tungsten was used. our waswork. used.The discrepancy could be attributed to the fact that different percentage atomic of tungsten Attempts were also made to follow up the enthalpy changes of VO , concurrently with its thermal was used. Attempts were also made to follow up the enthalpy changes of2 VO2, concurrently with its gravimetric analysis. From the DSC-TGA thermograms of the metal (Figure 9), it9), can be Attempts were also made to follow up the enthalpy changes ofoxide VO2, oxide concurrently with its seen thermal gravimetric analysis. From the DSC-TGA thermograms of the metal (Figure it can ◦metal thermal gravimetric analysis. From the DSC-TGA thermograms of the oxide (Figure 9), it can that there was no weight loss occurred during the DSC transition at 68 C. This indicates that the above be seen that there was no weight loss occurred during the DSC transition at 68 °C. This indicates that be seen that there was no weight loss occurred during the DSC transition at 68 °C. This indicates that transition was related to phase change of the thermo-chromic materials, and not due to the loss of the above transition was related to phase change of the thermo-chromic materials, and not due to the any the transition was related toor phase change of the thermo-chromic materials, and not due to the intermediate, residual or by-products. lossabove of any intermediate, residual by-products.
loss of any intermediate, residual or by-products.
Figure 8. DSC thermograms of VO2 and the tungsten doped VO2.
Figure 8. DSC thermograms andthe thetungsten tungsten doped 2. Figure 8. DSC thermogramsof of VO VO22 and doped VOVO 2.
Figure 9. DSC-TGA thermograms of VO2(M). Figure 9. DSC-TGA thermograms of VO2(M).
Figure 9. DSC-TGA thermograms of VO2 (M). 2.4. Thermo-Chromic Behaviors 2.4. Thermo-Chromic Behaviors 2.4. Thermo-Chromic Behaviors Figure 10 shows FTIR spectra of the VO2(M) particles, recorded as a function of temperature. It Figure 10 shows FTIR spectra the VO 2(M) particles, recorded as a function of temperature. It can be seen that absorbance of theofbroad peak over the wavenumber ranged between 500 and 900 Figure 10 shows FTIR spectra the VO recorded as a function of temperature. 2 (M) can be seen that absorbance of theofbroad peak overparticles, the wavenumber ranged between 500 and 900
It can be seen that absorbance of the broad peak over the wavenumber ranged between 500 and 900 cm−1 , corresponding to the mid-IR region, remarkably changed as the running temperature
Materials 2017, 10, 53 Materials 2017, 10, 53
10 of 19 10 of 20
cm−1, corresponding to the mid-IR region, remarkably changed as the running temperature increased. Specifically, when the scanning temperature was increased to 80 °C, the absorbance peak increased. Specifically, when the scanning temperature was increased to 80 ◦ C, the absorbance peak disappeared. This was due to the fact that the spectrum was recorded at a temperature above the disappeared. This was due to the fact that the spectrum was recorded at a temperature above the phase transition temperature of the VO2(M) (74 °C, for the metal oxide without doping). This means phase transition temperature of the VO2 (M) (74 ◦ C, for the metal oxide without doping). This means that the VO2 had changed from monoclinic phase to rutile phase, accompanied with the change in that the VO from monoclinic phase rutile phase, the change 2 had changed optical properties from NIR transmittance to NIRtoreflectance. Asaccompanied the scanning with temperature wasin optical properties from NIR transmittance to NIR reflectance. As the scanning temperature was cooled cooled down from 90 °C toward the ambient temperature (35 °C), the peak emerged again. This down fromthat 90 ◦thermo-chromic C toward the ambient temperature (35 ◦ C),isthe peak emerged again. behavior This indicates indicates behavior of the materials reversible. The similar was that thermo-chromic behavior of the materials is reversible. The similar behavior was observed from observed from the FTIR spectra of the tungsten doped VO2. In this case, however, the absorbance the FTIR spectra of at thea tungsten doped VO(60 thisascase, however, theofabsorbance disappeared 2 . In°C) peak disappeared lower temperature compare to that the normalpeak VO2(M). This is ◦ C) as compare to that of the normal VO (M). This is due to the fact that atdue a lower temperature (60 2 to the fact that phase transition temperature of the material dropped from 74 °C to 50 °C after ◦ C after doping. The above phase transition temperature material dropped 74 ◦ Cfrom to 50XRD doping. The above results are of in the good agreements with from the results and DSC thermograms results aresufficient in good agreements from XRD and DSC with thermograms and are sufficient and are to confirm with that the the results thermo-chromic VO2(M), and without doping, wereto confirm that the thermo-chromic VO (M), with and without doping, were successfully prepared. 2 successfully prepared.
(a)
(b) Figure 10. FT-IR spectra of the un-doped VO2(M) (a); and the doped VO2 (V0.995W0.005O2) (b), recorded Figure 10. FT-IR spectra of the un-doped VO2 (M) (a); and the doped VO2 (V0.995 W0.005 O2 ) (b), recorded as a function of temperature. as a function of temperature.
Materials 2017, 10, 53
11 of 20
Materials 2017, 10, 53
11 of 19
2.5. Structure-Properties of EVA/VO2 Composites
2.5. Structure-Properties of EVA/VO2 Composites
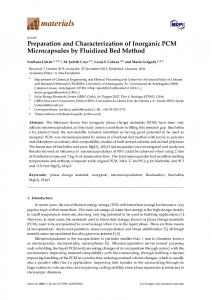
Figure 11 shows stress-strain curves of EVA and the EVA/VO2 composite films. Tensile properties Figure 11 shows stress-strain curves of EVA and the EVA/VO2 composite films. Tensile of the various samples were also summarized in Table 2. The ultimate stress, strain at break and initial properties of the various samples were also summarized in Table 2. The ultimate stress, strain at slope of the EVA hardly changed after applying 1 wt % of the VO2 particles into the polymer film. break and initial slope of the EVA hardly changed after applying 1 wt % of the VO2 particles into the However, it was that the tensile properties significantly affected by theaffected mixing by process. The films polymer film.noted However, it was noted that the tensile properties significantly the mixing prepared via the melt mixing process are stronger than those of which prepared by the solution mixing process. The films prepared via the melt mixing process are stronger than those of which prepared process. The discrepancies can be The related to the lower contenttovalues of the solutionvalues casted by the solution mixing process. discrepancies can gel be related the lower gel content of films (Tablethe 2) solution as compared those(Table of which meltofmixing was, in turn, owing castedtofilms 2) asprepared comparedbytothe those which process. prepared This by the melt mixing process. This was,between in turn, owing to some differences between the actual two processes, terms of theSpecifically, actual to some differences the two processes, in terms of the curing in conditions. curing conditions. Specifically, mixed film was preparedby bycuring an internal mixer followed by the melt mixed film was preparedthe by melt an internal mixer followed in a hydraulic compression curing in a hydraulic compression molding under high pressure. On the other hand, the solution molding under high pressure. On the other hand, the solution casted film was mixed by solution casted film was mixed by solution before curing in a hot air oven without any pressure. In this regard, before curing in a hot air oven without any pressure. In this regard, the shear rate, heat transfer and the shear rate, heat transfer and the actual temperature of the two processes could be different. These the actual temperature of the two processes could be different. These factors might promote the greater factors might promote the greater gel content and mechanical properties of the films prepared by the gel content and mechanical properties of the films prepared by the melt process. melt process.
Figure 11. Stress-strain curves of EVA and EVA/VO2 composite films.
Figure 11. Stress-strain curves of EVA and EVA/VO2 composite films. Table 2. Tensile, physical and optical properties of EVA and EVA/VO2 composite films.
Table 2. Tensile, physical and optical properties of EVA and EVA/VO2 composite films.
EVA Films Melt Mixing Solution Mixing EVA Films Modulus (MPa) 14.29 (±0.99) 4.70 (±0.73) Properties Mixing Mixing Ultimate tensile Stress (MPa)Melt29.75 (±3.75) Solution 13.63 (±2.00) Strain (%) (±37) 802 (±17.81) Modulus (MPa) 14.29 604 (±0.99) 4.70 (±0.73) (J) (±0.87) 7.14 (±0.59) Ultimate tensileToughness Stress (MPa) 29.756.20 (±3.75) 13.63 (±2.00) content (%) (±3.49) 45.90(± (±1.11) StrainGel (%) 60483.62 (±37) 802 17.81) Visible light (J) transmittance (%)6.2085.98 (±0.97) 89.95 Toughness (±0.87) 7.14 ((±0.54) ±0.59) Properties
EVA/VO2 (1 wt %) Films Melt Mixing Solution Mixing EVA/VO2 (1 wt %) Films 13.12 (±1.23) 5.31 (±0.34) Melt Mixing13.89 Solution Mixing 32.25 (±1.39) (±0.76) 696 (±9)(±1.23) 745 (±14.72) 13.12 5.31 (±0.34) 7.5832.25 (±0.39) (±1.39) 6.10 (±0.49) 13.89 (±0.76) 93.25 (±1.89) 696 (±9) 34.80 (±2.20) 745 (±14.72) 31.607.58 (±0.73) (±0.39) 73.73 (±0.56) 6.10 (±0.49)
Gel content (%) 83.62 (±3.49) 45.90 (±1.11) 93.25 (±1.89) 34.80 (±2.20) Figure 12 shows the of the(±various films(± and the average Visible light transmittance (%)overlaid 85.98UV/Vis (±0.97)spectra89.95 0.54) EVA31.60 0.73) 73.73visible (±0.56) light transmittance of the EVA films are summarized in Table 2. Regardless of the mixing processes, light transmittance in the visible range of the EVA was about 86%–89.95%. After mixing VO2 particles Figure 12 shows the overlaid UV/Vis of the various EVA films and thefilm average visible with EVA by a solution process, visible spectra light transmittance of the solution casted slightly light decreased transmittance of the EVA films are summarized in Table 2. Regardless of the mixing processes, to 73.73%. This was due to the presence of the metal oxide particles which is inherently
light transmittance in the visible range of the EVA was about 86%–89.95%. After mixing VO2 particles with EVA by a solution process, visible light transmittance of the solution casted film slightly decreased to 73.73%. This was due to the presence of the metal oxide particles which is inherently opaque.
Materials 2017, 10, 53 Materials 2017, 10, 53 Materials 2017, 10, 53
12 of 20 12 of 19 12 of 19
opaque. size Particles size ofoxide, the metal oxide, observed from the(Figure SEM images (Figure 13), islarge. also Particles of the metal observed the SEM images 13), is (Figure also considered opaque. Particles size of the metal oxide,from observed from the SEM images 13), is also considered large. Some of which are agglomerated in the polymer matrix. Nevertheless, the EVA/VO 2 Some of which are agglomerated in the polymer matrix. Nevertheless, the EVA/VO coated glass considered large. Some of which are agglomerated in the polymer matrix. Nevertheless,2 the EVA/VO2is coated glass is still semi-transparent (see Figure 14). The effect of VO 2 particles on visible light still semi-transparent (see Figure 14). (see The effect VO2The particles light transparency EVA coated glass is still semi-transparent Figureof14). effecton ofvisible VO2 particles on visible of light transparency of EVA film became more pronounced when theby composite wasprocess. prepared by case, melt film became more pronounced when the composite was prepared melt mixing In this transparency of EVA film became more pronounced when the composite was prepared by melt mixing process. In this case, transmittance of the EVA/VO 2 dropped rapidly as compared to that of transmittance of the EVA/VO dropped rapidly as compared to that of the neat EVA film prepared 2 mixing process. In this case, transmittance of the EVA/VO2 dropped rapidly as compared to that of the neat EVA film prepared by the same process. The EDX dot map of the specimens illustrated in byneat the same process. The EDX dot mapprocess. of the specimens illustrated 13 showed that in the the EVA film prepared by the same The EDX dot map of in theFigure specimens illustrated Figure 13 showed that thedistributed VO2 particles arethe randomly withinsize theofpolymer VO are randomly within polymer distributed matrix. However, the metalmatrix. oxide 2 particles Figure 13 showed that the VO 2 particles are randomly distributed within the polymer matrix. However, size of the metal oxide particles is considerable. The VO 2 particles are still agglomerated. particles is considerable. VO2particles particlesisare still agglomerated. seems that, for the sake of a more However, size of the metalThe oxide considerable. The VOIt 2 particles are still agglomerated. It seems that, for the sake of a more desirable thermos-chromic/optical properties of to thebe films, further desirable thermos-chromic/optical properties of the films, further have of yet carried out It seems that, for the sake of a more desirable thermos-chromic/opticalwork properties the films, further work have yet to be carried out of in the order to2 improve dispersion of thematrix. VO2 particles in the polymer in order to improve dispersion VO particles in the polymer This can be achieved work have yet to be carried out in order to improve dispersion of the VO2 particles in the polymer matrix. This can be achieved by several approaches shear including the adjustment of shear rate, mixing by several including the adjustment rate, time, of viscosity, andmixing surface matrix. This approaches can be achieved by several approachesofincluding themixing adjustment shear rate, time, viscosity, and surface functionalization of the materials. functionalization the materials. time, viscosity, andof surface functionalization of the materials.
Figure 12. Transmittance spectra of EVA and EVA/VO2 composite films. Figure12. 12.Transmittance Transmittancespectra spectraofofEVA EVAand andEVA/VO EVA/VO films. Figure 2 composite films. 2 composite
Figure 13. Cont.
Materials 2017, 10, 53 Materials 2017, 10, 53 Materials 2017, 10, 53
13 of 20 13 of 19 13 of 19
Figure 13.13. SEM images and X-ray dot map(V-Kα) (V-Kα)ofof ofthe theEVA/VO EVA/VO melt blending (a,b); Figure SEM images and X-ray dot (V-Kα) the EVA/VO prepared via melt blending (a,b); Figure 13. SEM images and X-ray dot map 22 prepared viavia melt blending (a,b); 2 prepared 2 film (c,d). and those of the solution casted EVA/VO and those of the solution casted EVA/VO film (c,d). 2 (c,d). and those of the solution casted EVA/VO2 film
2 film (a); thethe stand-alone melt Figure Photographsof ofthe thestand-alone stand-alone solution solution casted Figure 14.14.Photographs casted EVA/VO EVA/VO (a); stand-alone melt 2 film film (b); (b); the EVA film coated 2 film coated glass (d). mixed EVA/VO22film mixed EVA/VO coated glass glass(c); (c);and andthe theEVA/VO EVA/VO film coated glass (d). Figure 14. Photographs of the stand-alone solution casted EVA/VO2 film 2(a); the stand-alone melt mixed EVA/VO2 film (b); the EVA film coated glass (c); and the EVA/VO2 film coated glass (d).
From the above results, it seems that the mixing process strongly affected mechanical, thermal From the above results, it seems that the mixing process strongly affected mechanical, thermal and optical properties of the EVA/VO2 films. Percentage transmittance of the EVA/VO2 prepared via andFrom optical of theitEVA/VO films. Percentage transmittance of the EVA/VO via theproperties above results, seems that the mixing process strongly affected mechanical, thermal 2 prepared a solution mixing is greater than that2 of which prepared via the melt mixing process. The superior a solution mixing is greater than that of which prepared via the meltofmixing process. The superior and optical properties of the EVA/VO 2 films. Percentage transmittance the EVA/VO 2 prepared via optical properties of the former were obtained at the expense of its tensile properties. In this study, the former were at the expense ofmelt its tensile In this study, a optical solution mixing isof greater thanheat that ofobtained which of prepared via the mixingproperties. process. The superior visibleproperties light transparency and reflectance the EVA/VO 2 films are of higher priority taking into visible light transparency and heat reflectance of the EVA/VO films are of higher priority taking optical properties of the former were obtained at the expense of its tensile properties. In this study, 2 account its potential application as binder in laminated glass. Therefore, the composite film preparedinto account potential application asreflectance binder in laminated glass.2for Therefore, composite film prepared visible transparency and of was the EVA/VO films are ofthe higher priority taking into via light theits solution mixing andheat casting processes selected a further study on thermo-chromic viabehaviors. theits solution mixing and the casting processes was selected for a further on thermo-chromic account potential application asoverlaid binder in laminated glass. the study composite film prepared Figure 15 shows FTIR spectra of the Therefore, EVA/VO 2 composite films, which were via the solution mixing and casting processes was selected for a further study on thermo-chromic behaviors. Figure 15 shows the overlaid FTIR spectra of the EVA/VO composite films, which 2 wavenumber ranged recorded at two different temperatures. The FTIR transmittance over the −1 behaviors. Figure 15 shows the overlaid FTIR spectra of the EVA/VO 2 composite films, which were were recorded two different temperatures.to The overfilms the wavenumber between 500 at and 3500 cm , corresponding theFTIR mid transmittance IR region, of the recorded at 90ranged °C, −1 , corresponding recorded at500 two different The to FTIR over thethe wavenumber ranged between 3500 cm the mid region, of that the films recorded at 90 ◦ C, decreased asand compared totemperatures. that of which recorded at transmittance 40 °C.IR This implies EVA/VO 2 film was −1 capable ofasreflecting wave, provided wasmid used at◦aregion, temperature the phase transition between 500 and 3500 heat cmto , that corresponding toitthe IR theabove films recorded at 902 °C, decreased compared of whichthat recorded at 40 C. Thisof implies that the EVA/VO film temperature of VO 2 (M). The similar results was observed Suzuki et al. [20] in the VO 2 -SiO 2 decreased as compared to that whichprovided recordedthat at 40it°C. implies that the EVA/VO was was capable of reflecting heatofwave, wasThis used at a temperature above2 film the phase
capable of reflecting heat wave, provided that it was used at a temperature above the phase transition temperature of VO2(M). The similar results was observed Suzuki et al. [20] in the VO2-SiO2
Materials 2017, 10, 53
Materials 2017, 10, 53
14 of 20
14 of 19
transition temperature of VO2 (M). The similar results was observed Suzuki et al. [20] in the VO2 -SiO2 particle/PLA composite, using the FTIR spectrophotometer to record the transmittance over the particle/PLA composite, using the FTIR spectrophotometer to record the transmittance over the wavelength range between 2.5 µm and 8.5 µm (corresponding to the mid IR region). In that case, wavelength range between 2.5 µm and 8.5 µm (corresponding to the mid IR region). In that case, transmittance of the composite recorded at a high temperature (80 °C) was 10% lower than that of transmittance of the composite recorded at a high temperature (80 ◦ C) was 10% lower than that of which recorded at a room temperature. However, PLA resin is inherently brittle, moisture sensitive, which recorded at a room temperature. However, PLA resin is inherently brittle, moisture sensitive, and expensive. In this regard, the application of VO2/PLA composite as coating for smart window and expensive. In this regard, the application of VO2 /PLA composite as coating for smart window might not be practical. It is also worth mentioning that changes in spectral transmittances of the VO2, might not be practical. It is also worth mentioning that changes in spectral transmittances of the recoded by FTIR, are less obvious as compared to those of which recorded by Zhou et al. [35]. In that VO2 , recoded by FTIR, are less obvious as compared to those of which recorded by Zhou et al. [35]. case, solar modulation (∆Tsol) of the VO2/hydrogel hybrid, recorded over the wavelength range from In that case, solar modulation (∆Tsol ) of the VO2 /hydrogel hybrid, recorded over the wavelength 500 to 2500 nm, as high as 34.7% was observed. Similarly, Shi et al. [19] found that NIR transmittance, range from 500 to 2500 nm, as high as 34.7% was observed. Similarly, Shi et al. [19] found that NIR at 2500 nm, of the acrylic resin/W doped VO2 coating decreased by up to 23% after increasing a transmittance, at 2500 nm, of the acrylic resin/W doped VO2 coating decreased by up to 23% after temperature to above its transition. increasing a temperature to above its transition.
◦ Figure 2 2(1 Figure15. 15.FTIR FTIRspectra spectraofofthe thesolution solutioncasted castedEVA/VO EVA/VO (1wt wt%) %)film filmrecorded recordedatat4040and and9090 C. °C.
Lastbut butnot notleast, least,the theabove aboveresults resultswere wereconfirmed confirmedby byconsidering consideringthe thedemo demosystem, system,containing containing Last EVA and EVA/VO 2 films coated on a window of a model house (see Figure 16; inset). An infrared EVA and EVA/VO2 films coated on a window of a model house (see Figure 16; inset). An infrared lamp lamp (PHILIPS, R was 150 W) was a heattosource to phase activate phaseand change and thermo(PHILIPS, R125 IRR125 R 150IRW) used as used a heatassource activate change thermo-chromic chromic ofbehavior VO2temperature . The actualintemperature in frontmeasure of the by window, measure by behavior the VO2 . of Thethe actual front of the window, thermocouple was ◦ thermocouple 100 ± 1 °C. is well above theoftransition of the VO2. in Figure 16 100 ± 1 C. This was is well above the This transition temperature the VO2 . temperature Figure 16 shows changes indoor shows changes in indoor temperature behind of theirradiation windows time. as a function irradiation It can be temperature behind the windows as a function It can beofseen that thetime. temperature seen that the temperature increased with time reached a plateau after about 10 min. The linearly increased with timelinearly and reached a plateau afterand about 10 min. The equilibrium temperature ◦ equilibrium temperature the window coated withapproximately the normal EVA wassimilar approximately behind the window coatedbehind with the normal EVA film was 62 film C. The profiles 62 °C. The similar were whenwith the EVA was replaced with either EVA/VO 2(M) were observed whenprofiles the EVA filmobserved was replaced eitherfilm EVA/VO (M) or EVA/VO (B) composite 2 2 or EVA/VO 2 (B) composite films. Some discrepancies were noted, however, for these cases. The films. Some discrepancies were noted, however, for these cases. The equilibrium temperature behind ◦ equilibrium temperature behind 2the coated EVA/VO 2(M) was much aboutlower 53 °C,than which the window coated with EVA/VO (M)window was about 53 C,with which is significantly thatis lower that of the control (the use a window with the normal ofsignificantly the control much system (the than use of a window with system the normal EVAoffilm). The above effect was EVA not film). above effect 2was not the when EVA/VO 2(B) film was used. Again,tothe can the caseThe when EVA/VO (B) film wascase used. Again, the difference can be ascribed thedifference fact that the be2ascribed to the that the VO2(M) is a kind of thermo-chromic material whereas 2(B) was VO (M) is a kind offact thermo-chromic material whereas the VO2 (B) was not. This reflectsthe thatVO the main not. This reflectsto that main factor attributinginside to thethe decrease temperature inside the of model factor attributing thethe decrease of temperature model of house is heat reflectance the house is heat reflectance of the thermo-chromic VO 2(M)scattering particles, effect. and not due to light scattering effect. thermo-chromic VO2 (M) particles, and not due to light
Materials 2017, 10, 53 Materials 2017, 10, 53
15 of 20 15 of 19
16. Changes in temperature insidethe themodel model house of time irradiated with an IR an IR FigureFigure 16. Changes in temperature inside houseasasa afunction function of time irradiated with lamp. The window was coated with EVA based films. lamp. The window was coated with EVA based films.
3. Materials and Methods
3. Materials and Methods 3.1. Materials
3.1. Materials
Vanadiam pentoxide (V2O5, >98% pure) was obtained from Sigma-Aldrich Co., Ltd. (St. Louis,
MO, USA).pentoxide Hydrazine (V monochloride 2H4·HCl, >98%Sigma-Aldrich pure) was obtained Vanadiam pure) wasanalytically, obtained from Co.,from Ltd.Acros (St. Louis, 2 O5 , >98% (N organic Co., Ltd. (Morris Plains, NJ, USA). Hydrochloric acid (HCl, analytical pure) was obtained MO, USA). Hydrazine monochloride (N2 H4 ·HCl, analytically, >98% pure) was obtained from Acros Ltd. (Darmstadt, Germany). All of chemicals withoutpure) further purification. organicfrom Co.,Merck Ltd. Co., (Morris Plains, NJ, USA). Hydrochloric acid were (HCl,used analytical was obtained from EVA (Evaflex 150, containing 33 wt % vinyl acetate) was purchased from Mitsu-Dupont Co., Ltd. Merck Co., Ltd. (Darmstadt, Germany). All of chemicals were used without further purification. EVA (Tokyo, Japan). Bis(2,2,6,6-tetramethyl-4-piperidinyl) sebacate (Tinuvin 770), used as a primary (Evaflex 150, containing 33 wt % vinyl acetate) was purchased from Mitsu-Dupont Co., Ltd. (Tokyo, antioxidant, and 2,4-bis(1,1-dimethylethyl)phosphite (I) and dioctadecyl 3,30-thiopropionate Japan).(Irganox Bis(2,2,6,6-tetramethyl-4-piperidinyl) sebacate (Tinuvin a primary 802 FD), used as secondary antioxidants, were obtained770), fromused Cibaas Specialty Co., antioxidant, Ltd. (Basel, and 2,4-bis(1,1-dimethylethyl)phosphite andused dioctadecyl 3,30-thiopropionate (Irganox FD), used as Switzerland). The peroxide curing(I) agent in this study was a standard curing type, 802 2,5-bis(tertsecondary antioxidants, were obtained from Ciba Specialty (Basel,by Switzerland). TheLtd. peroxide butyldioxy)-2,5-dimethylhexane (Luperox 101), which Co., wasLtd. supplied Arkema Co., All chemicals werecuring used astype, received. curing(Philadelphia, agent used inPA, thisUSA). study was a standard 2,5-bis(tert-butyldioxy)-2,5-dimethylhexane (Luperox 101), which was supplied by Arkema Co., Ltd. (Philadelphia, PA, USA). All chemicals were 3.2. Synthesis of VO2 used as received. The precursor solution of vanadyl dichloride (VOCl2) was prepared by gradually addition of 12 mL of a solution of2 hydrazine monochloride (1.67 M in HCl) into a suspension of 7 g of V2O5, in 100 mL 3.2. Synthesis of VO of deionized water. After stirring for 24 h, the solution formed was filtered and a clear VOCl2 solution,
The precursor solution vanadyl dichloride (VOClThis prepared by gradually addition of 2 ) was in blue color with the pHof value of about 1, was obtained. VOCl 2 precursor was then filled in a 12 mL250 of mL a solution of hydrazine monochloride (1.67 M in HCl) into a suspension of 57h,g 8ofh, V2 O5 , Teflon tube before underwent a hydrothermal process in an autoclave at 200 °C for in 10012 mL of deionized water. After stirring for 24 h, the solution formed was filtered h and 48 h. After that, the precipitate was filtered and washed with deionized water forand threea clear followed by washing withthe ethanol for three times.1, The purified precipitate was dried under was VOCl2times, solution, in blue color with pH value of about was obtained. This VOCl 2 precursor vacuum 80 °C 3 h. Finally, it was underwent calcined at 700 °C for 3 h. The process similar procedures were used then filled in aat250 mLfor Teflon tube before a hydrothermal in an autoclave at 200 ◦ C the48 tungsten doped 2, using sodium tungstate as a dopant. In this case, 0.2, 0.4 and for 5 h,for8 preparing h, 12 h and h. After that,VO the precipitate was filtered and washed with deionized water 0.8 mL of the dopant (0.1 M aqueous solution) was firstly dropped into the V2O5 suspension, followed for three times, followed by washing with ethanol for three times. The purified precipitate was dried by adding the solution of hydrazine (1.67 M, 12 mL). After that, the similar procedures were followed. under vacuum at 80 ◦ C for 3 h. Finally, it was calcined at 700 ◦ C for 3 h. The similar procedures were used for preparing the tungsten doped VO2 , using sodium tungstate as a dopant. In this case, 0.2, 0.4 and 0.8 mL of the dopant (0.1 M aqueous solution) was firstly dropped into the V2 O5 suspension, followed by adding the solution of hydrazine (1.67 M, 12 mL). After that, the similar procedures were followed.
Materials 2017, 10, 53
16 of 20
3.3. Preparation of EVA and EVA/VO2 Films 3.3.1. Melt Mixing Process EVA was compounded through the mixing of the polymer pellets with various additives using a compounding recipe illustrated in Table 3. The compounding was carried out in an internal mixer (LabTech Engineering Co., Ltd., Bangkok, Thailand). The mixing temperature, mixing time, rotor speed and the fill factor used were 120 ◦ C, 15 min, 50 rpm, and 0.72, respectively. After that, the polymer was cooled and collected. Next, the EVA based films were fabricated with a hydraulic compression mold (LabTech Engineering Co., Ltd., Bangkok, Thailand) at 160 ◦ C for a given time (t90 = 30 min). Noteworthy, before carrying out the compression molding, an oscillating disk rheometer (Gotech, Taipei, Taiwan) was used to determine the time to reach 90% of the maximum torque by the rheometer (t90 ) at 160 ◦ C. This was used as the optimum cure time to vulcanize the EVA films. Thickness of the EVA based films prepared by compression molding process was 0.50 (±0.04) mm. Table 3. Compounding formulations of EVA composite films.
Chemicals (Trade Names) EVA Polymer (Evaflex 150) Primary Antioxidant (Tinnuvin 770) Secondary Antioxidant (Irganox PS 802FD) Peroxide Curing Agent (Luperox 101) VO2
Formulation/Content (phr) EVA-1
EVA-2
100 0.1 0.2 1.5 0
100 0.1 0.2 1.5 1
3.3.2. Solution Mixing Process Similar compounding recipes were used for preparing the EVA based films via a solution process. In this regard, the EVA solutions (10 wt %) were prepared by dissolving a given amount of EVA resin in 9 mL of chloroform, along with other chemicals as specified in Table 3. The solution was then kept stirring at room temperature for 3 h until its complete dissolution. After that, the polymer composite film was fabricated by pouring the solution onto a glass substrate (10 × 10 cm2 ). The casted film was dried at room temperature for 24 h or until reaching a constant weight. After that, the film was cured in a hot air oven, at 160 ◦ C for 30 min. The measured thicknesses of the solution casted EVA and EVA/VO2 films were 0.590 (±0.04) and 0.587 (±0.03) mm, respectively. 3.4. Characterizations The FTIR experiment was carried out in an attenuated FTIR (reflection) mode, using a Thermo instrument (iS5 model, Perkin Elmer, Spectrum one, Sacramento, CA, USA). The samples were scanned over wavenumbers ranging between 500 and 4000 cm−1 X-ray diffraction patterns of the synthesized VOx were recorded by an X-ray diffractometer (XRD, AXS D8-Discover, Bruker, Karlsruhe, Germany) in the 2θ range of 10◦ –80◦ using Cu-Kα radiation (λ = 1.54178 Å). The accelerating voltage and the current used were 40 kV and 40 mA, respectively. Morphology of the synthesized VO2 and the EVA composite films were examined using Scanning Electron Microscopy (SEM) technique. SEM experiment was operated using a JEOL (JSM 6610LV, JEOL, Peabody, MA, USA) machine, equipped with a secondary electron detector and energy dispersive X-ray detector (EDX). The accelerating voltages used was 10–30 kV. The sample was coated with gold prior to the SEM experiment in order to avoid charging effect during the electron beam scanning. The morphology and fringe pattern of the prepared particles were observed by high resolution transmission electron microscopy (HRTEM), using the JEOL JEM-2100 microscope (JEOL, Peabody, MA, USA) with an accelerating voltage of 200 kV. The TEM specimen was prepared by was dissolving 1 mg of the VO2 particle in 10 mL of DI water and was sonicated for 30 min. The solution was dropped on
Materials 2017, 10, 53
17 of 20
copper grid and was dried under room temperature. In addition to the TEM images, the attachment of selected area electron diffraction (SAED) of JEM-2100 was used to get the crystallographic information. 3.4.1. Thermal Analysis Phase transition temperatures of the synthesized VO2 , with and without doping, as well as glass transition temperature (Tg ) and melt transition temperature values of the polymer composites were investigated by using a DSC technique. Typically, about 15 mg of the sample was used and the DSC experiment was carried out with a NETZSCH (DSC 204, NETZSCH, Watertown, MA, USA) instrument under a nitrogen atmosphere at a heating rate of 10 ◦ C/min over temperatures ranging between 0 and 200 ◦ C. Percentage crystallinity (Xc ) of the samples was calculated according to Equation (4): (Xc ) = (∆Hf /∆Hf*) × 100
(4)
where ∆Hf* is the enthalpy of fusion of the perfect polyethylene (PE) crystal; ∆Hf is the enthalpy of fusion of the EVA samples, respectively. The value of ∆Hf* for PE is 277.1 J/g [36]. In addition, the weight composition and thermal stability of the EVA composite films were concurrently determined along with the DSC experiment, using a DSC/thermal gravimetric analysis (TGA) techniques. In this regard, the DSC/TGA experiment was carried out with a NETZSCH (TGA 209 model). Approximately 8 mg of each sample was used and the TGA experiment was scanned over temperatures ranging between 25 ◦ C and 900 ◦ C under nitrogen gas and a heating rate of 10 ◦ C/min. 3.4.2. Testing of the EVA Based Films The mechanical properties of the various EVA films were evaluated by tensile test, using Lloyd (LR 50 K, West Sussex, UK) instrument. Dumbbell-shaped specimens were prepared by cutting the dried films with a die, in accordance with the ASTM D638 standard. The gauge length used was 50 mm and the tensile test was carried out at a crosshead speed of 500 mm·min−1 , using the 1 kN load cell. At least five specimens were tested for each sample and the average values of Young’s modulus, tensile strength at break, and elongation at break were calculated using standard equations. Tensile toughness was also calculated by using the area underneath the stress-strain curve. Gel content of the cured EVA film was tested in accordance with the ASTM D-2765 standard method. About 1 g of the cured EVA films was immersed in xylene and then refluxed for 12 h. The specimens were then dried at 110 ◦ C for 10 h before weighing. Gel content was evaluated using the following Equation (5): Gel content = (W1 /W2 ) × 100 (5) where W1 = the swollen weight of the specimen after an immersion in xylene; W2 = the dried weight of the specimen. UV/Visible absorption spectra of various samples were recorded on a Shimadzu UV-3100 spectrophotometer (Shimadzu, Tokyo, Japan) over wavelengths ranging between 200 and 1000 nm. Visible light transmittance was determined in accordance with ISO 9050 standard method. Specifically, transmission of light through the polymer film was integrated over the wavelength range of 400–700 nm. Total reflectance measurements were obtained in the solar spectrum from 300 to 2500 nm at an incident angle of 15 degrees. The spectral data was integrated against Air Mass 1.5 global spectrum (ASTM E891) to yield weighted ordinates over the total spectral bandwidth. Five measurements were made of each sample and the weight averaged values were reported. 4. Conclusions Monoclinic VO2 particles, with and without doping were successfully prepared. The results were confirmed by XRD and DSC techniques. Thermo-chromic behaviors of the metal oxides were demonstrated by the changes in FTIR absorbance as a function of temperature. After mixing the VO2 (M)
Materials 2017, 10, 53
18 of 20
particles with EVA, thermo-chromic and heat reflectance behaviors of the composite materials still exist. The presence of VO2 (1 wt %) in EVA did not significantly affected physical and thermo-mechanical properties of the polymer films, regardless of the mixing processes used. On the other hand, type and conditions of the mixing processes strongly affected mechanical, thermal and optical properties of the EVA/VO2 films. The results summarized in Table 3 shows that tensile strength and modulus of the EVA based films prepared via the melt process was greater than those of which prepared by a solution process. Better properties of the former system were obtained at the expense of its percentage light transmittance. For the sake of better optical and thermo-chromic properties of the EVA/VO2 films, dispersion of the metal oxide in the polymer matrix has yet to be further improved. The optimum concentration of VO2 in the EVA based film also need to be investigated. Acknowledgments: This work has been supported by the Nanotechnology Center (NANOTEC), NSTDA, Ministry of Science and Technology, Thailand, through its program of Center of Excellence Network. The authors acknowledge the financial support provided by King Monkut’s University of Technology Thonburi through the “KMUTT 55th Anniversary Commemorative Fund”. Author Contributions: In this study, the concepts and design for the experiment are planned by Jatuphorn Wootthikanokkhan. Onruthai Srirodpai is responsible for the synthesis and characterizations of VO2 whereas Kitti Yuwawech is in charge for the compounding, fabrication and testing of EVA/VO2 composite films. The results obtained including FTIR, XPS, TEM, DSC-TGA were discussed by Saiwan Nawalertpanya, Vissanu Meeyoo and Jatuphorn Wootthikanokkhan. Conflicts of Interest: The authors declare no conflict of interest.
References 1. 2.
3.
4.
5. 6.
7. 8.
9.
10. 11. 12.
Pérez-Lombard, L.; Ortiz, J.; Pout, C. A review on buildings energy consumption information. Energy Build. 2008, 40, 394–398. [CrossRef] Miyazaki, H.; Kusumoto, N.; Sasaki, S.; Sakamoto, N.; Wakiya, N.; Suzuki, H. Thermochromic tungsten doped VO2 -SiO2 nano-particle synthesized by chemical solution deposition technique. J. Ceram. Soc. Jpn. 2009, 117, 970–972. [CrossRef] Miyazaki, H.; Yoshida, K.; Sasaki, S.; Sakamoto, N.; Wakiya, N.; Suzuki, H.; Ota, T. Fabrication of transition temperature controlled W-doped VO2 nano particles by aqueous solution. J. Ceram. Soc. Jpn. 2011, 119, 522–524. [CrossRef] Wang, N.; Liu, S.; Zeng, X.T.; Magdassi, S.; Long, Y. Mg/W-codoped vanadium dioxide thin films with enhanced visible transmittance and low phase transition temperature. J. Mater. Chem. C 2015, 3, 6771–6777. [CrossRef] Wang, S.; Liu, M.; Kong, L.; Long, Y.; Jiang, X. Recent progress in VO2 smart coatings: Strategies to improve the thermochromics properties. Prog. Mater. Sci. 2016, 81, 1–54. [CrossRef] Takahashi, I.; Hibino, M.; Kudo, T. Thermochromic properties of double-doped VO2 thin films prepared by a wet coating method using polyvanadate-based sols containing W and Mo or W and Ti. Jpn. J. Appl. Phys. 2001, 40, 1391–1395. [CrossRef] Burkhardt, W.; Christmann, T.; Meyer, B.K.; Niessner, W.; Schalch, D.; Scharmann, A. W- and F-doped VO2 films studied by photoelectron spectrometry. Thin Solid Films 1999, 345, 229–235. [CrossRef] Barreca, D.; Depero, L.E.; Franzato, E.; Rizzi, G.A.; Sangaletti, L.; Tondello, E.; Vettori, U. Vanadyl precursors used to modify the properties of vanadium oxide thin films obtained by chemical vapor deposition. J. Electrochem. Soc. 1999, 146, 551–558. [CrossRef] Guinneton, F.; Sauques, L.; Valmalette, J.C.; Cros, F.; Gavarri, J.R. Optimized infrared switching properties in thermochromic vanadium dioxide thin films: Role of deposition process and microstructure. Thin Solid Films 2004, 446, 287–295. [CrossRef] Kang, L.T.; Gao, Y.F.; Luo, H.J. A novel solution process for the synthesis of VO2 thin films with excellent thermochromic properties. ACS Appl. Mater. Interface 2009, 1, 2211–2218. [CrossRef] [PubMed] Kalagi, S.S.; Dalavi, D.S.; Pawar, R.C.; Tarwal, N.L.; Mali, S.S.; Patil, P.S. Polymer assisted deposition of electrochromic tungsten oxide thin films. J. Alloys Compd. 2010, 493, 335–339. [CrossRef] Peng, Z.; Jiang, W.; Liu, H. Synthesis and electrical properties of tungsten-doped vanadium dioxide nanopowders by thermolysis. J. Phys. Chem. C 2007, 111, 1119–1122. [CrossRef]
Materials 2017, 10, 53
13. 14.
15.
16.
17. 18. 19. 20.
21. 22. 23. 24.
25. 26.
27.
28.
29.
30. 31.
32. 33.
19 of 20
Zhang, Y.; Zhang, J.; Zhang, X.; Deng, Y.; Zhong, Y.; Huang, C.; Liu, X.; Liu, X.; Mo, S. Influence of different additives on the synthesis of VO2 polymorphs. Ceram. Int. 2013, 39, 8363–8376. [CrossRef] Zhou, J.; Gao, Y.; Liu, X.; Chen, Z.; Dai, L.; Cao, C.; Luo, H.; Kanahira, M.; Sun, C.; Yan, L. Mg-doped VO2 nanoparticles: Hydrothermal synthesis, enhanced visible transmittance and decreased metal-insulator transition temperature. Phys. Chem. Chem. Phys. 2013, 15, 7505–7511. [CrossRef] [PubMed] Lv, W.; Huang, D.; Chen, Y.; Qiu, Q.; Luo, Z. Synthesis and characterization of Mo–W co-doped VO2 (R) nano-powders by the microwave-assisted hydrothermal method. Ceram. Int. 2014, 40, 12661–12668. [CrossRef] Popuri, S.R.; Miclau, M.; Artemenko, A.; Labrugere, C.; Villesuzanne, A.; Pollet, M. Rapid hydrothermal synthesis of VO2 (B) and its conversion to thermochromic VO2 (M1). Inorg. Chem. 2013, 52, 4780–4785. [CrossRef] [PubMed] Zhang, C.; Cheng, J.; Zhang, J.; Yang, X. Simple and facile synthesis W-doped VO2 (M) powder based on hydrothermal Pathway. Int. J. Electrochem. 2015, 10, 6014–6019. Chen, L.; Huang, C.; Xu, G.; Miao, L.; Shi, J.; Zhou, J.; Xiao, X. Synthesis of thermochromic W-Doped VO2 (M/R) nanopowders by a simple solution-based process. J. Nanomater. 2012, 2012. [CrossRef] Shi, J.; Zhou, S.; You, B.; Wu, L. Preparation and thermochromic property of tunsten-doped vanadium dioxide particle. Sol. Energy Mater. Sol. Cells 2007, 91, 1856–1862. [CrossRef] Suzuki, H.; Yamaguchi, K.; Miyazaki, H. Fabrication of thermochromic composite using monodispersed VO2 coated SiO2 nanoparticles prepared by modified chemical solution deposition. Compos. Sci. Technol. 2007, 67, 3487–3490. [CrossRef] Valmalette, J.C.; Gavarri, J.R. High efficiency thermochromic VO2 (R) resulting from the irreversible transformation of VO2 (B). Mater. Sci. Eng. B 1998, 54, 168–173. [CrossRef] Ji, S.; Zhang, F.; Jin, P. Preparation of high performance pure single phase VO2 nanopowder by hydrothermally reducing the V2 O5 gel. Sol. Energy Mater. Sol. Cells 2011, 95, 3520–3526. [CrossRef] Ji, S.; Zhao, Y.; Zhang, F.; Jin, P. Direct formation of single crystal VO2 (R) nanorods by one-step hydrothermal treatment. J. Cryst. Growth 2010, 312, 282–286. [CrossRef] Zhang, Y.; Zhang, J.; Zhang, X.; Mo, S.; Wu, W.; Niu, F.; Zhong, Y.; Liu, X.; Huang, C.; Liu, X. Direct preparation and formation mechanism of belt-like doped VO2 (M) with rectangular cross sections by one-step hydrothermal route and their phase transition and optical switching properties. J. Alloys Compd. 2013, 570, 104–113. [CrossRef] Cao, C.; Gao, Y.; Luo, H. Pure single-crystal rutile vanadium dioxide powders: Synthesis, mechanism and phase-transformation property. J. Phys. Chem. 2008, 112, 18810–18814. [CrossRef] Zhang, S.; Shang, B.; Yang, J.; Yan, W.; Wei, S.; Xie, Y. From VO2 (B) to VO2 (A) nanobelts: First hydrothermal transformation, spectroscopic study and first principles calculation. Phys. Chem. 2011, 13, 15873–15881. [CrossRef] [PubMed] Xiao, X.; Zhang, H.; Chai, H.; Sun, Y.; Yang, T.; Cheng, H.; Chen, L.; Miao, L.; Xu, G. A cost-effective process to prepare VO2 (M) powder and films with superior thermochromic properties. Mater. Res. Bull. 2014, 51, 6–12. [CrossRef] Whittaker, L.; Wu, T.; Patridge, J.; Sambandamurthy, G.; Banerjee, S. Distinctive finite size effects on the phase diagram and metal–insulator transitions of tungsten-doped vanadium (IV) oxide. J. Mater. Chem. 2011, 21, 5580–5592. [CrossRef] Suchorski, Y.; Rihko-Struckmann, L.; Klose, F.; Ye, Y.; Alandjiyska, M.; Sundmacher, K.; Weiss, H. Evolution of oxidation states in vanadium-based catalysts under conventional XPS conditions. Appl. Surf. Sci. 2005, 249, 231–237. [CrossRef] Zhang, J.M.; Zhang, Y.; Xu, K.W.; Ji, V. General compliance transformation relation and applications for anisotropic cubic metals. Mater. Lett. 2008, 62, 1328–1332. [CrossRef] Popuri, S.R.; Artemenko, A.; Labrugere, C.; Miclau, M.; Villesuzanne, A.; Pollet, M. VO2 (A): Reinvestigation of crystal structure, phase transition and crystal growth mechanisms. J. Solid State Chem. 2014, 213, 79–86. [CrossRef] Oka, Y.; Ohtani, T.; Yamamoto, N.; Takada, T. Phase Transition and Electrical Properties of VO2 (A). Nippon Seramikkusu Kyokai Gakujutsu Ronbunshi 1989, 97, 1134–1137. [CrossRef] Li, M.; Kong, F.; Li, L.; Zhang, Y.; Chen, L.; Yan, W.; Li, G. Synthesis, field-emission and electric properties of metastable phase VO2 (A) ultra-long nanobelts. Dalton Trans. 2011, 40, 10961–10965. [CrossRef] [PubMed]
Materials 2017, 10, 53
34.
35. 36.
20 of 20
Liu, C.; Cao, X.; Kamyshny, A.; Law, J.W.; Magdassi, S.; Long, Y. VO2 /Si–Al gel nanocomposite thermochromic smart foils: Largely enhanced luminous transmittance and solar modulation. J. Colloid Interface Sci. 2014, 427, 49–53. [CrossRef] [PubMed] Zhou, Y.; Cai, Y.; Hu, X.; Long, Y. VO2 /hydrogel hybrid nanothermochromic material with ultra-high solar modulation and luminous transmission. J. Mater. Chem. A 2015, 3, 1121–1126. [CrossRef] Brandrup, J.; Immergut, E.H.; Grulke, E.A. Polymer Handbook; Wiley-Interscience: New York, NY, USA, 1989. © 2017 by the authors; licensee MDPI, Basel, Switzerland. This article is an open access article distributed under the terms and conditions of the Creative Commons Attribution (CC-BY) license (http://creativecommons.org/licenses/by/4.0/).