PRES: A Score Metric for Evaluating Recall-Oriented Information Retrieval Applications Walid Magdy
Gareth J.F. Jones
Centre for Next Generation Localization School of Computing Dublin City University Dublin 9, Ireland
Centre for Next Generation Localization School of Computing Dublin City University Dublin 9, Ireland
[email protected]
[email protected] wide range of IR tasks now under investigation, e.g. web search, question answering and structured document retrieval.
ABSTRACT Information retrieval (IR) evaluation scores are generally designed to measure the effectiveness with which relevant documents are identified and retrieved. Many scores have been proposed for this purpose over the years. These have primarily focused on aspects of precision and recall, and while these are often discussed with equal importance, in practice most attention has been given to precision focused metrics. Even for recalloriented IR tasks of growing importance, such as patent retrieval, these precision based scores remain the primary evaluation measures. Our study examines different evaluation measures for a recall-oriented patent retrieval task and demonstrates the limitations of the current scores in comparing different IR systems for this task. We introduce PRES, a novel evaluation metric for this type of application taking account of recall and the user’s search effort. The behaviour of PRES is demonstrated on 48 runs from the CLEF-IP 2009 patent retrieval track. A full analysis of the performance of PRES shows its suitability for measuring the retrieval effectiveness of systems from a recall focused perspective taking into account the user’s expected search effort.
Laboratory IR tests generally adopt the Cranfield evaluation framework paradigm [11]. Metrics used in these experiments generally measure how early relevant documents are retrieved with less focus on the system recall. While this situation is reasonable for precision-oriented applications, where a small number of relevant documents are sufficient to satisfy the user information need, they are less informative of system behaviour for recall-oriented tasks, where all relevant documents are required to be retrieved. However, while metrics such as, mean average precision (MAP) are not sufficient, they have been used as the central evaluation measures in applications such as patent retrieval [13, 25]. Viewing recall-oriented tasks purely in terms of measuring recall is actually rather simplistic. In practice the user’s effort expended in the search is often also a key consideration. Thus it can be important for an evaluation metric to take account not only of the recall, but also of the user’s effort as reflected in the ranks at which relevant items are retrieved. This paper describes a study analyzing the behaviour of current evaluation metrics when applied to recall-oriented IR tasks. The results of this analysis are used to motivate the proposal of a novel evaluation metric which combines recall with the quality of ranking of the retrieved relevant results. This allows us to distinguish between systems of similar recall giving higher scores to systems with better ranking of relevant documents. A study performed on the CLEF-IP 2009 patent retrieval task [25] shows the advantage of the new score over existing recall and precision metrics. The new score showed a 0.87 correlation to recall and 0.66 correlation to precision, which demonstrates how it reflects both recall and precision with more emphasis on recall. Additional analysis shows that the new score also works well for other recalloriented IR applications such as legal search when the number of relevant documents is typically very large.
Categories and Subject Descriptors H.3 [Information Storage and Retrieval]: H.3.3 Information Search and Retrieval; H.3.4 Systems and software – performance evaluation.
General Terms Measurement, Performance, Experimentation.
Keywords PRES; Recall-Oriented Information Retrieval; Patent Retrieval; Evaluation Metric
1. INTRODUCTION The objective of an information retrieval (IR) system is to retrieve relevant documents to satisfy user information needs. The evaluation of IR systems should thus test their ability to achieve this objective. Evaluation of IR systems has been the focus of much research in recent years [18, 29]. A number of evaluation methods and metrics have been proposed and explored for the
The remainder of the paper is organized as follows; Section 2 surveys background on IR evaluation scores; Section 3 explores the effectiveness of the current IR evaluation scores for measuring system performance for recall-oriented IR applications; Section 4 explains normalized recall, which is one of the classic IR evaluation scores used later to develop our new PRES evaluation metric, Section 5 formally introduces PRES; Section 6 explores the behaviour of PRES by use of illustrative examples and by testing it on the 48 CLEF-IP 2009 runs, in addition, it reports the behaviour of PRES for other tasks; Section 7 discusses the theoretical meaning of the score and compares it to the normalized recall; and finally, Section 8 concludes the paper with suggestions for possible future research directions.
Permission to make digital or hard copies of all or part of this work for personal or classroom use is granted without fee provided that copies are not made or distributed for profit or commercial advantage and that copies bear this notice and the full citation on the first page. To copy otherwise, or republish, to post on servers or to redistribute to lists, requires prior specific permission and/or a fee. SIGIR’10, July 19–23, 2010, Geneva, Switzerland. Copyright 2010 ACM 978-1-60558-896-4/10/07...$10.00.
611
evaluating similar IR tasks [25, 31]. The maximum number to be checked by the user is completely overlooked by most of the metrics considered so far, and is variable in measures such as the f-score [21]. The f-score combines recall with precision, and has been used for legal IR [20]; although this score includes recall, it has the problem that the number of documents to be retrieved is not fixed, which is often a practical concern of real users.
2. BACKGROUND While many evaluation metrics have been proposed for ad hoc type IR tasks, by far the most popular in general used is MAP [5]. The standard scenario for use of MAP in IR evaluation is to assume the presence of a collection of documents representative of a search task and a set of test topics (user queries) for the task along with associated manual relevance data for each topic. The relevance data for each topic is assumed to be a sufficient proportion of the documents from the collection that are actually relevant to that topic. “Sufficient” here relates to the fact that the actual number of relevant documents each topic is unknown without manual assessment of the complete document collection for each topic. Several techniques are available for determining sufficient relevant documents for each topic [8, 15, 26]. As its name implies, MAP is a precision metric, which emphasizes returning a greater number of relevant documents earlier. The impact on MAP of locating relevant documents later in the search of a ranked list is very weak, even if very many such documents have been retrieved. Thus while MAP gives a good and intuitive means of comparing systems for IR tasks emphasising precision, it will often not give a meaningful interpretation for recall focused tasks. A detailed analysis of the behaviour of MAP is described in [19]. Some other IR evaluation metrics are found to be more representative than MAP for other types of IR task. For example, Mean Reciprocal Rank (MRR) and Normalized Discounted Cumulative Gain (NDCG) are used for IR applications such as question answering and web search respectively [10, 28]. MRR measures performance when looking for one specific “known item” in a document collection [3]. Mean reciprocal rank is simply the inverse of the rank of the relevant document in the retrieved list. NDCG treats the relevant documents differently where the relevant documents are classified into classes according to the degree of relevance to the query. The objective is to find highly relevant documents earlier in the ranked list than less relevant ones. Additional IR evaluation scores have been introduced with the advent of new IR applications such as mean average generalized precision (MAgP) for structured document retrieval [1, 16] and GMAP which is the same as MAP but using geometric mean instead of the arithmetic mean, GMAP was used in the Robust Track at TREC [30]. Recently some scores have been introduced as alternatives to the MAP in order to overcome its shortcomings. Bpref, inferred average precision (infAP), and rank-biased precision (RBP) are examples of these scores. Bpref is designed to overcome the problem of incomplete relevance judgements [9]. infAP is designed for a similar purpose, where it collapses to MAP when judgements are complete [2]. RBP is designed to reflect a better modelling of user behaviour in terms of how deep they are willing to go down in the results list [19].
Other measurements such as retrievability and findability have been used for analyzing query formulation on the retrieval effectiveness [4, 6]. Although these scores give some analysis for the effect of query formulation on system performance, they fail to compare performance of different systems on a set of topics.
3. IR EVALUATION SCORES FOR RECALL-ORIENTED IR TASKS The simplest solution to measuring performance in a recall focused IR task is of course simply to evaluate the recall. However, as noted in the previous section, the problem of doing this is that it fails to reflect how early a system retrieves the relevant documents and thus the user effort involved. Although recall is the objective for such applications, the score should be able to distinguish between systems that retrieve relevant documents earlier than those that retrieve them later. To overcome this problem the f-score can be used, but at a fixed number of retrieved documents. However the same problem will arise, since applying it after retrieving N-documents for two systems that retrieved the same number of relevant documents, the f-score will be the same. This situation arises since the f-score is designed for classification tasks, but for recall-oriented IR applications, the problem is viewed as a ranking problem with a cut-off for a maximum number of documents to be checked Nmax. One modification for using the f-score is to calculate it as a combination between the recall and the average precision (AP) instead of using the absolute precision (equation 1). Such a modified f-score will reflect the system recall in addition to its average precision. However, while this captures the recall, it will have the same disadvantages for recall focused tasks with respect to AP which were noted earlier.
F 'β =
(1 + β 2 ) ⋅ ( AP ⋅ R ) β 2 ⋅ AP + R
(1)
where, AP: Average precision of a topic R: recall at a given number of retrieved documents β: weight of recall to precision Table 1 shows an illustrative example of how different metrics perform with four different IR systems when searching a collection for a single query. In this case it is known that there are four relevant documents, and it is assumed that the user is willing to check the top 100 documents retrieved by each system.
Similar to MAP, these IR evaluation metrics focus on measuring effectiveness at retrieving relevant documents earlier rather than on the system recall. While this is sufficient and reasonable for precision focused tasks, it is not suitable for tasks where the objective is to find “all” relevant documents, and in particular if the objective is to find all relevant documents with minimum effort for the user. In this kind of application, the user is willing to exert much effort to go deeper in the list in order to find relevant documents. Additionally, for recall-oriented IR applications the maximum number of documents to be checked by the user (the cut-off of the retrieved results) is also very important, since it has a direct impact on the cost of user effort and on recall. This concern was the reason behind using recall along with MAP in
Table1. Performance of different scores with different IR systems
612
Ranks of rel. docs
AP
Recall
F1
F’1
F’4
System 1
{1}
0.25
0.25
0.0192
0.25
0.25
System 2
{50, 51, 53, 54}
0.0481
1
0.0769 0.0917
System 3
{1, 2, 3, 4}
1
1
0.0769
System 4
{1, 98, 99, 100}
0.2727
1
0.0769 0.429
1
0.462 1 0.864
R norm =
In Table 1, system 3 is the prefect result with all relevant documents retrieved at the top ranks. System 1 has the lowest recall, while system 2 has moderate performance retrieving all relevant documents in the middle of the ranked list, System 4 has fair performance since it ranks one relevant document at rank 1, but achieves 100% recall only after checking the full list of 100 top results.
r − i A2 = 1− ∑ i ∑ A1 + A2 n( N − n)
(2)
where: ri: the rank at which the ith relevant document is retrieved, N: collection size, and n: number of relevant docs Normalized recall can be seen as a good representative measure for recall-oriented IR applications. This measure is greater when all relevant documents are retrieved earlier. However it requires ranking of the full collection. Applying Rnorm on collections of very large numbers of documents is infeasible, since it is nearly impossible to rank a collection of potentially many millions of documents. In addition, some relevant documents may have no match to the query leading to them not being retrieved at all.
From the table it can be seen that AP for system 1 is much higher than for system 2, which is unfair, since system 2 has been able to retrieve all relevant documents in the middle of the list, but system 1 has failed to retrieve more than one relevant document in the full list. The same situation arises when comparing system 4 to system 2, even though both systems have been able to retrieve the full list of relevant documents, system 2 has done so at much higher ranks than system 4.
One approximation to address this problem is to consider any relevant documents not retrieved in the top Nmax to be ranked at the end of the collection. Using this approximation to enable the calculation of Rnorm leads to its value being nearly equal to the system recall at a cutoff of Nmax. For example, for a collection of tens of thousands of documents and when retrieving the top 1000 documents; if recall at 1000 equals 50%, Rnorm with the previous approximation will equal 49.99% (Figure 2).
Recall and F1 score fail to differentiate between systems 2, 3, and 4, even though these systems have very different behaviour. F’1 does not focus on the recall, which is the objective of recalloriented applications. To emphasize recall a modified f-score, F’4 was tried giving recall four times the weight of the average precision (β = 4 in Equation 1). Initial inspection suggests that F’4 looks to be a good representation of the system performance, however on deeper analysis, it can be seen that system 4 is evaluated to be nearly twice as good as system 2, even though while it retrieves a relevant document at rank 1 no further relevant documents are found until the end of the list and that while system 2 failed to return any relevant documents among the first half of the list, all relevant documents are retrieved by rank 54. For two systems such as 2 and 4 for a recall-oriented task with users willing to check the first 100 documents, system 2 will give more confidence to the user that there is little chance of finding further relevant documents after rank 100; since the presence of low ranked relevant documents in system 4 may suggest that further ones are more to be present. Hence, F’4 fails to evaluate system 2 and system 4 fairly from the perspective of a recall-oriented application in practical usage.
Figure 2. Illustration of how Rnorm curve behaves with large document collections
5. PATENT RETRIEVAL EVALUATION SCORE (PRES) In the previous sections we demonstrated that current evaluation metrics do not represent system performance well in recalloriented IR applications. In this section, a novel score is presented based on modifications to the normalized recall measure. As outlined in the previous section, Rnorm can be seen as a good score for evaluating recall-oriented applications but only for small collections. Our new score “Patent Retrieval Evaluation Score” (PRES) is based on the same idea as the Rnorm but with a different definition for the worst case. The new assumption for the worst case is to retrieve all the relevant documents just after the maximum number of documents to be checked by user (Nmax). The idea behind this assumption is that getting any relevant document after Nmax leads to it being missed by the user, and getting all relevant documents after Nmax leads to zero recall, which is the theoretical worst case scenario. Applying this assumption in equation 2, N is replaced with Nmax+n, where n is the number of relevant documents. Any relevant document not retrieved in the top Nmax is assumed to be the worst case (Figure 3). For example, for a retrieved ranked list for a topic with 10 relevant documents (n = 10) and for which the user is willing to check the top 100 documents (Nmax = 100); the best case will be finding the 10 relevant documents at ranks {1, 2, … 10}, and the worst case will be finding them in the ranks {101, 102, … 110}, which means the user missing all the relevant documents. Assuming retrieval of only 7 relevant documents in the top 100,
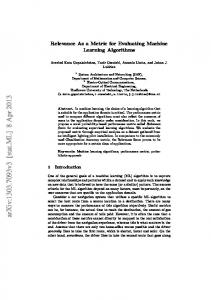
4. NORMALIZED RECALL (RNORM) One of the proposed IR evaluation metrics that has never found its way into wide usage is normalized recall (Rnorm) [21, 24], shown in Equation 2. This measures the effectiveness in ranking documents relative to the best and worst ranking cases, where the best ranking case is retrieval of all relevant documents at the top of the list, and the worst is retrieving them only after retrieving the full collection. Figure 1 shows an illustrative graph of how to calculate Rnorm, where Rnorm is the area between the actual and worst cases divided by the area between the best and worst cases.
A1 A2
Figure 1. Illustration of how Rnorm curve is bounded by the best and worst cases [21]
613
then the missing 3 relevant documents will be assumed to be found at ranks {108, 109, 110}.
Figure 3. PRES curve is bounded between the best case and the new defined worst case Figure 4(b). PRES vs MRR for different rank when n=1
Equation 3 shows the calculation of PRES. Equation 4 shows the direct calculation of the summation of ranks of relevant documents in the general case, when some relevant documents are missing in the top Nmax documents.
∑r
i
PRES = 1 −
∑
ri =
nR
∑
i =1
n
−
n +1 2
6. ANALYSIS OF PRES PERFORMANCE In this section, PRES is tested on the same sample examples as Table 1, with additional illustrative real samples from one run in the CLEF-IP 2009 patent retrieval task. In addition, the average performance is tested on real examples of 48 participants’ runs from CLEF-IP 2009. The aim of the CLEF-IP track is to automatically find prior art citations for patents. The topics for this task are patents filed in the period after 2000, and the searched collection contains about one million patents filed in the period from 1985 to 2000 [25]. The objective is to use some text from each patent topic to automatically retrieve all cited patents found in the collection. The design of the patent test collection assumes that filed patents examined by the patent office for novelty, are the training and test collections, and that the patent citations, which are mostly added by the patent office, are considered as the relevant document set [13, 14, 25].
(3)
N max
ri + nR ( N max + n ) −
nR ( nR − 1 ) 2
(4)
where, R: Recall (number of relevant retrieved docs in the 1st Nmax docs) From equation 3, it can be inferred that PRES is a function of the recall of the system, the ranks of the retrieved documents, and the maximum number of results to be checked by user. For a given Nmax, PRES behaves as shown in Figure 4(a). For recall = R, the PRES value ranges from R, when retrieving all relevant document on the top of the list, to nR2/Nmax when retrieving them at the bottom of the list. For the special case where the number of relevant documents for a topic is one (n=1), PRES will have a linear characteristic. Figure 4(b) shows the difference between PRES and MRR performance with different ranks for the case where n=1. In this case PRES could be used as an alternative measure for evaluating question answering instead of MRR. For example, if the user is willing to check the first 10 answers for a question before reformulating it [10], PRES with Nmax = 10 could be used instead as it will assign a low penalty to systems that retrieve the relevant document within the first 10 ranks, and a full penalty to systems that retrieve the document afterward.
6.1. Performance with Sample Examples Table 2. Performance of PRES with different IR systems Ranks of rel. docs
AP
Recall
PRES
System1
{1}
0.25
0.25
0.25
System2
{50, 51, 53, 54}
0.0481
1
0.51
System3
{1, 2, 3, 4}
1
1
1
System4
{1, 98, 99, 100}
0.2727
1
0.28
Table 2 shows how PRES performs with the sample examples presented in Table 1. From Table 2, it can be seen that PRES is a better representative measure for the system performance as a combination between system recall and average ranking of relevant documents. Some real samples of topics from one run of the CLEF-IP 2009 track are presented in Table 3 with maximum number of results to be checked by user Nmax = 1000. In Tables 2 and 3, PRES is always less than or equal to recall, i.e. PRES is a portion of the recall depending on the quality of ranking of the relevant documents relative to Nmax. For example, getting a relevant document at rank 10 will be very good when Nmax=1000, good when Nmax=100, but bad when Nmax = 15, and very bad when Nmax=10. Systems with higher recall can achieve a lower PRES value when compared to systems with lower recall but better average ranking. This is clear in Table 3, where one topic with 67% recall has 63.6% PRES because of good ranking (41 and 54 among 1000), and one topic with 100% recall got 52.5% for PRES because of the moderate ranking where 60% of them are below rank 500 out of 1000.
Figure 4(a). PRES performance with various recalls and rank
614
Comparing PRES to average precision (AP) for the samples in Table 3, it can be seen that AP is more sensitive to how early the first relevant document is found regardless of the number of documents to be checked by user. However, PRES is more sensitive to the average ranking of the relevant retrieved documents as a whole relative to the maximum number of documents the user is willing to check. The last sample topic in the table has a PRES of 96.43% even though relevant documents are not ranked in the top 10 or even 20 results. The reason is that Nmax=1000, and the ranks {32, 35, 46} are considered relatively good compared to this number. Nevertheless, when calculating PRES with Nmax=100, the PRES value will be 64.33% which represents the average ranking of the relevant documents relative to the maximum number of documents to be checked.
than second run, 2) the second run is statistically significant better than 1st run, and 3) Both runs are statistically indistinguishable [7]. Wilcoxon significance test with confidence level of 0.95 was used for comparing each of the two runs [12]. Comparing 48 runs in a pair wise manner led to 1,128 comparisons. The agreement of scores for each comparison is plotted in Figure 7.From Figure 7, it is clear that PRES is an intermediate score between recall and MAP. In addition, in a small number of cases (1%) PRES disagrees when recall and MAP agree. These situations are mainly for examples where recall and MAP agree that system 1 (1st run) is better than system 2 (2nd run), but PRES shows that both systems have the same performance, or when recall and MAP agree that two systems are statistically indistinguishable, but PRES prefers one over the other. Calculating the Kendall’s tau correlation between the ranking of runs according to the three scores [17], it is found that the correlations are as follows: MAP and recall = 0.56, PRES and recall = 0.87, and PRES and MAP = 0.66. This emphasizes that PRES lies between MAP and recall with a bias towards recall.
Table 3. AP/R/PRES performance with real samples of topics Ranks of rel. docs {98,296}
N 41
R 0.05
AP ~0
PRES 0.039
{23,272,345} {2,517,761} {660,741} {41,54} {1,781} {1,33,354,548,733,840,841}
6 6 3 3 3 7
0.5 0.5 0.667 0.667 0.667 1
0.01 0.085 0.001 0.021 0.334 0.157
0.394 0.288 0.201 0.636 0.407 0.525
{32,35,46}
3
1
0.051
0.964
Table 4. MAP/Recall/PRES for 48 submissions in CLEF-IP Run ID R01 R02 R03 R04 R05 R06 R07 R08 R09 R10 R11 R12 R13 R14 R15 R16 R17 R18 R19 R20 R21 R22 R23 R24
6.2. PRES Average Performance PRES was tested on 48 different submissions from 15 participants to the CLEF-IP 2009 Patent Track [25]. Table 4 shows the score for each submission in MAP, recall, and PRES. Participant IDs are anonymous and the number of topics for each participant used was 400 instead of the official 500 in order to further mask participant identities and to avoid violating the privacy of any of the participants. For all topics, Nmax = 1000 was used. The average number of relevant documents per topic is 6 (navg = 6). From the results, it can be seen that PRES reflects the recall with the average quality of the ranking, which is mainly reflected in the MAP. Run 21 (R21) which achieved the highest MAP and recall also achieved the highest PRES, with the same behaviour being observed for the lowest scoring runs. However, some submissions which achieved high precision but low recall were punished and received only a moderate PRES score. For systems which achieved high recall but low precision (which reflects bad ranking such as system R18), the PRES score was moderate too. Figure 5 plots the three scores of the same 48 submissions sorted by PRES from low to high values. From Figure 5, it can be noted that PRES is a good single score that can represent both the precision and recall of each run. Figure 6 shows the change in ranking of the submissions with the three scores. It can be seen that ranking using PRES is more biased towards recall, than MAP. However, this is not always the case, for example R12 has moderate ranking in both recall and MAP, but lower ranking in PRES, which is due to the fact that MAP is more sensitive to the high ranking of some of the relevant documents, but PRES is dependent on relative average ranking of “All” relevant documents to Nmax. Figure 6 shows that the scores have high agreement on the ranking of systems with very high or very low performances.
0.8
MAP
Recall
PRES
0.077 0.087 0.084 0.053 0.000 0.000 0.000 0.000 0.071 0.088 0.087 0.088 0.065 0.068 0.064 0.020 0.067 0.033 0.105 0.003 0.266 0.028 0.087 0.011
0.530 0.617 0.609 0.219 0.020 0.016 0.012 0.016 0.454 0.533 0.489 0.534 0.508 0.467 0.434 0.197 0.584 0.656 0.600 0.051 0.760 0.256 0.728 0.069
0.434 0.499 0.497 0.213 0.011 0.009 0.007 0.009 0.369 0.430 0.404 0.430 0.406 0.363 0.348 0.148 0.463 0.490 0.529 0.040 0.691 0.200 0.603 0.054
Run ID R25 R26 R27 R28 R29 R30 R31 R32 R33 R34 R35 R36 R37 R38 R39 R40 R41 R42 R43 R44 R45 R46 R47 R48
MAP
Recall
PRES
0.064 0.084 0.097 0.091 0.082 0.092 0.081 0.078 0.085 0.082 0.114 0.108 0.114 0.107 0.113 0.107 0.079 0.103 0.091 0.091 0.106 0.102 0.104 0.102
0.492 0.511 0.514 0.514 0.436 0.559 0.568 0.476 0.457 0.427 0.572 0.553 0.572 0.553 0.575 0.560 0.547 0.555 0.575 0.574 0.616 0.611 0.589 0.587
0.392 0.431 0.447 0.442 0.373 0.469 0.460 0.391 0.379 0.354 0.496 0.480 0.494 0.479 0.498 0.483 0.447 0.466 0.475 0.474 0.507 0.504 0.484 0.484
MAP Recall
0.7
PRES
0.6 0.5 0.4 0.3 0.2 0.1 0 0
In order to check the agreement of the three scores, pair wise comparison of submissions was carried out with each two runs being compared: 1) the first run is statistically significantly better
8
16
24
32
40
48
Figure 5. MAP/Recall/PRES for 48 submissions in CLEF-IP 2009 sorted by PRES
615
Ranked by MAP
Ranked by PRES1
6.3. Performance versus Different Cut-off Values (Nmax)
Ranked by Recall
Cut-off value of documents to be checked is considered one of the key variables that affect the value of PRES. It is the same case for recall, as the more documents that are retrieved the more possibility there is to find further relevant documents, hence the higher the system recall. Additionally, for PRES Nmax affects its value even if no more relevant documents are found, since for different cut-offs, the relative ranking of relevant documents is different. This effect has been shown earlier in one of the examples (section 6.1). For recall-oriented applications, the actual number of documents to be checked by the user is typically higher than other IR applications. This number can exceed a hundred documents in the case of a patent examiner before he/she thinks of reformulating the query1. Different factors can affect the decision to stop checking for relevant documents; one of these can be the failure to find a relevant document for some while in the list, or the user can decide to check a fixed number of documents, but when less relevant documents are found while checking the list the user will generally move more quickly through the list leading to more rapid task completion. For both scenarios the effort the user exerts to find a relevant document will be greater as long as he/she continues to find relevant documents deep in the list. This is the reason of why PRES penalizes finding documents deeper in the list of the Nmax ranked results. MAP @ Nmax = {10, 20, ... 100}
0.09 0.08 0.07
MAP
0.06 0.05 0.04 0.03
R12
0.02
R18
0.01
R23
0 10
20
30
40
50
60
70
80
90
100
Nmax
Figure 6. Ranking change of 48 submissions according to MAP/PRES/Recall
Recall @ Nmax = {10, 20, ... 100}
0.45 0.4 0.35
Recall
0.3 0.25 0.2 0.15
R12
0.1
R18
0.05
R23
0 10
20
30
40
50
60
70
80
90
100
Nmax PRES @ Nmax = {10, 20, ... 100}
0.35 0.3
PRES
0.25 0.2 0.15 0.1
R12
0.05
R18 R23
0
Figure 7. Agreement chart of MAP/Recall/PRES on pair wise comparison of 48 submissions
10
20
30
40
50
60
70
80
90
100
Nmax
Figure 8. MAP/Recall/PRES performance for different values of Nmax applied on three sample runs
1
This information is from a personal communication with patent examiners in the European Patent Office (EPO)
616
submitted lists of many systems. For an accurate evaluation using PRES, Nmax should be carefully selected according to the user and application models, and for a recall-oriented application, Nmax should be higher than n
Figure 8 shows the effect of changing the value of Nmax on MAP, recall, and PRES. Three sample runs from CLEF-IP 2009 (R12, R18, and R21) were selected to examine the variation of the three scores at different values of Nmax. In figure 8, the effect of finding more relevant documents on MAP is very poor regardless of the number of documents to be checked by the user and regardless of the number of relevant documents found deeper in the list. PRES and recall performances look similar in general, however, for the example, when Nmax = 10, PRES judges R12 to be better than R23, but recall is judged to be the opposite. Furthermore, for R18 the recall curve with Nmax has a higher slope than the PRES curve. This returns us to the issue of recall neglecting the ranking of documents by recall, which is taken into account by PRES.
Figure 9. PRES curve for situations when n > Nmax
7. THEORETICAL DISCUSSION
6.4. PRES when n > Nmax
In the previous sections, it was shown how PRES was derived from normalized recall (Rnorm) after changing the worst case scenario definition. Although both scores are very similar in characteristics and calculations, this small modification led to a significant change in the performance and the theoretical meaning of the PRES score.
Usually for recall-oriented applications, when all or at least a significant portion of the relevant documents are required to be retrieved, the user will check a number of retrieved results higher than the expected number of relevant documents. However, this scenario can be neglected in some applications where the number of relevant documents is very high and the task is to evaluate different IR systems for the ability to find the largest number of relevant documents. This is the exact scenario in recall-oriented IR applications such as legal search. The legal track at TREC seeks to evaluate the ability of different systems to retrieve relevant legal documents [27]. The number of relevant documents for a topic can reach tens of thousands. Several scores and methods have been proposed to overcome this problem by estimating the number of relevant documents and the actual system precision and recall.
Normalized recall was first proposed by Rocchio in 1964 [24] as an IR evaluation score that is independent of the cut-off value of the retrieved documents, as it requires (as was shown in section 3) returning all documents of the collection ranked by relevance. In 1969, Robertson showed that Rnorm is the same area under the recall-fallout curve (operating characteristic curve), which makes Rnorm equal to the probability of pairwise error in ranking, and which leads to Rnorm = 0.5 for random ranking of documents in the collection [22]. This is not the case for PRES, where the PRES value is directly dependent on the cut-off value. Furthermore, random ranking of documents will eventually lead to PRES = 0 for the current common collection sizes, as the probability of finding a relevant document = n/N, where N is the collection size which is typically millions or billions of documents in case of web search.
In this subsection, the behaviour of PRES is studied for cases like this where the number of relevant documents (n) is higher than the maximum number of documents to be checked by the user (Nmax). As shown in Figure 9, the best case will never be applicable as retrieving all relevant documents at the top ranks will exceed the cut-off value, and the user will never be able to achieve 100% recall. However, the calculation of PRES in this case can still be applied without any modification. As mentioned before, for a recall = R, PRES will range from nR2/Nmax, to R. The only difference here is that the maximum applicable R will be Nmax/n, which is the case when all the retrieved documents are relevant.
Normalized recall was a suitable evaluation measure at the time it was introduced, but with the current collection sizes and type of applications, Rnorm is found to be an impractical measure for operational use. This is the reason why it has never found its way into wide spread usage. PRES can be considered as an IR evaluation measure that has the characteristics of the classic Rnorm, but with a different meaning. PRES is designed specifically for recall-oriented applications to emphasize the system quality in retrieving the most significant number of relevant document as early as possible within a specific number of results in a ranked list.
Although the PRES calculation is still applied, the PRES value will have some limitation in expressing the general system performance. Hence, estimated an PRES can be calculated to approximate the full performance of the system as shown in Equation 5.
PRES est =
R max =
PRES Rmax
N max n
8. CONCLUSION & FUTURE WORK
(5)
, ( N max ≤ n )
In this paper, a study of recall-oriented applications has been described and a novel score “PRES” has been presented that is designed for these applications. The score is a refinement of the normalized recall score. It has been tested and compared to the most widely used IR scores on a patent retrieval task. Illustrative samples and real data examples demonstrated the effectiveness of the new score. The score reflects the system recall combined with the quality of relative ranking of retrieved relevant documents within the maximum numbers of documents to be checked by a user. The PRES value varies from R to nR2/Nmax according to the average quality of ranking of relevant documents; hence it can be
(6)
where, PRESest: estimated PRES, Rmax: maximum possible recall (Rmax = 1 when Nmax ≥ n) While this provides an estimate of system performance, it is advisable only to use PRESest in evaluation campaigns where there are a large number of runs with a very large number of relevant documents and it is impractical to evaluate the very long
617
[13] Fujii, A., Iwayama, M., and Kando, N. Overview of Patent Retrieval Task at NTCIR-4. In Proceedings of the 4th NTCIR Workshop, 2004. [14] Graf, E., and Azzopardi, L. A methodology for building a patent test collection for prior art search. In Proceedings of the 2nd EVIA Workshop, pages 60-71, 2008. [15] Jordan, C., Watters, C., and Gao, Q. Using controlled query generation to evaluate blind relevance feedback algorithms. In Proceedings of JCDL ’06, pages 286-295, 2006. [16] Kamps, J., Pehcevski, J., Kazai, G., Lalmas, M., and Robertson, S. INEX 2007 evaluation measures. In Proceedings of INEX ’07, pages 24-33, 2007. [17] Kendall, M. A new measure of rank correlation. Biometrika, 30(1/2):81-93, 1938. [18] Mandl, T. Recent developments in the evaluation of information retrieval systems: moving toward diversity and practical applications. Informatica, 32:27-38, 2008. [19] Moffat, A., and Zobel, J. Rank-biased precision for measurement of retrieval effectiveness. ACM Trans. Inf. Syst. 27(1):1-27, 2008. [20] Oard, D. W., Hedin, B., Tomlinson, S., and Baron, J. R. Overview of the TREC 2008 legal track. In Proceedings of TREC 2008, 2008. [21] van Rijsbergen, C. J. Information Retrieval, 2nd edition. Butterworths, 1979. [22] Robertson S. E. The parametric description of the retrieval tests. Part 2: Overall measures. Journal of Documentation, 25(2):93-107, 1969. [23] Robertson, S. A new interpretation of average precision. In Proceedings of SIGIR ’08, pages 689-690, 2008. [24] Rocchio J. Performance indices for document retrieval systems. In Information storage and retrieval, Computation Laboratory of Harvard University, Cambridge, MA, 1964. [25] Roda G., Tait J., Piroi F., and Zenz V. CLEF-IP 2009: retrieval experiments in the Intellectual Property domain. In Proceedings of CLEF ’09, 2009. [26] Tague J., Nelson, M., and Wu, H. Problems in the simulation of bibliographic retrieval systems. In Proceeding of SIGIR ’81, pages 66-71, 1981. [27] Tomlinson S., Oard, D. W., Baron, J. R., and Thompson, P. Overview of the TREC 2007 Legal Track. In Proceedings of TREC 2007, 2007. [28] Voorhees, E. M., and Tice, D. M. The TREC-8 Question Answering Track Evaluation. In Proceedings of TREC 1999, pages 77-82, 1999. [29] Voorhees, E. M. The Philosophy of Information Retrieval Evaluation. In Evaluation of Cross-Language Information Retrieval System, Proceedings of CLEF ’02, pages 355-370, 2002. [30] Voorhees, E. M. The TREC robust retrieval track. In SIGIR Forum 39(1):11-20, 2005. [31] Xue, X., and Croft W. B. Automatic Query Generation for Patent Search. In Proceedings of CIKM’09, pages 20372040, 2009. [32] Zhu, J., and Tait, J. A proposal for chemical information retrieval evaluation. In In Proceedings of the 1st ACM Workshop on Patent Information Retrieval at CIKM ’08, pages 15-18, 2008.
seen as a function of system recall, ranking of relevant documents, and the maximum number of documents to be checked by a user (which directly affects the recall and relative ranking). In future work, the utility of PRES as a measure for the patent retrieval could be investigated further by direct consultations with professional patent experts. Such a study should have a practical and theoretical analysis of the user model represented by PRES (similar to the study in [23]). Additionally, PRES could be applied to other recall-oriented IR applications such as chemical IR and legal IR [32], which can be characterized by different experimental environments, different users, and different numbers of relevant documents. Although the performance of PRES has been analyzed for legal search in this paper, real sets of runs are needed in order to explore its behaviour on this type of data.
9. ACKNOWLEDGMENTS This research is supported by the Science Foundation Ireland (Grant 07/CE/I1142) as part of the Centre for Next Generation Localisation (CNGL) project.
10. REFERENCES [1] Ali M. S., Consens, M. P., Kazai, G., and Lalmas, M. Structural relevance: A common basis for the evaluation of structured document retrieval. In Proceedings of CIKM ’08, pages 1153-1162, 2008. [2] Aslam J. A., and E. Yilmaz. Estimating average precision with incomplete and imperfect judgments. In Proceedings of CIKM’ 06, page102-111, 2006. [3] Azzopardi L., de Rijke, M., and K. Balog. Building simulated queries for known-item topics: an analysis using six european languages. In Proceedings of SIGIR ’07, pages 455-462, 2007. [4] Azzopardi, L. and Vinay, V. Retrievability. An evaluation measure for higher order information access tasks. In Proccedings of CIKM ’08, pages 1425-1426, 2008. [5] Baeza-Yates, J., and Ribeiro-Neto, B. Modern Information Retrieval. Addison Wesley, 1999. [6] Bashir, S., and Rauber A. Analyzing Document Retrievability in Patent Retrieval Settings. In Proceedings of Database and Expert Systems Applications (DEXA 2009), pages 753-760, 2009. [7] Buckley, C., and Voorhees, E. M. Evaluating Evaluation Measure Stability. In Proceedings of SIGIR 2000, pages 3340, 2000. [8] Buckley, C., Dimmick, D., Soboroff, I., and E. Voorhees. Bias and the limits of pooling. In Proceedings of SIGIR ’06, pages 619-620, 2006. [9] Buckley, C., and Voorhees, E. M. Retrieval evaluation with incomplete information. In Proceedings of SIGIR ’04, pages 25-32, 2004. [10] Carterette, B., Bennett, P. N. Chickering, D. M., and Dumais, S. T. Here or There: Preference Judgments for Relevance. In Proceedings of ECIR ’08, pages 16- 27, 2008. [11] Cleverdon, C. The Cranfield Tests on Index Language Devices. In: Sparck Jones, K. and Willett, P. (eds.). Readings in Information Retrieval, pages 47-59, Morgan Kaufmann, 1997. [12] Hull, D. Using statistical testing in the evaluation of retrieval experiments. In Proceedings of SIGIR ’93, pages 329-338, 1993.
618