lecture by Ben Santer, UoMichigan, March 27, 2008, AOSS 480
How Do We Know That Human Activities Have Influenced Global Climate? Ben Santer Program for Climate Model Diagnosis and Intercomparison Lawrence Livermore National Laboratory, Livermore, CA 94550 Email:
[email protected]
Climate Change: The Move to Action Lecture to Prof. Richard B. Rood’s Class (AOSS 480 // NRE 501) University of Michigan, Ann Arbor, March 27, 2008
1
lecture by Ben Santer, UoMichigan, March 27, 2008, AOSS 480
Key result of previous IPCC reports: There is growing evidence for a human “fingerprint” on global climate
“The balance of evidence suggests a discernible human influence on global climate” “There is new and stronger evidence that most of the warming observed over the last 50 years is attributable to human activities”
“Most of the observed increase in globally averaged temperatures since the mid-20th century is very likely* due to the observed increase in anthropogenic greenhouse gas concentrations” 2
lecture by Ben Santer, UoMichigan, March 27, 2008, AOSS 480
Structure of talk
z Climate Change 101 z How do we study the causes of climate change? z A few common myths about climate change z Conclusions and some personal thoughts
3
Section 1: Climate Change 101
lecture by Ben Santer, UoMichigan, March 27, 2008, AOSS 480
Natural mechanisms influence climate
Natural mechanisms z
Changes in the Sun
z
Changes in the amount of volcanic dust in the atmosphere
z
Internal variability of the coupled atmosphere-ocean system
4
Section 1: Climate Change 101
lecture by Ben Santer, UoMichigan, March 27, 2008, AOSS 480
Human factors also influence climate Non-natural mechanisms z
Changes in atmospheric concentrations of greenhouse gases
z
Changes in aerosol particles from burning fossil fuels and biomass
z
Changes in the reflectivity (albedo) of the Earth’s surface
5 Smoke from fires in Guatemala and Mexico (May 14, 1998)
Section 1: Climate Change 101
lecture by Ben Santer, UoMichigan, March 27, 2008, AOSS 480
Recent changes in carbon dioxide are largely humaninduced
Carbon dioxide is the most important greenhouse gas produced by human activities Atmospheric CO2 has increased from a pre-industrial value of about 280 parts per million (ppm) to 379 ppm in 2005 The atmospheric concentration of CO2 in 2005 exceeds by far the natural range (180 to 300 ppm) over the last 650,000 years Fossil fuel use is the primary source of the increased concentration of CO2 since the pre-industrial period
Source: IPCC AR4 (2007)
Section 1: Climate Change 101
lecture by Ben Santer, UoMichigan, March 27, 2008, AOSS 480
Average surface temperature change (°C)
Models can perform the “control experiment” that we can’t do in the real world
Meehl et al., J. Climate (2004)
7
Section 1: Climate Change 101
lecture by Ben Santer, UoMichigan, March 27, 2008, AOSS 480
We routinely test how well current climate models simulate: z Response to external “forcings” on a range of time scales ¨ Today’s annual mean climate ¨ The diurnal cycle ¨ The seasonal cycle ¨ The response to massive volcanic eruptions ¨ Ocean uptake of products of atmospheric tests of nuclear weapons ¨ The climate changes of the past 30 to 150 years ¨ Climates of the “deep past” (e.g., the last Ice Age)
z “Unforced” behavior ¨ Weather ¨ Modes of natural climate varibility (El Niño, North Atlantic Oscillation, etc.) 8
Section 1: Climate Change 101
lecture by Ben Santer, UoMichigan, March 27, 2008, AOSS 480
One test: Evaluating the relative skill of coupled models in simulating the seasonal cycle “Worst”
Latent heat flux at surface Sensible heat flux at surface Surface temperature Reflected SW radiation (clear sky) Reflected SW radiation Outgoing LW radiation (clear sky) Outgoing LW radiation Total cloud cover Precipitation Total column water vapor Sea-level pressure Meridional wind stress Zonal wind stress Meridional wind at surface Zonal wind at surface Specific humidity at 400 mb Specific humidity at 850 mb Meridional wind at 200 mb Zonal wind at 200 mb Temperature at 200 mb Geopotential height at 500 mb Meridional wind at 850 mb Zonal wind at 850 mb
“Best” V
T
U
S
R
P
Q
N
O
L
M
K
I
J
H
F
G
E
D
C
A
B
Mean
Median
Temperature at 850 mb
CMIP3 (IPCC) model
IPCC AR4 Model
Gleckler, Taylor, and Doutriaux, Journal of Geophysical Research (2008)
9
Section 1: Climate Change 101
lecture by Ben Santer, UoMichigan, March 27, 2008, AOSS 480
Another test: Do coupled models capture the atmospheric temperature changes after major volcanic eruptions?
10
Section 1: Climate Change 101
lecture by Ben Santer, UoMichigan, March 27, 2008, AOSS 480
Testing how well models simulate climate variability Average model water vapor variability is slightly larger than in observations
Santer et al., Proceedings of the National Academy of Sciences (2007)
11
Section 1: Climate Change 101
lecture by Ben Santer, UoMichigan, March 27, 2008, AOSS 480
Can we evaluate model performance in simulating future climate change?
Figure TS.26
12
Section 2: Studying the Causes of Climate Change
lecture by Ben Santer, UoMichigan, March 27, 2008, AOSS 480
Structure of talk
z Climate Change 101 z How do we study the causes of climate change? z A few common myths about climate change z Conclusions and some personal thoughts
13
Section 2: Studying the Causes of Climate Change
lecture by Ben Santer, UoMichigan, March 27, 2008, AOSS 480
Multiple lines of evidence on which “discernible human influence” conclusions are based 1. “Basic physics” evidence ¨ Physical understanding of the climate system and the heat-trapping properties of greenhouse gases 2. Circumstantial evidence ¨ Qualitative agreement between observed climate changes and model predictions of human-caused climate changes (warming of oceans, land surface, and troposphere, stratospheric cooling, water vapor increases, etc.) 3. Paleoclimate evidence ¨ Temperature reconstructions enable us to place the warming of the 20th century in a longer-term context 4. Fingerprint evidence ¨ Rigorous statistical comparisons between modeled and observed patterns of climate change 14
Section 2: Studying the Causes of Climate Change
lecture by Ben Santer, UoMichigan, March 27, 2008, AOSS 480
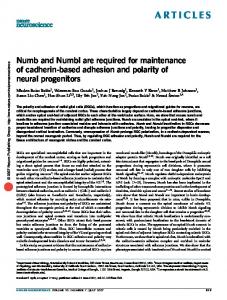
What is “climate fingerprinting”?
z Strategy:
Search for a computer model-predicted pattern of climate change (the “fingerprint”) in observed climate records
z Assumption:
Each factor that influences climate has a different characteristic signature in climate records
z Method:
Standard signal processing techniques
z Advantage:
Fingerprinting allows researchers to make rigorous tests of competing hypotheses regarding the causes of recent climate change
15
Section 2: Studying the Causes of Climate Change
lecture by Ben Santer, UoMichigan, March 27, 2008, AOSS 480
Different factors that influence climate have different “fingerprints” 10
10
24
50
20
50
20
100
16
100
16
200
12
200
12
300
8
500 700 1000 90N 10
4 60N
30N
Eq
30S
60S
90S
300
Pressure (hPa)
3. Well-mixed greenhouse gases
24
60N
30N
Eq
30S
60S
28 25
24 20
100
16
100
16
200
12
200
12
8
500 700 1000 90N 10
4 60N
30N
Eq
30S
60S
90S
300
8
500 700 1000 90N
4 60N
30N
Eq
30S
60S
90S
10 28
25
Pressure (hPa)
5. Sulfate aerosol particles
28
24
25
50
20
50
20
100
16
100
16
200
12
200
12
8
300
300 500 700 1000 90N
4 60N -1
Santer et al., CCSP, 2007
6. 1st five factors combined
90S
20
300
4. Ozone
4
50
50
2. Volcanoes
8
500 700 1000 90N 10
28 25
Height (km)
24
28 25
Height (km)
25
Height (km)
1. Solar
Pressure (hPa)
28
-1.2
30N -0.6
-0.8
Eq -0.2
-0.4
30S 0.2
0
60S
0.6 0.4
90S
24
8
500 700 1000 90N
4 60N
1 0.8
-1 1.2
-1.2
30N -0.6
-0.8
Eq -0.2
-0.4
30S 0.2
0
60S
0.6 0.4
90S
1 0.8
1.2
°C/century
16
Section 2: Studying the Causes of Climate Change
lecture by Ben Santer, UoMichigan, March 27, 2008, AOSS 480
“Fingerprinting” with temperature changes in Earth’s atmosphere Model Changes: CO2 + Sulfate Aerosols + Stratospheric Ozone 50
14 200 10
300
Height (km)
Pressure (hPa)
18 100
6
500
2
850 60N
45N
30N
15N
0
15S
30S
45S
60S
Observed Changes 50
100 14 200 10
300
6
500
2
850 60N
45N
30N
-1.5 -1.8
Santer et al., Nature (1996)
Height (km)
Pressure (hPa)
18
15N
-0.9 -1.2
0 -0.3
-0.6
15S 0.3
0
30S 0.9
0.6
45S
60S
1.5 1.2
1.8
Temperature changes in oC
17
Section 2: Studying the Causes of Climate Change
lecture by Ben Santer, UoMichigan, March 27, 2008, AOSS 480
Searching for fingerprints of human activities in the world’s oceans
z
Initial work by Syd Levitus and colleagues showed an increase in the heat content of the oceans over the second half of the 20th century (Levitus et al., 2001, Science)
z
Subsequent research by Tim Barnett and colleagues identified a human fingerprint in the observed ocean heat content changes (Barnett et al., 2001, Science)
18
Section 2: Studying the Causes of Climate Change
lecture by Ben Santer, UoMichigan, March 27, 2008, AOSS 480
“Fingerprinting” in the ocean: Warming of the North Atlantic over 1955-99
Barnett et al., Science (2005)
19
Section 2: Studying the Causes of Climate Change
lecture by Ben Santer, UoMichigan, March 27, 2008, AOSS 480
“Fingerprinting” in the ocean: Warming of the world’s oceans over 1955-99
Barnett et al., Science (2005)
20
Section 2: Studying the Causes of Climate Change
lecture by Ben Santer, UoMichigan, March 27, 2008, AOSS 480
Fingerprint detection explained pictorially…. Time-varying observed patterns
t=1 t=2 t=3 t=4 t=n
Time-varying control run patterns
t=1 t=2 t=3 t=4 t=n
Model fingerprint
Projection onto model fingerprint
Signal and noise time series
Projection onto model fingerprint
Signal-to-noise ratios
21
Section 2: Studying the Causes of Climate Change
lecture by Ben Santer, UoMichigan, March 27, 2008, AOSS 480
Human-caused fingerprints have been identified in many different aspects of the climate system Surface specific humidity
Water vapor over oceans
Tropospheric temperatures
Stratospheric temperatures
Tropopause height
Ocean temperatures
Sea-level pressure
Atmospheric temperature 50 18 100 14 200
Zonal-mean rainfall
Near-surface temperature
10
300
6
500
2
850 60N
45N
30N
15N
0
15S
30S
45S
60S
Continental runoff
22
Section 2: Studying the Causes of Climate Change
lecture by Ben Santer, UoMichigan, March 27, 2008, AOSS 480
Key results of IPCC AR4: We are now able to identify human influences on climate at continental scales
Continental warming likely shows a significant anthropogenic contribution over the past 50 years
23
Section 3: A Few Common Myths About Climate Change
lecture by Ben Santer, UoMichigan, March 27, 2008, AOSS 480
Structure of talk
z Climate Change 101 z How do we study the causes of climate change? z A few common myths about climate change z Conclusions and some personal thoughts
24
Section 3: A Few Common Myths About Climate Change
lecture by Ben Santer, UoMichigan, March 27, 2008, AOSS 480
Myth 1: Climate models can’t simulate the “observed” variability of ocean temperatures
z A persistent criticism: ¨ “Variability is not adequately simulated in the current generation of coupled climate models used to study the impact of anthropogenic influences on climate” (Lyman et al., Geophysical Research Letters, 2006) z If true, this would cast doubt on the credibility of studies that have
claimed identification of a human “fingerprint” in ocean temperatures
25
Section 3: A Few Common Myths About Climate Change
lecture by Ben Santer, UoMichigan, March 27, 2008, AOSS 480
The ocean observing network has changed dramatically over time Number of Observations at the 100m Level 1955 1965
1975
1985
26 Source: AchutaRao et al., JGR (2006)
Section 3: A Few Common Myths About Climate Change
lecture by Ben Santer, UoMichigan, March 27, 2008, AOSS 480
Time-variability of “sub-sampled” ocean temperature data (°C)
Do models systematically underestimate “observed” variability of ocean temperature?
Models with volcanoes
Models without volcanoes
Time-variability of “complete” ocean temperature data (°C) Source: AchutaRao et al., PNAS (2007)
27
Section 3: A Few Common Myths About Climate Change
lecture by Ben Santer, UoMichigan, March 27, 2008, AOSS 480
Time-variability of “sub-sampled” ocean temperature data (°C)
Sampling climate model data at the locations of ocean observations improves model-data agreement
Models with volcanoes
Models without volcanoes
Time-variability of “complete” ocean temperature data (°C) Source: AchutaRao et al., PNAS (2007)
28
Section 3: A Few Common Myths About Climate Change
lecture by Ben Santer, UoMichigan, March 27, 2008, AOSS 480
Myth 2: The global ocean cooled over 2003 to 2005 (Lyman et al., Geophysical Research Letters, 2006)
29
Section 3: A Few Common Myths About Climate Change
lecture by Ben Santer, UoMichigan, March 27, 2008, AOSS 480
Fractional coverage of measurements
The coverage of different temperature measurement systems changed markedly over the early 21st century
0.8 0.6 0.4 0.2 0.0
AchutaRao et al., Proceedings of the National Academy of Sciences (2007)
30
Section 3: A Few Common Myths About Climate Change
lecture by Ben Santer, UoMichigan, March 27, 2008, AOSS 480
ARGO profiling floats have transformed our ability to monitor the temperature of the global ocean
“…climate models cannot capture this variablity…”
31
Section 3: A Few Common Myths About Climate Change
lecture by Ben Santer, UoMichigan, March 27, 2008, AOSS 480
Explanation of global cooling
z Gouretski
and Koltermann (Geophysical Research Letters, 2007) identified biases between different types of instrument used for measuring temperature
z The global ocean “cooling” over 2003 to 2005 reported on by Lyman et
al. is an artifact of time-varying coverage of instruments with different biases
32
Section 3: A Few Common Myths About Climate Change
lecture by Ben Santer, UoMichigan, March 27, 2008, AOSS 480
Temperature anomaly (˚C; 0-700m)
The “global ocean cooling” between 2003 and 2005 is an artifact!
AchutaRao et al., Proceedings of the National Academy of Sciences (2007)
33
lecture by Ben Santer, UoMichigan, March 27, 2008, AOSS 480
Uncertainty in key observations affects out ability to evaluate climate models!
From Church et al. (Nature, submitted)
34
Section 3: A Few Common Myths About Climate Change
lecture by Ben Santer, UoMichigan, March 27, 2008, AOSS 480
Myth 3: Models cannot simulate “observed” changes in tropospheric temperature ● Douglass, Christy, Pearson, and Singer: “A comparison of tropical temperature trends with model predictions”. International Journal of Climatology, 2007 ● Based on application of a “robust statistical test”, Douglass et al. conclude that “Models and observations disagree to a statistically significant extent”
● This conclusion is “based on essentially the same data” used in previous work
● Douglass et al. findings are “an inconvenient truth”, and prove that “Nature rules the climate: Human-produced greenhouse gases are not responsible for global warming”* *Press release from press conference held at U.S. National Press Club, January 2008 35
Section 3: A Few Common Myths About Climate Change
lecture by Ben Santer, UoMichigan, March 27, 2008, AOSS 480
Real-world data (RSS)
Real-world trend plus random noise
Tropospheric temp. anomaly (°C)
Tropospheric temp. anomaly (°C)
A brief primer on fitting trends to noisy data
36
Section 3: A Few Common Myths About Climate Change
lecture by Ben Santer, UoMichigan, March 27, 2008, AOSS 480
What happens when you compare modeled and observed trends, AND include trend error bars?
37
Section 3: A Few Common Myths About Climate Change
lecture by Ben Santer, UoMichigan, March 27, 2008, AOSS 480
What happens when you DON’T include trend error bars, and used a flawed test?
38
Section 3: A Few Common Myths About Climate Change
lecture by Ben Santer, UoMichigan, March 27, 2008, AOSS 480
Comparisons between modeled and observed trends: The view from Douglass et al. (2007)
39
Section 3: A Few Common Myths About Climate Change
lecture by Ben Santer, UoMichigan, March 27, 2008, AOSS 480
Comparisons between modeled and observed trends: The view from Santer et al. (2008)
40
Section 4: Conclusions
lecture by Ben Santer, UoMichigan, March 27, 2008, AOSS 480
Structure of talk
z Climate Change 101 z How do we study the causes of climate change? z A few common myths about climate change z Conclusions and some personal thoughts
41
Section 4: Conclusions
lecture by Ben Santer, UoMichigan, March 27, 2008, AOSS 480
Conclusions: What we know z Human activities have changed the chemical composition of the
atmosphere z Atmospheric CO2 increased by roughly 30% since the 1850s, and is
now at higher levels than at any time in at least the last 650,000 years z The earth’s surface warmed by about 0.74°C ±0.18°C over the last 100
years z The 20th century was probably the warmest of the past two millennia z We have identified human “fingerprints” in a number of different aspects
of the climate system z The climate system is telling us an internally-consistent story 42
Section 4: Conclusions
lecture by Ben Santer, UoMichigan, March 27, 2008, AOSS 480
Conclusions: What we don’t know very well z How much warmer will the Earth be in 2100? z How will the carbon cycle respond to (and influence) climate change? z How rapidly will the ocean’s conveyor belt circulation respond to climate
change? z At
what level of temperature change do we risk “dangerous anthropogenic interference” with the climate system?
z How will hurricane intensity and frequency change in a warming world? z Can we make useful predictions of the regional-scale features of
climate change? z Will we be smart enough to “do the right thing” for future generations? 43
Section 4: Conclusions
lecture by Ben Santer, UoMichigan, March 27, 2008, AOSS 480
Personal thoughts (I) z A human-induced warming signal has emerged from the background
“noise” of natural climate variability z A similar “signal” has emerged in media coverage of climate change: ¨ Are humans affecting global climate? ¨ Yes, humans really are affecting climate, and we can see it happening now ¨ How do we mitigate and/or adapt to human-caused climate change?
44
Section 4: Conclusions
lecture by Ben Santer, UoMichigan, March 27, 2008, AOSS 480
Personal thoughts (II) z
Several months ago, Seth Borenstein asked me: “Why aren’t you profoundly depressed by your work? How can you have any optimism about the future?”
z
My answer: ¨ I’m optimistic because of the “media signal” – thanks to the work of many scientists and journalists, most Americans now understand that our actions have influenced global climate ¨ I’m optimistic because I believe most inhabitants of this planet truly care about the kind of world we will leave behind for our children and grandchildren ¨ I’m optimistic because I believe that we are capable of making smart choices on “what to do” about climate change, if: z
The public has some basic grasp of climate science;
z
The public understands the possible risks of inaction;
z
The public recognizes that they are not helpless, and can take individual and collective action to address human-caused climate change 45
Section 4: Conclusions
lecture by Ben Santer, UoMichigan, March 27, 2008, AOSS 480
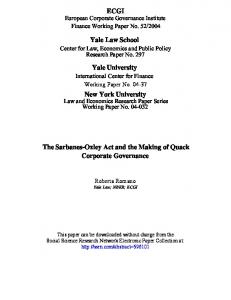
The “Wheel of Climate Fortune”
5°C
(3.8%; 1 in 26 odds)
Source: MIT Joint Program on the Science and Policy of Climate Change
46
Section 4: Conclusions
lecture by Ben Santer, UoMichigan, March 27, 2008, AOSS 480
The atmosphere does not respect national boundaries
47