dynamic graphics and simulations in R. Andrej Blejec
. National Institute of Biology and. University
Presentation of statistical concepts with dynamic graphics and simulations in R Andrej Blejec
[email protected]
National Institute of Biology and
University of Ljubljana, Slovenia IASE2017, July , 2017
A. Blejec: Animations in R ...
1 / 57
Some examples
A. Blejec: Animations in R ...
2 / 57
Empirical distribution function and quartiles 1 100
80
60
● ● ●● ●● ●● ● ● ●● ● ● ● ●● ● ● ● ●● ● ●● ●● ● ● ● ● ● ● ● ● ● ● ● ● ● ● ● ● ● ● ● ● ● ● ● ● ● ● ● ● ● ● ● ● ● ● ● ● ● ● ● ● ● ●● ● ●● ● ● ● ● ● ● ● ● ● ● ● ● ● ● ●● ● ●●● ●● ● ● ● ● ● ●● ●● ● ● ● ● ● ● ● ● ● ● ● ● ● ● ● ● ● ● ● ● ● ● ● ● ● ● ●●● ●●● ●●● ● ●● ●●● ●●●● ●
●
●● ●
●
●● ●●
● ●●●
●
●●
●
●
0.75
0.5
40
0.25
20
0
0
A. Blejec: Animations in R ...
●
● ●
●
●
●
3 / 57
Projection to the first principal component ●
● ●
●
●
●
● ●
●●
●
●
● ●
●
● ● ● ● ● ● ●
● ● ●
●
●
●● ●
●
● ●
●
●
● ●
●
● ● ● ● ● ● ● ● ●● ● ● ●● ● ● ● ● ● ●● ● ● ● ●● ● ● ● ● ● ● ● ● ● ● ● ● ● ● ● ● ● ●● ● ●
●
● ●
●
● ●
●
●
● ●
●
A. Blejec: Animations in R ...
●
●
4 / 57
Move points to median then expand to mid-quintiles
●
A. Blejec: Animations in R ...
5 / 57
80
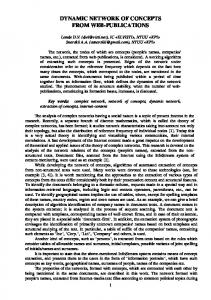
A tribute to Hans Rosling (1948-2017)
●
60
70
●● ●●●
●●
50
●
●
40
● ●●
●
●● ●
●
1952 ●
●
●
●
●●● ●● ● ● ● ●●●●●● ●●● ●●●●●●●●●●●●●●●● ● ● ●●● ● ●
●●
● ●● ● ●● ● ● ●● ●● ● ● ● ●
●
30
GDP per capita
●● ● ● ● ●● ● ●● ●●●●●● ● ● ● ● ● ● ● ●●●● ● ● ● ● ● ● ● ● ● ● ●
●
●● ●
●
● ●
●
●
●
●
●
●
●
●
0.2
0.5
1.0
2.0
5.0
10.0
20.0
50.0
Life expectancy
A. Blejec: Animations in R ...
6 / 57
Matrices
A. Blejec: Animations in R ...
7 / 57
Matrix multiplication: points move
[1,] [2,]
[,1] [,2] 1 2 2 1
●
A. Blejec: Animations in R ...
●
8 / 57
Matrix multiplication: change of direction and magnitude
[1,] [2,]
A. Blejec: Animations in R ...
[,1] [,2] 1 2 2 1
9 / 57
Matrix multiplication: find the eigenvectors
[1,] [2,]
A. Blejec: Animations in R ...
[,1] [,2] 1 2 2 1
10 / 57
How far are we from the truth?
A. Blejec: Animations in R ...
11 / 57
P(a < X ≤ b) =?
a
A. Blejec: Animations in R ...
b
12 / 57
Parameter estimation
Ways of estimation Point estimation Least squares estimation (LSE) Maximum likelihood estimation (MLE)
Interval estimaton
A. Blejec: Animations in R ...
13 / 57
Method of least squares
./clp/capture-LSE1.jpg
A. Blejec: Animations in R ...
14 / 57
Method of least squares
./clp/capture-LSE2.jpg
A. Blejec: Animations in R ...
14 / 57
Minimal sum of squared deviations
● ● ● ● ● ● ● ● ● ●
A. Blejec: Animations in R ...
15 / 57
0
5
10
15
20
Least squares estimation: mean
5
10
15
600 400 200 0
Sum of squares
x
0
1
2
3
4
5
6
x
A. Blejec: Animations in R ...
16 / 57
0.08 0.04 0.00
Density
0.12
Maximum likelihood estimation: mean
5
10
15
−60 −100 −140
log Likelihood
x
0
1
2
3
4
5
6
x
A. Blejec: Animations in R ...
17 / 57
0.08 0.04 0.00
Density
0.12
Maximum likelihood estimation: sd
5
10
15
−60 −100 −140
log Likelihood
x
0
1
2
3
4
5
6
x
A. Blejec: Animations in R ...
18 / 57
Inference errors
A. Blejec: Animations in R ...
19 / 57
Hypothesis testing | H0 = µ0 Larger sample → smaller SE → smaller β specificity
false positive
H0 : µ = µ0
α µ0
H1 : µ > µ0
β
false negative A. Blejec: Animations in R ...
X
sensitivity 20 / 57
What will you do on Sunday?
A. Blejec: Animations in R ...
21 / 57
What will you do on Sunday? Depends ...
A. Blejec: Animations in R ...
22 / 57
What is the plan?
Hmmm ... hiking cleaning the flat reading running staying in bed biking
A. Blejec: Animations in R ...
23 / 57
What is the plan? Hmmm ... hiking cleaning the flat reading running staying in bed biking
Sunny
Rainy
hiking
cleaning the flat
running
reading
biking
staying in bed
A. Blejec: Animations in R ...
23 / 57
Things are related ... Different conditions yield different distributions (expectations)
A. Blejec: Animations in R ...
24 / 57
Things are related ... Different conditions yield different distributions (expectations)
A. Blejec: Animations in R ...
24 / 57
Things are related ... Different conditions yield different distributions (expectations)
A. Blejec: Animations in R ...
24 / 57
Height and weight
A. Blejec: Animations in R ...
25 / 57
Correlation
A. Blejec: Animations in R ...
quantitative ∼ quantitative
26 / 57
Analysis of variance
A. Blejec: Animations in R ...
quantitative ∼ qualitative
27 / 57
Contingency
A. Blejec: Animations in R ...
descriptive ∼ descriptive
28 / 57
2
4
6
R 2 goodness of fit Changing intercept
● 0
● ● ● ●
−2
● ●
0 A. Blejec: Animations in R ...
● ●● ● ● ●● ● ●● ● ● ●● ● ●● ● ● ● ● ● ● ● ●● ●●●● ● ● ● ● ● ● ● ● ● ● ● R2 = 0.22 ●
model1
● 1
2
3
29 / 57
6
R 2 goodness of fit Changing slope
R2model2 = 0.22 4
● ● ● ● ●
2
● ● ●●
0
● ● ● ●
−2
● ●
0 A. Blejec: Animations in R ...
● ●● ● ● ●● ● ●● ● ● ●● ● ●● ● ● ● ● ● ● ● ● ● ●●●● ● ● ● ● ● ● ● ● ● ● ● ●
● ●● ● ● ●● ● ●● ● ● ●● ● ●● ● ● ● ● ● ● ● ●● ●●●● ● ● ● ● ● ● ● ● ● ● ● R2 = 0.22 ●
model1
● 1
2
3
30 / 57
Joint and marginal distribution
A. Blejec: Animations in R ...
31 / 57
● ● ●
●
● ●
●
● ● ● ● ● ● ● ● ●●●●●● ● ● ● ● ● ●●●● ● ● ●● ●●● ● ● ● ● ●● ● ●● ● ● ● ●● ● ● ●● ● ● ●● ● ● ● ●● ● ● ●● ●● ● ●●● ●● ● ●● ● ● ● ● ●●● ● ● ● ● ● ●●
● ● ●
● ●
●
A. Blejec: Animations in R ...
32 / 57
From bivariate distribution to marginal distributions
A. Blejec: Animations in R ...
32 / 57
From marginal distributions to bivariate ?
A. Blejec: Animations in R ...
33 / 57
From marginal distributions to bivariate ?
A. Blejec: Animations in R ...
34 / 57
From marginal distributions to bivariate ?
A. Blejec: Animations in R ...
35 / 57
IASE 2017
A. Blejec: Animations in R ...
36 / 57
Animation in R
A. Blejec: Animations in R ...
37 / 57
Animation solutions for R :
the main idea is: plot frame by frame package animation provides an organized environment for subsequent plotting, see AniWiki animator takes care of smooth transitions
A. Blejec: Animations in R ...
38 / 57
Drawbacks
plotting everything can be slow for complex figures smooth movements require intermediate plots, thus lot of frames to plot
A. Blejec: Animations in R ...
39 / 57
Moving a point, line traces the movement. t = 0.91
●
A. Blejec: Animations in R ...
40 / 57
Moving a point ...
●
●
●
A. Blejec: Animations in R ...
●
41 / 57
Linear homotopy
Start coordinate x0 End coordinate x1 For parameter t ∈ [0, 1] xt = h(x0 , x1 , t) = (1 − t) · x0 + t · x1
A. Blejec: Animations in R ...
42 / 57
Linear homotopy when: start, end, enter, exit ... 0,1
x0
0.3 , 0.7
0.0
x1
0.2
0.4
0.6
0.8
h
0.0
● ● ● ● ● ● ● ● ● ● ● ● ● ● ● ● ● ● ● ● ● ● ● ● ● ● ● ● ● ● ● ● ● ● ● ● ● ● ● ● ● ● ● ● ● ● ● ● ● ● ● ● ● ● ● ● ● ● ● ● ● ● ● ● ● ● ● ● ● ● ● ● ● ● ● ● ● ● ● ● ● ● ● ● ● ● ● ● ● ● ● ● ● ● ● ● ● ● ● ● ●
0.0
0.2
0.4
0.6
0.8
t
t
0.3 , 0.7 , 0.1 , 0.9
0.4 , 0.6 , 0.1 , 0.9
0.2
0.4
0.6 t
A. Blejec: Animations in R ...
x0
1.0
x1
● ● ● ● ● ● ● ● ● ● ● ● ● ● ● ● ● ● ● ● ● ● ● ● ● ● ● ● ● ● ● ● ● ● ● ● ● ● ● ● ● ● ● ● ● ● ● ● ● ● ● ● ● ● ● ● ● ● ● ● ● ● ● ● ● ● ● ● ● ● ● ● ● ● ● ● ● ● ● ● ●
x0
x1
h
● ● ● ● ● ● ● ● ● ● ● ● ● ● ● ● ● ● ● ● ● ● ● ● ● ● ● ● ● ● ● ● ● ● ● ● ● ● ● ● ● ● ● ● ● ● ● ● ● ● ● ● ● ● ● ● ● ● ● ● ● ● ● ● ● ● ● ● ● ● ● ● ● ● ● ● ● ● ● ● ● ● ● ● ● ● ● ● ● ● ● ● ● ● ● ● ● ● ● ● ●
0.8
x0 1.0
1.0
● ● ● ● ● ● ● ● ● ● ● ● ● ● ● ● ● ● ● ● ● ● ● ● ● ● ● ● ● ● ● ● ● ● ● ● ● ● ● ● ● ● ● ● ● ● ● ● ● ● ● ● ● ● ● ● ● ● ● ● ● ● ● ● ● ● ● ● ● ● ● ● ● ● ● ● ● ● ● ● ●
h
h
x1
life
0.0
0.2
0.4
0.6
0.8
1.0
t
43 / 57
Timed functions
tpoints tlines tsegments tarrows tpolygon
(x0, y0, x1 = x0, y1 = y0, t, when, trace = FALSE (x0, y0, x1, y1, t, when, ...) (x0, y0, x1, y1, t, when, fixed = 1, ...)
(x0, y0, x1, y1, t, when, fixed = 1, length = 0.1 (x0, y0, x1, y1, t, when, ...)
trect
(xleft0, ybottom0, xright0, ytop0, xleft1,
ttext
(x0, y0, x1 = x0, y1 = y0, t, when, text =
A. Blejec: Animations in R ...
44 / 57
Timed parameters ...
tcex
(cex0 = 1, cex1 = 1, t, when, ...)
trgb
(x0, x1 = x0, t, when = c(0, 1), alpha0 = 1,
tmatrix
A. Blejec: Animations in R ...
(X1, X0 = diag(nrow(X1)), t, when, ...)
45 / 57
Function animator()
animator
(block, life = 1, fps = 25, pause = 0.5, verbose
Accepts argument block as a character string animator(' newplot() tpoints(2, 2, 9, 5, trace = TRUE, pch = 16, cex = 2) ')
A. Blejec: Animations in R ...
46 / 57
Function animator()
Argument block as an expression > block animator(block)
A. Blejec: Animations in R ...
47 / 57
Class animator A block of commands (expression or character version) can be changed to a class animator > x x expression({ newplot() tpoints(2, 2, 9, 5, trace = TRUE, pch = 16, cex = 2) }) attr(,"class") [1] "animator" attr(,"life") [1] 2 > is.animator(x) [1] TRUE > plot(x) A. Blejec: Animations in R ...
48 / 57
Animated graphics in a PDF file use package animate in LaTeX > plot(as.animator(block)) > includeLatex(vspace = "-2cm")
●
A. Blejec: Animations in R ...
49 / 57
Moving points
tpoints()
●
●
●
●
●
●
●
●
●
●
● ●
● ●
A. Blejec: Animations in R ...
●
●
50 / 57
Lines
tlines() ●
● ●
● ● ● ● ●
●
●
●
●
●
● ● ●
A. Blejec: Animations in R ...
51 / 57
Growing segments
A. Blejec: Animations in R ...
tsegments()
52 / 57
Growing arrows
A. Blejec: Animations in R ...
tarrows()
53 / 57
Polygons
A. Blejec: Animations in R ...
tpolygon()
54 / 57
Rectangles
A. Blejec: Animations in R ...
trect()
55 / 57
Final remarks
Graphically supported simulations can - to some extent - replace the proofs, usually not understandable to non-mathematics majors.
Maybe they are the answer to some questions:
If an audience is not convinced by the proof, why do proof? (Moore, 1996) Do [students] need to know the theory or do they need to understand the concepts? (J Brown and I David, ICOTS8, 2010)
A. Blejec: Animations in R ...
56 / 57
Thank you !
A. Blejec: Animations in R ...
57 / 57