American Mineralogist, Volume 84, pages 345–356, 1999
Pressure dependence of self-diffusion in the NaAlO2-SiO2 system: Compositional effects and mechanisms JULIA G. BRYCE,* FRANK J. SPERA,
AND
DANIEL J. STEIN
Department of Geological Sciences and Institute for Crustal Studies, University of California, Santa Barbara, California 93106, U.S.A.
ABSTRACT Molecular Dynamics (MD) simulations were used to study the relationship between structure and transport properties in five liquids (NaAlO2, Na2Al2SiO6, NaAlSiO4, NaAlSi2O6, and NaAlSi3O8) in the system NaAlO2-NaAlSi3O8 at temperatures ranging from 4000 to 6000 K and pressures from 0 to 55 GPa. Seventy simulations were carried out in the microcanonical ensemble using a simple pair-wise additive potential with Coulombic interaction and Born-Mayer repulsion. Detailed study of the coordination of O and network forming cations provides a master set of coordination environment or speciation curves. These master curves were applicable to all compositions and temperatures and were most explicit when compression (Vr/V; where Vr is the molar volume at a reference pressure) was used as the independent variable. The universality implied that coordination environments for network atoms O, Al, and Si depend weakly upon Si/Al, T/O, or Na/T atomic ratios for the compositions studied. Self-diffusion coefficients, computed from analysis of mean-square displacements, were used to evaluate the activation enthalpy (Ha 5 Ea 1 PVa) for self-diffusion for each species. The activation energy (Ea) for Na was independent of composition, whereas Ea for O, Si, and Al increased as Si/Al increased. Activation volume (Va) at pressure , 15 GPa was positive for Na and negative for O, Si, and Al and decreased with increasing Si/Al for all species. An extension of the Adam-Gibbs-DiMarzio configurational entropy theory taking explicit account of [2]O and [3]O mixing explained both the variation of the pressure-derivative of the shear viscosity as a function of composition and the disappearance of ‘‘anomalous’’ viscosity behavior at P . ;25 GPa for all compositions in the system NaAlO2-NaAlSi3O8.
INTRODUCTION Silicate liquids play a significant role in several geochemical and geophysical phenomena. Furthermore, the nature of the liquid state remains unsolved in condensed matter physics and bears critically on many technological issues. Of great import is the relationship between the atomic structure (microscopic scale) and the expression of that structure in terms of bulk thermodynamic and transport properties (macroscopic scale). To understand diffusion, nucleation and crystal growth kinetics, melt rheology, ionic conductivity, and the thermodynamic properties of melts and glasses at a broad range of temperatures, pressures and compositions, investigators have applied a diverse array of laboratory, theoretical and simulation methods (e.g., Stebbins et al. 1995; Angell 1995). Among the techniques used to explore the connection between the dynamics and structure of a liquid, molecular dynamics (MD) simulations offer the advantage of providing information on the location and velocity of indi* Present Address: Berkeley Center for Isotope Geochemistry, Department of Geology and Geophysics, MC 4767, University of California, Berkeley, California 94720-4767. E-mail:
[email protected] 0003–004X/99/0003–0345$05.00
vidual atoms through time. Poole et al. (1995) summarized the methods, strengths, and drawbacks of the MD technique and its application to earth materials (Kubicki and Lasaga 1990, for further detail). MD methodology was detailed by Allen and Tildesley (1987). Details on the particular implementation of MD used here were given previously (Rustad et al. 1990; Stein and Spera 1995, 1996; Bryce et al. 1997; Nevins and Spera 1998). The goals of the present study were to examine changes in computed structure and related properties at elevated temperatures and pressures in melts in the system NaAlO2-SiO2 and to compare computed values with results from laboratory experiments. Because SiO2 has been extensively studied by MD (Woodcock et al. 1976; Mitra 1982; Erikson and Hostetler 1987; Feuston and Garofalini 1988; Kubicki and Lasaga 1988; Vessal et al. 1991; Rustad et al. 1990; 1991 a,b,c, 1992; Della Valle and Andersen 1992; Jin et al. 1993; Vashishta et al. 1996; Vollmayr et al. 1996), we focused on five compositions between albite and sodium aluminate. These included the compositions albite, NaAlSi3O8 (X0.75); jadeite, NaAlSi2O6 (X0.67); nepheline, NaAlSiO4 (X0.50); Na2Al2SiO6 (X0.33); and sodium aluminate, NaAlO2 (X0) where X represents the
345
346
BRYCE ET AL.: SELF DIFFUSION IN NaAlO2-SiO2
mole fraction of SiO2 in the composition. This system is a rough analog to natural systems ranging from silicasaturated rhyolite (NaAlSi3O8), through critical saturation near andesite (NaAlSi2O6), and finally to an undersaturated feldspathoidal composition (NaAlSiO4). All compositions in this system were canonical [4]T-[2]O tetrahedral network liquids at low pressure. The label [n]T refers to the number (n) of O atoms that are nearest neighbors to a given Si or Al (‘‘T’’) atom. Similarly, the label [n]O refers to the number (n) of T atoms that are nearest neighbors to a given O. Non-bridging O (NBO) is equivalent to [1]O in this nomenclature. In an ideal [4]T-[2]O network melt [1]O is not present. In real network melts, some [1]O and very small amounts of [0]O are present at low concentration (Stebbins and Xu 1997; Toplis et al. 1997). The terminology [n]O provides a better description of the O coordination environment than simple categorization of O as bridging (BO) or non-bridging (NBO). For example, both [0]O and [1]O may be considered NBO, whereas both [2] O and [3]O may be considered BO. Characterization of O coordination by network cations (Si and Al) at short range is pivotal; complete description of the O coordination environment requires additional information describing the O sublattice, as well as the O about metal environment at both short and long ranges. Except in a few, rare instances (e.g., Vashishta et al. 1996), the longrange structure of melts has not been explored by MD methods because of the formidable computational effort involved. Because [1]O and especially [0]O are in low concentration in network aluminosilicate melts, we believe they do not play a significant role in governing material behavior. Thus, rather than focusing on mixing of [n]O with n 5 0, 1, and 2 and the classical characterization of strong and fragile liquids (e.g., Angell et al. 1987; Hess 1995; Navrotsky 1995), we studied the behavior of aluminate and aluminosilicate network melts (all‘‘strong’’ fluids) at high temperatures and pressures. Experimental rheometric data on melts and glasses in the system NaAlSiO4-NaAlSi3O8 (Stein and Spera 1993; Toplis et al. 1997) in fact showed that melt fragility, defined by the magnitude of the derivative of the logarithmic viscosity with respect to reciprocal temperature, increased as NaAlO2 was added to SiO2. Melt fragility defined this way was constant and equal to the activation energy for shear viscosity in an Arrhenian fluid (i.e., [](ln h)/](1/T)]P 5 Ea/R). In a nonArrhenian melt, the reciprocal temperature derivative of the viscosity will itself depend on temperature, i.e., [](ln h)/](1/T)]P 5 f(T). In these high-pressure aluminate and aluminosilicate networks, mixing of O coordinated as [2]O, [3]O, and [4]O with T atoms was significant. Alternatively, mixing can be viewed in terms of the distribution of TOn polyhedra with n equal to 3, 4, 5, and 6. We focused on O, Si, and Al structural relationships because these species are dominant in the system NaAlO2-NaAlSi3O8. The transport property studied was the variation of self-diffusivity for Na, Al, Si, and O as a function of
temperature and pressure. We used the activation volume [Va 5 2RT(] ln D/]P)T] and activation energy [Ea 5 2R(] ln D/](1/T))P] for self-diffusion of each species to describe the temperature and pressure dependence of selfdiffusion coefficients. As remarked in studies noted above, melts in the system NaAlO2-NaAlSi3O8 are not strictly Arrhenian. For the high temperatures considered here, however, the Arrhenian approximation was an excellent one.
METHODS MD calculations were made for five compositions (Table 1) using a FORTRAN code developed by Rustad et al. (1990, 1991) and modified as described in Stein and Spera (1995, 1996). The simulations were executed on IBM RS/6000-350 workstations and CRAY-C90 machines at the San Diego Supercomputer Center (SDSC) and the National Energy Research Scientific Computing (NERSC) facilities. A single 50 ps production run took approximately 100 CPU h on the workstation and 4 CPU h on the CRAY-C90. Molecular dynamics simulations are brute-force solutions to the classical equations of motion for a set of particles. Forces acting on particles in these experiments were computed using the pairwise-additive potential, Uij 5 q1q2/rij 1 Aijexp(2Bijrij), which calculates the potential energy for each particle (i) summed over the ensemble in terms of Coulombic interaction (with nominal charges qi, qj) evaluated over interparticle distance rij and short-range Born-Mayer repulsion terms. Repulsion was evaluated using the Aij, Bij parameters of Dempsey and Kawamura (1984); see Stein and Spera (1995) for discussion and comparison with other parameterizations. This pair-wise potential supplies a radially symmetric potential interaction and neglects covalency and polarization effects. In employing this potential, short-range Born-Mayer repulsion was computed for rij # 0.8 nm, whereas longer-range Coulombic interaction was computed using the Ewald method and periodic boundary conditions. In employing the Ewald sum, the convergence parameter, k, which describes the width of the Gaussian distribution of neutralizing charges surrounding each ion, was set at 5/L where L is the edge length of the MD primary cubic cell. The reciprocal space component of the sum was determined with reciprocal lattice vectors k 5 2pn/L, with znz2 # 81. All experimental configurations were initially random and were given 1 ps equilibration times at T ; 104 K during which the velocity of each particle was scaled and excess kinetic energy and net momentum were removed. For these configurations, temperature was decreased at a rate (dT/dt) of 100 K/ps to the desired production run temperature. Vollmayr et al. (1996) pointed out that small but noticeable differences in melt structure and properties could result from employing different temperature rates in MD simulations of molten silica. To avoid this problem, we used the same rate for all of the experiments. For changes in pressure, configurations were changed at the rate (dP/dt) of 1 GPa/ps. All production runs (Table
BRYCE ET AL.: SELF DIFFUSION IN NaAlO2-SiO2 TABLE 1. Molecular dynamics simulations of molten sodium aluminosilicates Composition
T (K)
P (GPa)
L A˚
r (kg/m3)
NaAlO2*
3544.1 4076.3 4025.4 4060.1 4079.3 4064.3 4009.3 4220.2 4059.4 4114.9 4940.3 3933.3 4047.8 3544.1 3565.4
6 6 6 6 6 6 6 6 6 6 6 6 6 6 6
60.0 78.7 70.3 75.4 77.9 87.3 71.1 81.8 71.3 76.7 90.4 90.1 99.9 60.0 60.0
0.39 0.86 0.77 1.81 2.21 3.29 4.03 8.58 10.14 12.02 12.96 15.55 21.42 0.39 3.48
6 6 6 6 6 6 6 6 6 6 6 6 6 6 6
0.6 0.7 0.7 0.7 0.7 0.8 0.7 0.8 0.8 0.9 1.0 0.9 1.0 0.6 0.6
27.00 26.26 27.00 26.02 25.93 25.69 26.34 24.99 25.49 24.59 24.59 24.18 23.65 27.00 26.32
2248 2257 2248 2319 2344 2410 2422 2619 2674 2749 2749 2889 3089 2248 2428
Na2Al2SiO6†
4187.5 4141.8 4140.8 4110.1 4093.4 4061.7
6 6 6 6 6 6
90.9 90.2 78.8 86.6 79.0 80.1
1.20 3.08 7.73 9.86 15.80 20.54
6 6 6 6 6 6
0.8 0.8 1.0 1.1 1.1 1.2
25.81 25.39 24.52 24.14 23.25 22.78
2163 2273 2524 2646 2961 3145
NaAlSiO4‡
5070.5 4483.8 4080.4 5140.5 4981.5 5005.7 5080.7 4988.2 5057.3 4983.0 4999.1
6 6 6 6 6 6 6 6 6 6 6
84.9 76.5 70.0 94.6 84.6 86.1 85.3 85.6 83.9 84.5 83.7
2.47 5.37 5.24 7.03 10.51 16.30 18.41 20.77 24.44 23.72 29.12
6 6 6 6 6 6 6 6 6 6 6
0.9 0.9 0.8 1.0 1.1 1.2 1.2 1.2 1.3 1.2 1.3
27.90 26.46 26.46 26.75 26.01 25.15 24.93 24.67 24.40 24.42 24.05
2171 2367 2367 2465 2682 2964 3045 3140 3248 3238 3392
NaAlSi2O6§
4051.2 4063.9 4592.0 4600.2 4600.9 5099.2 5063.8 5108.7 5044.4 5049.2 5073.8 5095.8 5034.1 4983.6 5075.9 4903.0 5047.9 5051.5 3615.0 3887.0 4078.4 4619.5 4140.3
6 6 6 6 6 6 6 6 6 6 6 6 6 6 6 6 6 6 6 6 6 6 6
73.1 74.8 97.4 92.5 86.4 92.1 93.4 93.0 91.8 94.2 91.9 93.8 91.5 89.4 91.6 90.2 91.7 92.3 72.0 69.6 73.9 84.7 74.5
3.31 3.17 3.38 3.41 3.13 3.30 2.80 4.70 7.50 9.03 13.05 13.88 18.00 24.25 25.50 34.05 43.95 57.90 10.29 8.80 10.15 11.33 20.74
6 6 6 6 6 6 6 6 6 6 6 6 6 6 6 6 6 6 6 6 6 6 6
0.8 0.9 0.9 0.9 1.0 1.0 0.9 1.0 1.1 1.2 1.2 1.3 1.4 1.5 1.5 1.6 1.6 1.6 1.1 1.1 1.0 1.2 1.4
26.30 26.30 26.30 26.30 26.30 26.30 26.30 26.01 25.38 25.00 24.31 24.17 23.60 23.05 22.97 22.44 22.05 21.63 24.81 25.16 25.00 24.56 23.18
2213 2213 2213 2213 2213 2213 2213 2288 2463 2576 2802 2851 3062 3285 3324 3563 3757 3981 2636 2531 2578 2719 3231
6028.2 6133.4 6000.1 5963.5 5110.4 5076.9 5117.9 5077.3 5034.2 4946.2 4897.7 5089.1 5271.0 4965.7 4974.5
6 6 6 6 6 6 6 6 6 6 6 6 6 6 6
104.7 108.5 105.1 106.2 91.1 91.6 86.9 89.0 86.9 87.3 86.5 90.5 94.7 87.9 85.7
3.56 3.86 9.62 14.76 3.74 4.01 7.27 7.85 11.27 12.46 18.38 18.74 25.77 30.04 40.17
6 6 6 6 6 6 6 6 6 6 6 6 6 6 6
1.0 1.0 1.2 1.3 0.9 0.9 1.1 1.1 1.2 1.2 1.4 1.4 1.5 1.6 1.5
27.00 27.00 25.57 24.73 27.00 27.00 26.34 26.06 25.30 25.03 24.20 n/a 23.53 23.21 22.68
2210 2210 2602 2878 2210 2210 2382 2459 2688 2775 3071 n/a 3342 3481 3728
NaAlSi3O3\
347
1) were carried out in the microcanonical (constant number, volume, and energy or NVE) ensemble. Energy was conserved to one part in 105. The time step used for all calculations was 1 femtosecond (fs). Simulations were run for systems of 1100 to 1500 particles (Na 1 Al 1 Si 1 O, see Table 1). Previous work has shown that computed material properties and structures are independent of the number of particles provided N . ;1000 for the pair potential used in this work (Kawamura 1991; Stein and Spera 1995). An advantage of using .1000 particles was that fluctuations in pressure and temperature about their mean during a NVE simulation were relatively small. This reduced the size of errors when computing self-diffusion coefficients from mean-square displacements and was essential to the successful extraction of activation volume and energy from self-diffusivity. Run durations of at least 40 ps (40,000 time steps) were used to obtain robust statistics and to allow for sufficient configurational phase space sampling. Production run temperatures were chosen to ensure attainment of ergodicity; structures and properties computed from MD runs, therefore, pertained to relaxed liquids. Melt densities, run durations, particle numbers, and other simulation parameters are gathered in Table 1. Post-processing codes developed in Stein and Spera (1995) were modified and used to calculate structural statistics and self-diffusion coefficients. Structures were determined from particle positions saved over short time intervals (50 fs) during production runs. Coordination statistics for O around T (T 5 Si, Al), T around O, and O around O were computed using cutoffs determined from the first minima of the appropriate partial pair correlation functions at each temperature and pressure. Atomic selfdiffusion coefficients were calculated for each atom from trajectories using particle mean square displacements (MSD) and the standard Einstein random walk relation. Sampling errors on Di were evaluated through comparisons of simulations performed under essentially identical conditions of temperature and pressure but developed from wholly independent quench cycles and by consideration of pressure and temperature fluctuations during production simulations.
RESULTS Short-range structure Twelve-hundred-particle MD was especially well-suited to assess spatial order at short range (to 0.5 nm) in molten and glassy silicates. Although structural order in ←
Notes: n/a 5 not available. L, edge length of the MD primary cubic cell. * X 5 0; Ntot 5 1200; duration 5 50 ps. † X 5 0.33; Ntot 5 1100; duration 5 50 ps. ‡ Nepheline: X 5 0.5; Ntot 5 1400; duration 5 40 ps. § Jadeite: X 5 0.66; Ntot 5 1200; duration 5 50 ps. \ Albite: X 5 0.75; Ntot 5 1300; duration 5 50 ps.
348
BRYCE ET AL.: SELF DIFFUSION IN NaAlO2-SiO2
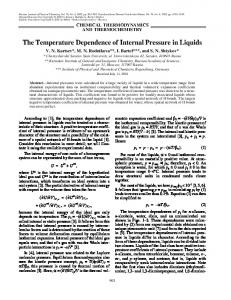
FIGURE 1. TOn speciation (as number fraction of all TOn polyhedra) as a function of pressure (top) and of compression (lower) for compositions X0 5 NaAlO2 (inverted triangles), X0.33 5 Na2Al2SiO6 (diamonds), X0.505 NaAlSiO4 (triangles), X0.67 5 NaAlSi2O6 (squares), and X0.75 5 NaAlSi3O8 (circles). Filled symbols represent simulations run at T ; 4000 K; open symbols represent data from ;5000 K simulations. Coordination statistics are reproducible to within a few percent based on independently quenched simulations. The reference volume Vr corresponds to the MD-computed molar volume at 3 GPa. Plotting speciation against compression results in a single set of master TOn abundance curves for all compositions in NaAlO2-NaAlSi3O8. For NaAlO2 and Na2Al2SiO6, results are given at 4000 K, except for NaAlO2 at 5000 K and 13 GPa.
glasses have been experimentally shown to extend to ;1 nm or greater (Gaskell et al. 1991), the relatively small size of the primary MD cell (,3 nm) precludes the possibility of quantitatively examining structure at long range. The next sections describe the short range coordination statistics as a function of pressure and composition. In this temperature range (4000 to 5000 K), structural variation with temperature was minor relative to that with pressure. O about Si and Al TOn polyhedra statistics changed dramatically as pressure increased (Fig. 1, top). The concentrations of TO4 and TO6 monotonically decreased and increased respec-
tively, whereas the abundance (number fraction) of TO5 maximized in the 20 to 30 GPa range. Evidently, short range structure does not markedly depend upon composition. Even the 50/50 molar mixture of NaAlO2 and NaAlSiO4 (i.e., composition X0.33) deviated relatively little from the TOn abundance curves for melts of higher Si/Al values. Sodium aluminate deviated somewhat from the other compositions; at 13 GPa and 5000 K, the fraction of TO4 in NaAlO2 was about 10% higher than in the other compositions. The effect of temperature on structure in sodium aluminate at 12 GPa was also clearly shown. For example, at ;4000 K and 12 GPa, 85% of the Al was present in fourfold coordination with O, whereas at ;5000 K, 77% of the Al was tetrahedrally coordinated by O. In general, the isobaric temperature-dependence of TOn speciation decreased with increasing Si/Al. Plotting TOn abundance against compression Vr/V removed the effects of differences in the isothermal compressibility with composition and collapsed all speciation abundance data onto a single set of ‘‘master’’ TOn abundance curves (Fig. 1, bottom). The TOn abundance curves for [4]T, [5]T, and [6]T were practically independent of composition. Equation of state (EOS) data (Table 1) could be used to translate from compression to pressure for any composition. These data show a somewhat smaller isothermal compressibility for sodium aluminate compared to the compositions with greater Si/Al. The peak in [5]T occurred at compression equal to ;1.5 (P ; 25 GPa), which corresponds to a depth of about 700 km in the earth. If we treat mixing of polyhedra solely in terms of a binary mixture of [4]T and [5]T, the configurational entropy of mixing attained a maximum where TO4 5 TO5 5 0.5, at Vr/V 5 1.35, which corresponded to a pressure of about 16 GPa. Slight differences in site ordering of Si and Al were found in some of these melts. If the distribution of Al and Si between all polyhedra was completely random, the ratio would be equal to Si/(Al 1 Si), the atomic ratio, for the specific composition at all pressures. For any composition, as pressure increased, the preference of Al to be in either fivefold or sixfold coordination with O decreased, whereas the preference of Al to be in tetrahedral coordination with O increased. At low pressure where TO4 dominated, the small population of TO5 and TO6 that existed were mainly AlO5 and AlO6. This Al/Si fractionation effect rapidly diminished as pressure increased. At constant temperature and pressure, Al showed a small preference to be in octahedral coordination in compositions with Si/Al . 1 (Bryce 1998). Si and Al about O At low pressure, [2]O (i.e., O by two nearest T atoms) was the dominant coordination environment, whereas a smaller fraction of the O was threefold coordinated to T atoms (Fig. 2). The abundance of [3]O monotonically increased as pressure increased and mirrored the monotonic decrease in [2]O. Onefold coordinated O ([1]O) was present in very low concentrations and decreased as pressure
BRYCE ET AL.: SELF DIFFUSION IN NaAlO2-SiO2
349
FIGURE 2. [n]O speciation plotted against pressure for all compositions. Symbols as in Figure 1. Along the 5000 K isotherm O speciation is approximately independent of composition. The effects of DT ;1000 K are shown by comparing O speciation in NaAlO2 at 4000 K and 5000 K. The temperature dependence of O speciation can be used to compute the enthalpy of a disproportionation reaction (see text).
rose, except for sodium aluminate where the concentration was ;8% and remained roughly constant as pressure increased. Zero-coordinated O ([0]O) was practically nonexistent (a few O atoms out of ;750). At a given pressure, the concentration of [1]O increased with decreasing Si/Al (Fig. 2). The [2]O and [3]O species also showed a weak compositional dependence. For example, at 8 GPa, the abundance of [2]O was higher in liquids with high Si/ Al. The effect of temperature on the O coordination environment for NaAlO2 (X0) may be noted by comparing the abundance of [2]O at 13 GPa for 4000 K (78%) and 5000 K (71%) simulations. These concentrations permitted estimation of an enthalpy of 114 kJ/mol and entropy of 56 J/mol·K for the exchange reaction [1]O 1 [3]O 5 2 [2] O where ideal mixing had been assumed. Similarly, at zero pressure for the same reaction, we estimated an enthalpy of 54 kJ/mol and entropy of 56 J/mol·K. At low pressure and 2000 K, the standard state Gibbs free energy of the reaction was equal to 264 kJ/mol. This may be compared to the value of 258 kJ/mol for the standard state Gibbs free energy for the reaction [0]O 1 [2]O 5 2 [1] O in molten MgSiO3 also at 2000 K and 1 bar computed by Matsui and Kawamura (1984) from their MD simulations. Considering only the binary mixing of [2]O and [3]O (an excellent approximation), the configurational entropy was maximized where [2]O 5 [3]O 5 0.5, which occurred at P ; 30 GPa where the compression was ;1.6. O around O O by O coordination number (CN) obviously increased as compression increased (Fig. 3a). On a plot of average O CN against pressure (not shown), there was a clear tendency for the O by O CN to be higher at any given pressure for compositions with high Si/Al. There was a
FIGURE 3. O by O coordination. (a). Average coordination of O around other O atoms plotted against compression. Symbols as in Figure 1. A somewhat steeper trend sets in at a compression of circa 1.4. This corresponds to a pressure of about 20 to 25 GPa. (b). Comparison of O by O coordination in the end-member compositions NaAlO2 and NaAlSi3O8. The modes of O coordination at 4 GPa are similar—peaks at 6 and 7 for both molten sodium aluminate and molten albite. At higher pressures, albite tends toward higher coordination states of O and approaches face-centered cubic closest packing of O with an O by O coordination number (CN) of twelve.
slight increase in the rate of change of the O about O CN for NaAlSi3O8 and NaAlSi2O6 at compression above about 1.4 (P ; 20 GPa); this feature correlated with the maximum in the self-diffusivity of O. The average CN of O about O increases from about 6 to 7 at ;1 GPa to about 14 at ;60 GPa. A CN of ;14 was consistent with a distorted face-centered cubic closest packing of O. For the extremes of composition (NaAlO2 and NaAlSi3O8) at low and high pressures, the modal CN went from 9 to 12 (Fig. 3b). Evidently, at a given pressure, O close packing increased as Si/Al increased. Ionic self-diffusion Self-diffusivities of Al, Si, and O increased with increasing pressure up to ;20 to 25 GPa where they
350
BRYCE ET AL.: SELF DIFFUSION IN NaAlO2-SiO2
FIGURE 4. Self-diffusivity of Na (a), Al (b), Si (c), and O (d) in NaAlO2 and Na2Al2SiO6 melts for T ;4000 K as a function of pressure. Si, Al, and O all exhibit negative activation volumes, whereas Na shows a positive value. Typical reproducibility in ln D values range from ,0.2 (ln D units) for Na to ,0.4 (ln D units) for O, Si, and Al.
achieved a broad maximum and, thereafter, decreased, whereas self-diffusivity of Na decreased as pressure rose (Figs. 4 and 5). Also, atomic mobility increased at constant pressure as Al/Si increased. At the pressure of peak mobility (;25 GPa), the ratio of diffusivity for O:Al:Si is 1.8:1.5:1. The similar magnitude supports the idea that self-diffusion of Si, Al, and O may be cooperative. Comparison of Figures 5d and 1a found that the peak in O diffusivity occurred at approximately the same pressure where [5]T attained a maximum. The Arrhenian relation D 5 D0exp[2(Ea 1 PVa)/RT] has been found to correlate diffusivity as a function of temperature and pressure for many network fluids. In this formulation, Ea and Va depended on composition only. Negative activation volumes (Fig. 6) were found for all atoms except Na, in agreement with the MD results of Angell et al. (1982) for NaAlSi2O6 using the same form of the pair potential but somewhat different numerical values. The absolute value of Va increased for all atoms as the silica content of the melt increased. Simulation results agreed closely with laboratory measurements for activation volume of O self-diffusion for NaAlSi3O8 and NaAlSi2O6 (Fig. 6d). There was an excellent correlation of Va with composition for all atoms. The absolute value of Va varied by a factor of four for Al and O and by a
factor of about two for Na and Si as the molar ratio of SiO2/Al2O3 increased from zero to six. The activation energy of self diffusion of Na was essentially independent of composition (Fig. 7). The decoupling between Na and the network atoms can be interpreted by considering that Na mobility is the sum of two terms: (1) Na jump motion in the locally frozen (in a relative sense) O-Si-Al network and (2) the coupling between tracer dynamics and O-Si-Al network hydrodynamics. This coupling leads to a generalized Stokes-Einstein (S-E) or Eyring relation, D ; h2a. When mechanism 2 dominates, the classical S-E or Eyring relationship (a 5 1) is recovered. If instead the hopping mode (mechanism 1) dominated, the viscosity of the network plays a small role in the mobility of the cation and a → 0. The weak dependence of Ea (Fig. 7a) and D(Na) (Figs. 4a and 5a) on Si/Al (a proxy for h) suggests that Na self-diffusivity is dominated by a hopping rather than a hydrodynamic mechanism. In contrast, the network species O, Si, and Al demonstrated a systematic increase in Ea with increasing silica content (Fig. 7). Self-diffusion of O, Ea increased from ;200 kJ/mol for sodium aluminate to ;350 kJ/mol in molten albite. Activation energies for self-diffusion of Si and O in molten NaAlSi2O6 determined by laboratory dif-
BRYCE ET AL.: SELF DIFFUSION IN NaAlO2-SiO2
351
FIGURE 5. Self-diffusivity of Na (a), Al (b), Si (c), and O (d) in nepheline, jadeite, and albite melts for T ; 5000 K. Peak in self-diffusivity for Si, Al, and O occurs around 20 to 25 GPa for all atoms and all compositions except sodium. The slope of these curves are directly related to the magnitude of the activation volume for diffusion for each atom. Along a given isobar, Di is a function of composition. Note in a (and Fig. 4a) the relative difference in dependence of Na and network (O, Si, and Al) selfdiffusivity on composition.
fusion studies (Shimizu and Kushiro 1984, 1991) are plotted in Figures 7c and 7d for comparison; agreement appeared reasonable in both cases. The observed trend was qualitatively consistent with laboratory viscometric data of the activation energy for viscous flow (Eh) in the system NaAlSiO4-SiO2 presented in Stein and Spera (1993). They found Eh of 345 kJ/mol, 400 kJ/mol and 450 kJ/ mol for molten Ne, Jd, and Ab respectively at 100 kPa and temperatures ;1800 K. Similarly, in a recent study, Toplis et al. (1997) reported activation energy for viscous flow of 320 kJ/mol, 370 kJ/mol and 390 kJ/mol for Ne, Jd, and Ab at 100 kPa. In general, along an isotherm, higher diffusivities were found with decreasing SiO2/ Al2O3 (Fig. 8).
DISCUSSION Comparisons of simulation and laboratory results Close agreement with laboratory data of pressure and temperature dependence of ionic self-diffusivity has been shown for NaAlSi2O6 (Figs. 6 and 7; Bryce et al. 1997). The pressure derivative of O self-diffusivity based on laboratory experiments on molten albite (Poe et al. 1997) also agreed with MD-computed values (Fig. 6d). Simulation results for the pre-exponential or ‘‘frequency’’
terms (D0) for ionic self-diffusivity, however, did not agree closely with laboratory results (Bryce et al. 1997). In our simulations, the pressure at which D(O) attained a maximum for albite melt at 5000 K was 20 to 25 GPa; at this pressure, the predominant species are TO5 and TO6. Structural data from the simulations were roughly consistent with the interpretation of high-pressure infrared spectra of albite glass of Williams (1998) who found that at P . ;16 GPa a coordination change in albite glass from TO4 to TO5 and TO6 occurred. Our MD peak in D(O), whereas agreeing with that in another MD parameterization (Angell et al. 1982), occurred at a higher pressure than the laboratory result of Poe et al. (1997) [maximum for D(O) at P ; 6 GPa at 2100 K]. The pressure at which D(O) attained a maximum may be sensitive to the choice of Aij and Bij in the pair-potential used as well as simplifications inherent in this MD application (neglect of polarization and covalency). Supplementary high-pressure diffusion experiments would also help to clarify the picture. Additional comparisons can be made with experimental viscometry by Kushiro (1976, 1978) on NaAlSi2O6 and NaAlSi3O8 melts at 1350 8C and 1400 8C respectively at pressure in the range 0 to 2.5 GPa. Based on these
352
BRYCE ET AL.: SELF DIFFUSION IN NaAlO2-SiO2
FIGURE 6. Activation volume calculations by composition and species for simulations , 15 GPa (computed from best fit lines to data in Figure 6 and polythermal data (jadeite and albite). (a) Sodium activation volumes are positive and increase with increasing silica content in the melts. (b) Aluminum activation volumes are negative and decrease with increasing silica content.
(c) Silicon activation volumes behave the same as aluminum. Experimental result for Si self-diffusivity of Kushiro (1991) of 213 cm3/mol plots off the scale of figure. (d) O activation volumes behave like network-forming cations. Experimental results shown for albite from Poe et al. (1997) for P , ;6 GPa and Shimizu and Kushiro (1984) for data up to 2 GPa.
data, we computed activation volumes for viscous flow of 6.5 6 2 and 8.0 6 2 cm3/mol for molten Jd and Ab respectively. In this MD study, we found 25.9 6 1 and 27.7 61 cm3/mol for activation volumes of O self-diffusivity in Jd and Ab respectively. The pressure derivative of O self-diffusivity should approximate the magnitude of the pressure derivative of the shear viscosity, because both phenomena most likely relate to the O mobility. Because the viscometric experiments were carried out isobarically, whereas the simulations were done isochorically, a small discrepancy between laboratory and MD-computed results can be anticipated. Meade and Jeanloz (1987) measured an activation volume for the irreversible compaction of fused silica of 7.9 6 1.7 cm3/mol. They proposed that the relaxation process involved a change from Si-O-Si bond bending to distortion of the Si-O bond length (i.e., distortion of SiO4 tetrahedra). These results were roughly compatible with the relations depicted in Figure 7d. In a 324-particle MD study of molten silica, Kubicki and Lasaga (1988) determined self-diffusivities for Si and O at 6000 K, 4 GPa
and 10 GPa. From these values, we calculated activation volumes of 29 cm3/mol and 212 cm3/mol respectively. Again, the agreement was quite reasonable, given the different forms of the potentials and intrinsic differences in the details of the simulations themselves. At 6000 K, the O self-diffusivity in molten SiO2 maximized at pressures .15 GPa. This compared with the maximum attained in NaAlO2-NaAlSi3O8 of circa 20 to 25 GPa found here. Our value of ;90 kJ/mol for activation energy of sodium self-diffusivity may be compared to the laboratory results of 70 kJ/mol (by MAS-NMR, George and Stebbins 1995) and 71 kJ/mol (by NMR, Liu et al. 1987). George and Stebbins (1995) also reported a mean coordination number for O around Na of 7 to 8 in albite, which compared well to the 4 GPa average of 8 from the simulated albite liquids. Yarger et al. (1995) investigated the coordination environment of Al by 27Al MAS-NMR in a 50:50 molar mixture of albite and sodium tetrasilicate (Na3AlSi7O17) glass quenched isobarically from about 2000 8C. They found a maximum in the concentration of [5]Al in glass
BRYCE ET AL.: SELF DIFFUSION IN NaAlO2-SiO2
353
FIGURE 7. Activation energies calculated for each composition by species. (a) Trend in activation energy for Na self-diffusion compromised given the uncertainties for Ea. (b) Aluminum activation energy increases with increasing silica content of the melt. (c) Silicon activation energy behaves similarly; laboratory result of Shimizu and Kushiro (1991) plotted for comparison. (d) Activation energy for O self-diffusion also increases with increasing silica content. Laboratory results of Shimizu and Kushiro (1984) plotted for comparison (see also Bryce et al., 1997).
quenched from 8 GPa and suggested a change in the rate of decrease in viscosity near that pressure. Qualitatively, that is similar to what the MD simulations suggested in the system NaAlO2-NaAlSi3O8, although we found that [5] Al maximized at a slightly higher pressure of ;20 to 25 GPa at 5000 K. A rigorous comparison between the MD results and those of Yarger et al. (1995) was difficult because of the differences in composition (laboratory study contains . 10% NBO) and the lingering question of the preservation of high-coordination TOn species upon quenching and decompression (Wolf and McMillan 1995, for discussion).
FIGURE 8. O self-diffusion at T ; 5000 K as a function of composition along 3 GPa (filled squares) and 13 GPa (filled circles) isobars. Computed activation volumes (Fig. 6) were used to calculate D(O) in molten NaAlO2 at 3 GPa and to interpolate O self-diffusivity in NaAlSiO2 to 13 GPa. Viscosity data from Toplis et al. (1997) at 1 bar show a steeper trend as expected given the variation of Va with composition and the difference in pressure between 3 GPa and 1 bar.
O lattice configurational entropy model The most important result from the simulations was the striking variation of the activation enthalpy for self-diffusion of Na, Al, Si, and O with bulk composition. The temperature dependence (Ea , Fig. 7) and pressure dependence (Va , Fig. 6) of the Arrhenian activation enthalpy, Ha 5 Ea 1 PVa were both determined from analysis of MD atom trajectories. Activation volume became increasingly negative as Si/Al increased for O, Si, and Al, whereas the opposite was true for Na. The overall variation in Va with composition was quite large; for example,
354
BRYCE ET AL.: SELF DIFFUSION IN NaAlO2-SiO2
Va for O varied by a factor of 4 as Si/Al increased from 0 (NaAlO2) to 3 (NaAlSi3O8). Similarly, the thermal activation energy (Ea) varied systematically with composition (Si/Al). Applying the Adam-Gibbs-DiMarzio (AGD) theory of configurational entropy has been proposed to explain the negative pressure dependence of viscosity in liquids (Richet 1984; Gupta 1987). Bottinga and Richet (1995) provided an analysis that connected the pressure dependence of the shear viscosity with the temperature derivative of the configurational volume (i.e., the difference in volume between the liquid and glass) and the mixing of [1]O and [2] O on the O superlattice. The expression they derived for the rate of change of shear viscosity with pressure along an isotherm was:
[ ] ] ln(h) ]P
5 T
[ ] []
1
]
2
Be ]Vconf ]j j 1 RN0 ln . 2 TS conf ]T P ]P T 12j
(1)
where Be is a positive constant for a given composition independent of temperature and pressure; Sconf is the configurational entropy computed from isobaric heat capacity data for glass and melt; Vconf is the configurational molar volume, Vconf 5 VL 2VG where the subscripts refer to liquid and glass, respectively; NO is the number of O atoms per gram formula weight divided by the number of oxide moles (e.g., in the NaAlO2-SiO2 system, NO 5 2) and j is the number fraction of [2]O defined according to j 5 [2] O/([2]O 1 [1]O). It is useful to perform a sign analysis of Equation 1. The term involving Be is always .0. The temperature derivative of the configurational volume is generally positive in silicates and aluminosilicates; in silica-rich melts, it can approach zero. The derivative (]j/]P)T is negative in molten silicates, because the partial molar volume of [2] O (bridging O or BO) is greater than the partial molar volume of [1]O (non-bridging O or NBO). In crystalline silicates, this is virtually always the case as well. For example, the molar volume per O atom for a-olivine (all O is [1]O), tridymite (all O is [2]O) and stishovite (all O is [3] O) are 11 cm3, 13.3 cm3, and 7.0 cm3 respectively. The sign of ln[j/(1 2 j)] changes at j 5 0.5. If j . 0.5, then {ln[j/(1 2 j)]} . 0, whereas for j , 0.5, {ln[j/(1 2 j)]} , 0. Based on this analysis, Bottinga and Richet (1995) proposed that the so-called anomalous behavior of decreasing viscosity with increasing pressure was most likely to occur in silica-rich melts characterized by a small absolute value of (]Vconf /]T)P and dominated by [2]O (i.e., j . 0.5). Although the configurational entropy model with mixing of [1]O and [2]O outlined above explained the compositional variation of the pressure dependence of viscosity for melts as they became richer in SiO2 (and hence [2]O . [1]O), it did not explain the ‘‘return’’ to non-anomalous behavior in silicate melts at higher pressures nor could it explain the pressure dependence of O self-diffusivity in a series of network melts. Although ‘‘defect’’ concentrations of [1]O (NBO) were known to occur in network silicate liquids (Stebbins and Xu 1997), it seems reasonable
to assume the concentration of [1]O does not play a critical role in melt dynamics at high pressure. The AGD model can be extended and applied to network melts with insignificant amounts of NBO but where a significant amount of entropy is generated by mixing of [2]O and [3]O on an O ‘‘superlattice.’’ Molecular dynamics results may be used to address this issue by first noting that an implication of the Stokes-Einstein or Eyring relationship, [h ; TD(O)21], is the equality (] ln h/]P)T 5 2{] ln[D(O)]/]P}T. If the Arrhenian relationship is assumed to hold for self-diffusivity (i.e., D 5 D0exp2[(Ea 1 PVa)/RT]), then because Va 5 2RT{] ln[D(O)]/]P}T , the activation volume for O self-diffusion can be identified with the pressure-derivative of the logarithm of the shear viscosity: Va 5 RT(] ln h/]P)T . We adapted the Bottinga and Richet application of the configurational entropy theory to a melt dominated by [2]O and [3]O by defining the fraction of [2]O according to c 5 [2] O/([2]O 1 [3]O). Figure 2 shows that a [2]O 2 [3]O binary mixture is a good description of O coordination environments in melts along the join NaAlO22SiO2 up to at least 45 GPa. We can therefore rewrite the (] ln(h)/]P)T expression given above in terms of ln D(O):
[
]
] ln(D(O)) ]P
52 T
[ ] []
]
1
2
Be ]Vconf ]c c 1 RN0 ln . 2 TS conf ]T P ]P T 12c (2)
Noting relations set out above we finally have: Va 5
[ ] []
1
]
2
RBe ]Vconf ]c c 1 RN0 ln . 2 S conf ]T P ]P T 12c
(3)
Like (]j/]P)T, (]c/]P)T is also generally negative because the partial molar volume of [2]O is greater than that of [3] O. As noted in Figure 2, O was forced into higher coordination environments with T as pressure increased. The sign of the second term on the right-hand sign of Equation 3 is, therefore, controlled by the sign of ln[c/(1 2 c)]. As in the case before, the mixing term changes sign when [2]O 5 [3]O 5 0.5. In the system NaAlO2 2 NaAlSi3O8, the abundance of [3]O approaches that of [2]O in the P ; 25 to 30 GPa pressure range where the activation volume for O becomes positive (i.e., the ‘‘anomalous’’ behavior is no longer present). For entropic effects to dominate, the absolute magnitude of the second product term on the right hand side of (3) must be greater than the temperature derivative of the configurational volume. For a scale analysis, the term (]Vconf /]T)P defined as aLVL 2 aGVG, could be approximately taken as ;0.5 aLVL, which is almost always positive (with the possible exception of amorphous silica). In detail, (]Vconf /]T)P varies in magnitude depending on the concentration of SiO2. The relative contribution from this term is reflected in the Va values for the compositions seen in Figures 6a–d: Albite melts have the smallest contribution from (]Vconf /]T)P because they are silica-rich, whereas in NaAlO2, Va is smaller in absolute value because the configurational volume term is larger.
BRYCE ET AL.: SELF DIFFUSION IN NaAlO2-SiO2
Hence, the AGD theory that Bottinga and Richet developed to address the zero-pressure derivative of the shear viscosity in melts with NBO and BO mixing may be extended to explain the variation of viscosity with pressure for a homologous series of network melts to very high pressure. The restriction to binary mixing could be easily relaxed by adopting an appropriate relationship for the entropy of mixing which takes into account all distinct O coordination environments. It is, therefore, possible to predict the pressure-dependence of the viscosity and, hence, O self-diffusivity by combining MD results with laboratory experimental data. Richet (1984) showed that the temperature-dependence of the shear viscosity can be accurately modeled by the AGD theory provided highquality thermodynamic data are available for the compositions of interest. Molecular dynamics results can be used to apply the AGD theory to molten silicates in a broad range of compositions (i.e., O coordination environments) and at elevated temperatures and pressures to the core-mantle boundary (135 GPa) where evidence indicates that magma exists (e.g., Garnero and Helmberger 1996; Williams and Garnero 1996).
ACKNOWLEDGMENTS This study has benefited from computational support from and discussions with Alain Trial and Dean Nevins. We especially thank Jim Kubicki and Bjorn Mysen for helpful and constructive reviews. Supercomputer time from NERSC and SDSC (by way of the UCSB Supercomputing committee) is greatly appreciated. Financial support for this work has been provided by the UCSB Graduate Division, Department of Energy grant DE-FG03-91ER14211 and National Science Foundation grant EAR9627800. This report is Institute for Crustal Studies contribution number 0307-48CM.
REFERENCES CITED Allen, M.P. and Tildesley, D.J. (1987) Computer Simulation of Liquids. Oxford University Press, New York. Angell, C.A. (1995) Formation of glasses from liquids and biopolymers. Science, 267, 1924–1935. Angell, C.A., Cheeseman, P., and Tamaddon, S. (1982) Pressure enhancement of ion mobilities in liquid silicates from computer simulation studies to 800 kilobars. Science, 218, 885–887. Angell, C.A., Cheeseman, P.A., and Kadiyala, R.R. (1987) Diffusivity and thermodynamic properties of diopside and jadeite melts by computer simulation studies. Chemical Geology, 62, 83–92. Bottinga, Y. and Richet, P. (1995) The anomalous pressure dependence of the viscosity. Geochimica et Cosmochimica Acta, 59, 2725–2731. Bryce, J.G. (1998) Aspects of alkaline and basaltic magmagenesis, Doctorate thesis, University of California, Santa Barbara, California. Bryce, J.G., Spera, F.J., and Stein, D.J. (1997) Dependence of self-diffusivity on P and T in molten NaAlSi2O6: comparison of laboratory and molecular dynamics experiments. Geophysical Research Letters, 24, 711–714. Della Valle, R.G. and Andersen, H.C. (1992) Molecular dynamics simulation of silica liquid and glass. Journal of Chemical Physics, 97, 2682– 2689. Dempsey, M.J. and Kawamura, K. (1984) Molecular Dynamics simulation of the structure of aluminosilicate melts. Progress in Experimental Petrology at National Environmental Research Council, 6, 49–56. Erikson, R.L. and Hostetler, C.J. (1987) Application of empirical ionic models to SiO2 liquid: Potential model approximations and integration of SiO2 polymorph data. Geochimica et Cosmochimica Acta, 51, 1209– 1218. Feuston, B.P. and Garofalini, S.H. (1988) Empirical three-body potential for vitreous silica. Journal of Chemical Physics, 89, 5818–5824.
355
Garnero, E.J. and Helmberger, D.V. (1996) Seismic detection of a thin laterally varying boundary layer at the base of the mantle beneath the central-Pacific. Geophysical Research Letters, 23(9), 977–980. Gaskell, P.H., Eckersley, M.C., Barnes, A.C., and Chieux, P. (1991) Medium-range order in the cation distribution of a calcium silicate glass. Nature, 350, 675–677. George, A.M. and Stebbins, J.F. (1995) High-temperature 23Na MAS NMR data for albite—comparison to chemical-shift models. American Mineralogist, 80, 878–884. Gupta, P.K. (1987) Negative pressure dependence of viscosity. Communications of the American Ceramic Society, 70, C152–153. Hess, P.C. (1995) Thermodynamic mixing properties and the structure of silicate melts. In J.F. Stebbins, P.F. McMillan and D. B. Dingwell, Eds., Structure, Dynamics and Properties of Silicate Melts, 32, p. 145–189. Mineralogical Society of America, Washington, D.C. Jin, W., Kalia, R.K., Vashishta, P., and Rino, J.P. (1993) Structural transformation, intermediate-range order and dynamical behavior of SiO2 glass at high pressures. Physical Review Letters, 71, 3146–3149. Kawamura, K. (1991) A molecular dynamics simulation of Na2O· 2SiO2— K2O·2SiO2 melts: effect of basic cell size. Molecular Simulation, 6, 245–255. Kubicki, J.D. and Lasaga, A.C. (1988) Molecular dynamics simulations of SiO2 melt and glass: ionic and covalent models. American Mineralogist, 73, 941–955. (1990) Molecular dynamics and diffusion in silicate melts. In J. Ganguly, Ed., Diffusion, Atomic Ordering, and Mass Transport: Selected Problems in Geochemistry, 8, p. 1–50. Springer-Verlag, New York. Kushiro, I. (1976) Changes in viscosity and structure of melt of NaAlSi2O6 composition at high pressures. Journal of Geophysical Research, 81, 6347–6350. (1978) Viscosity and structural changes of albite (NaAlSi3O8) melt at high pressures. Earth and Planetary Science Letters, 41, 87–90. Liu, S.B., Pines, A., Brandriss, M., and Stebbins, J.F. (1987) Relaxation mechanisms and effects of motion in albite (NaAlSi3O8) liquids and Glass: A high-temperature NMR study. Physics and Chemistry of Minerals, 15, 155–162. Matsui, M. and Kawamura, K. (1984) Computer simulation of structures of silicate melts and glasses. In I. Sunagawa, Ed., Materials Science of the Earth’s Interior, p. 3–23. Reidel, Boston. Meade, C. and Jeanloz, R. (1987) Frequency dependent equation of state of fused silica to 10 GPa. Physical Review B, 35, 236–244. Mitra, S.K. (1982) Molecular dynamics simulation of silicon dioxide glass. Philosophical Magazine B, 45, 529–548. Navrotsky, A. (1995) Energetics of silicate melts. In J.F. Stebbins, P.F. McMillan and D. B. Dingwell, Eds. Structure, Dynamics and Properties of Silicate Melts, 32, p. 121–143. Mineralogical Society of America, Washington, D.C. Nevins, D. and Spera, F.J. (1998) Molecular dynamics simulations of molten CaAl2Si2O8: Dependence of structure and properties on pressure. American Mineralogist, 83, 1220–1230. Poe, B.T., McMillan, P.F., Rubie, D.C., Chakraborty, S., Yarger, J. and Diefenbacher, J. (1997) Silicon and O self-diffusivities in silicate liquids measured to 15 Gigapascals and 2800 Kelvin. Science, 276, 1245– 1248. Poole, P.H., McMillan, P.F., and Wolfe, G.H. (1995) Computer simulations of silicate melts. In J.F. Stebbins, P.F. McMillan and D. B. Dingwell, Eds., Structure, Dynamics, and Properties of Silicate Melts, 32, p. 563– 616. Mineralogical Society of America, Washington D.C. Richet, P. (1984) Viscosity and configurational entropy of silicate melts. Geochimica et Cosmochimica Acta, 55, 1011–1019. Rustad, J.R., Yuen, D.A., and Spera, F.J. (1990) Molecular dynamics of liquid SiO2 under high pressure. Physical Review A, 42, 2081–2089. (1991a) Molecular dynamics of amorphous silica at very high pressures (135 GPa): Thermodynamics and extraction of structures through analysis of Voronoi polyhedra. Physical Review B, 44, 2108– 2121. (1991b) The sensitivity of physical and spectral properties of silica glass to variations of interatomic potentials under high pressure. Physics of the Earth and Planetary Interiors, 65, 210–230.
356
BRYCE ET AL.: SELF DIFFUSION IN NaAlO2-SiO2
(1991c) The statistical geometry of amorphous silica at lower mantle pressures: implications for melting slopes of silicates and anharmonicity. Journal of Geophysical Research, 96, 19665–19673. (1992) Coordination variability and the structural components of silica glass under high pressures. Chemical Geology, 96, 421–437. Shimizu, N. and Kushiro, I. (1984) Diffusivity of O in jadeite and diopside melts at high pressures. Geochimica et Cosmochimica Acta, 48, 1295– 1303. (1991) The mobility of Mg, Ca, and Si in diopside-jadeite liquids at high pressures. In L. L. Perchuk and I. Kushiro, Eds. Physical Chemistry of Magmas: Advances in Physical Geochemistry, 9, p. 192–212. Springer-Verlag, New York. Stebbins, J.F., McMillan, P.F., and Dingwell, D.B, eds. (1995) Structure, Dynamics, and Properties of Silicate Melts. 616 p. Mineralogical Society of America, Washington D.C. Stebbins, J.F. and Xu, Z. (1997) NMR evidence for excess non-bridging O in an aluminosilicate glass. Nature, 390, 60–62. Stein, D.J. and Spera, F.J. (1993) Experimental rheometry of melts and supercooled liquids in the system NaAlSiO4-SiO2: Implications for structure and dynamics. American Mineralogist, 78, 710–723. (1995) Molecular dynamics simulations of liquids and glasses in the system NaAlSiO4-SiO2: methodology and melt structures. American Mineralogist, 80, 417–431. (1996) Molecular dynamics simulations of liquids and glasses in the system NaAlSiO4-SiO2: physical properties and transport mechanisms. American Mineralogist, 81, 284–302. Toplis, M.J., Dingwell, D.B., Hess, K.U., and Lenci, T. (1997) Viscosity, fragility, and configurational entropy of melts along the join SiO2– NaAlSiO4. American Mineralogist, 82, 979–990. Vashishta, P., Kalia, R.K., Nakano, A., and Jin, W. (1996) Silica under very large positive and negative pressures: molecular dynamics simu-
lations on parallel computers. International Journal of Thermophysics, 17, 169–178. Vashishta, P., Kalia, R.K., Rino, J. P., and Ebbsjo¨, I. (1990) Interaction potential for SiO2: A molecular-dynamics study of structural correlations. Physical Review B, 41, 12197–12209. Vessal, B., Amini, M., Catlow, C.R.A., and Leslie, M. (1991) Simulation studies of silicate glasses. Transactions of the American Crystallographic Association, 27, 15–34. Vollmayr, K., Kob, W., and Binder, K. (1996) Cooling-rate effects in amorphous silica: A computer-simulation study. Physical Review B, 54, 15808–15827. Williams, Q. (1998) High-pressure infrared spectra of feldspars: Constraints on compressional behavior, amorphization, and diaplectic glass formation. In M.H. Manghnani and T. Yagi, Eds., Properties of Earth and Planetary Materials at High Pressure and Temperature, Geophysical Monograph 101. American Geophysical Union, Washington, D.C. Williams, Q. and Garnero, E.J. (1996) Seismic evidence for partial melt at the base of the earth’s mantle. Science, 273, 1528–1530. Wolf, G.H. and McMillan, P.F. (1995) Pressure effects on silicate melt structure and properties. In J.F. Stebbins, P.F. McMillan, and D.B. Dingwell, Eds., Structure, Dynamics and Properties of Silicate Melts, 32, p. 505–561. Mineralogical Society of America, Washington, D.C. Woodcock, L.V., Angell, C.A., and Cheeseman, P. (1976) Molecular dynamics studies of the vitreous state: Simple ionic systems and silica. Journal of Chemical Physics, 65, 1565–1577. Yarger, J.L., Smith, K.H., Nieman, R.A., Diefenbacher, J., Wolf, G.H., Poe, B.T., and McMillan, P.F. (1995) Al coordination changes in high-pressure aluminosilicate liquids. Science, 270, 1964–1967. MANUSCRIPT RECEIVED JUNE 22, 1998 MANUSCRIPT ACCEPTED OCTOBER 12, 1998 PAPER HANDLED BY ROBERT M. HAZEN