de Fine Olivarius et al. BMC Public Health 2011, 11:80 http://www.biomedcentral.com/1471-2458/11/80
RESEARCH ARTICLE
Open Access
Prevalence and progression of visual impairment in patients newly diagnosed with clinical type 2 diabetes: a 6-year follow up study Niels de Fine Olivarius1*, Volkert Siersma1, Gitte Juul Almind1, Niels Vesti Nielsen2
Abstract Background: Many diabetic patients fear visual loss as the worst consequence of diabetes. In most studies the main eye pathology is assigned as the cause of visual impairment. This study analysed a broad range of possible ocular and non-ocular predictors of visual impairment prospectively in patients newly diagnosed with clinical type 2 diabetes. Methods: Data were from a population-based cohort of 1,241 persons newly diagnosed with clinical, often symptomatic type 2 diabetes aged ≥ 40 years. After 6 years, 807 patients were followed up. Standard eye examinations were done by practising ophthalmologists. Results: At diabetes diagnosis median age was 65.5 years. Over 6 years, the prevalence of blindness (visual acuity of best seeing eye ≤ 0.1) rose from 0.9% (11/1,241) to 2.4% (19/807) and the prevalence of moderate visual impairment (> 0.1; < 0.5) rose from 5.4% (67/1,241) to 6.7% (54/807). The incidence (95% confidence interval) of blindness was 40.2 (25.3-63.8) per 10,000 patient-years. Baseline predictors of level of visual acuity (age, age-related macular degeneration (AMD), cataract, living alone, low self-rated health, and sedentary life-style) and speed of continued visual loss (age, AMD, diabetic retinopathy (DR), cataract, living alone, and high fasting triglycerides) were identified. Conclusions: In a comprehensive assessment of predictors of visual impairment, even in a health care system allowing self-referral to free eye examinations, treatable eye pathologies such as DR and cataract emerge together with age as the most notable predictors of continued visual loss after diabetes diagnosis. Our results underline the importance of eliminating barriers to efficient eye care by increasing patients’ and primary care practitioners’ awareness of the necessity of regular eye examinations and timely surgical treatment.
Background In Europe and the United States severe visual impairment may be 2-3 times more common among people with diabetes than in the general population [1,2], but this difference decreases with age [2]. Diabetic retinopathy (DR) is regarded as the cause of blindness in 5-15% of the blind in the general population [3-5] and in 30-50% of blind type 2 diabetic patients [6,7]. There are, however, huge regional differences in presumed causes of blindness across the world [8]. DR is considered the * Correspondence:
[email protected] 1 The Research Unit for General Practice and Section of General Practice, Department of Public Health, University of Copenhagen, Copenhagen, Denmark Full list of author information is available at the end of the article
leading cause of blindness among people of working age in many countries [3-5], while age-related macular degeneration (AMD) is considered the leading cause in people over 65 years [3-5,9]. Diabetes with even mildly to moderately impaired sight has a negative impact on perceived quality of life and psychosocial functioning giving rise to feelings of vulnerability, worries about the future and loss of independence and mobility [10-12]. A sizeable proportion of type 2 diabetic patients fear visual loss intensely [13] and consider loss of vision the worst complication of diabetes [10]. For the health practitioner visual acuity is a ubiquitous and handy measure of visual function, but visual acuity is not a suitable measure of future visual loss as the sight-threatening eye pathologies often are
© 2011 de Fine Olivarius et al; licensee BioMed Central Ltd. This is an Open Access article distributed under the terms of the Creative Commons Attribution License (http://creativecommons.org/licenses/by/2.0), which permits unrestricted use, distribution, and reproduction in any medium, provided the original work is properly cited.
de Fine Olivarius et al. BMC Public Health 2011, 11:80 http://www.biomedcentral.com/1471-2458/11/80
present for many years before vision begins to decline as a result of these pathologies. In the history of diabetes treatment, the development of diabetic retinopathy has been included in the outcome of numerous clinical trials though prevention of visual loss is the ultimate target for the patients. While the ocular predictors of future visual loss in diabetic patients are well-described [14-19], a comprehensive prospective study of ocular and non-ocular predictors of long-term changes in measured visual acuity has not been published before [14,16,19-23]. Our main aim was to study a broad range of predictors of vision loss in a population-based sample of patients newly diagnosed with type 2 diabetes and observed for 6 years.
Methods
Page 2 of 13
Inclusion criteria: 474 doctors were to include all patients on their practice list fulfilling the following criteria: 1) Diabetes mellitus diagnosed from 1 March 1989 to 28 February 1991 (71 doctors volunteered for a 1-year extension of this period) 2) Based on hyperglycaemic symptoms and/or raised blood glucose values measured in general practice, the diagnosis was established by a single whole blood or plasma glucose concentration 7.0/8.0 mmol/l measured at a major laboratory 3) Age 40 years or older at diagnosis
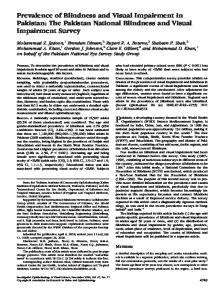
Eligible patients (n = 1590) Primary exclusions: Severe somatic disease (n = 50) Severe mental illness (n = 50) Declined to consent (n = 62) Secondary exclusions: Diagnosis not confirmed (n = 47) Patients included in main study (n = 1381)
Study population
In the Danish Diabetes Care in General Practice study [24], 474 general practitioners agreed to include all subjects with newly diagnosed diabetes on their practice list (Figure 1). The 140 patients without a measurement of visual acuity at diagnosis did not differ from the 1,241 patients who were included in the present study regarding age (p = 0.36), sex (p = 0.31) and diagnostic plasma glucose (p = 0.81). At 6-year follow up, the 159 noncensored patients without information about visual acuity (Figure 1) did not differ from the 807 re-examined patients with regard to age (p = 0.23), sex (p = 0.82), diagnostic plasma glucose (p = 0.43), prevalence of DR at diagnosis (3.2% (5/158) vs. 4.4% (35/800), p = 0.49) and prevalence of moderately impaired vision or worse at diagnosis (7.0% (11/159) vs. 3.3% (27/807), p = 0.10). A small number started insulin treatment within 180 days of diagnosis, so 97.6% of the 1381 patients who had started in the study were considered to have type 2 diabetes [24]. Informed consent was obtained from all participants, and the protocol was approved by the ethics committee for Copenhagen and Frederiksberg. Ophthalmologic examination
Immediately after diabetes diagnosis, the general practitioner referred the patient to a practising ophthalmologist who did a standard eye examination. The result of the funduscopy was recorded by the ophthalmologist in a multiple choice question with six response categories: no diabetic lesions, microaneurysms only, background retinopathy without or with maculopathy, and proliferative retinopathy without or with new vessels on the optic disc. In open-ended questions information about other retinal pathologies, glaucoma, and eye operations was given, and the presence of cataract was indicated in a closed question. Information about glaucoma was also given as answers to open-ended questions about reasons
Missing eye examination at diabetes diagnosis (n = 137) Missing measurement of visual acuity (n = 3) Patients with visual acuity measured at diabetes diagnosis and included in the present study (n = 1241) Died before follow-up (n = 264) Withdrew consent (n = 7) Lost to follow-up (n = 4) Missing eye examination at follow-up (n = 154) Missing measurement of visual acuity (n = 5) Patients with visual acuity measured at diagnosis and 6-year follow-up (n= 807 )
Figure 1 Flow of participants through study.
for impaired vision. Visual acuity with best correction was estimated with an optotype chart, usually a Snellen chart, and given for each eye as the Snellen ratio at 6 metres or 20 feet or as decimal acuity, but all measurements were converted to decimal acuity and logMAR [25]. The time (interquartile range, IQR) from diabetes diagnosis until the first eye examination was 45 (24-83) days. A total of 164 ophthalmologists participated, and 68.5% (553/807) of patients were seen by the same ophthalmologist at first and last eye examination. The eye with best visual acuity was used for evaluation of retinal pathology. Assessments
The doctors recorded the following information about the patient: height and weight without shoes and outer garments; blood pressure and heart rate by routine methods after a 10-minute rest in a sitting position; sense of touch of cotton wool and pin prick on both feet; presence of dorsalis pedis or posterior tibial pulse on both feet; presence of patellar reflexes; history of
de Fine Olivarius et al. BMC Public Health 2011, 11:80 http://www.biomedcentral.com/1471-2458/11/80
myocardial infarction and/or stroke causing hospitalization; and amputation of any part of leg or foot before or at the time of diabetes diagnosis. In questionnaires, patients gave information about whether they lived alone, their education, familial disposition to diabetes, smoking habits, leisure time physical activity, angina pectoris, intermittent claudication, and global self-rated health. Definitions
The decimal acuity of patients’ best seeing eye was used to categorise patients according to usual clinical and administrative practice in Denmark: normal vision (≥ 0.5), moderate visual impairment (< 0.5 and > 0.1) or blindness (≤ 0.1). Cardiovascular disease was defined as history of myocardial infarction and/or history of stroke and/or angina pectoris and/or intermittent claudication and/or absent arterial pulses on both feet and/or amputation on the lower extremities. Peripheral neuropathy was defined as lack of a sense of pin prick and/or touch of cotton wool on at least one foot and/or absent patellar reflex on at least one knee. Assays
Laboratory analyses were centralized and quality controlled. Fasting blood samples were analysed at Odense University Hospital. Throughout the study, haemoglobin A1c (HbA1c) was determined by the same ion-exchange, high-performance liquid chromatography method. Samples from 100 blood donors (age 20-80 years, 33 men, 67 women) were analysed, and the reference interval (mean ± 2SD) was calculated to be 5.4-7.4%. Quality assurance was obtained with commercial control preparations from Bio-Rad. In October-December 1995, the mean (SD) of low (n = 24) and high (n = 29) control samples were 6.7 (0.31)% and 10.4 (0.63)%, respectively, resulting in coefficients of variation (CV = SD × 100/ mean) of 4.6% and 6.0%. Serum total cholesterols were measured enzymatically with cholesterol esterasecholesterol oxidase-peroxidase reagent, and fasting serum triglycerides was determined enzymatically with a lipase-glycerolkinase-glycerol-3-phosphate oxidaseperoxidase reagent. Serum creatinine was determined by the Jaffe reaction. In this nationwide study a freshly voided morning urine sample was used instead of timed urine collection to determine renal involvement. Urinary albumin concentration was measured at Århus University Hospital by a polyethylene glycol radioimmunoassay. Spot urinary albumin concentration is of value in predicting both progression of renal involvement and increased mortality, as is albumin excretion rate [26]. Statistical analysis
The influence of baseline characteristics on change in visual acuity over 6 years was investigated in linear
Page 3 of 13
mixed models [27] using all available measurements of visual acuity from the best seeing eye. For each of the characteristics two models were constructed: one model where the change in visual acuity was described by a linear time trend (intercept and slope for the average change in visual acuity during the study) that differed for each of the categories of the characteristic, and a second model where the time trend additionally depended on age and sex in a multivariable regression fashion. Within-patient correlation of the observations was modelled by a patient random effect. The effect of the characteristic on changes in visual acuity was summarized with the fixed effect intercept and slope for each of the covariate classes from the first model (i.e. excluding age and sex). Differences between the covariate categories in intercept and slope in the two models were tested with the appropriate F-tests. In the 5.8% (72/1241) of patients who had an eye operation in the best seeing eye during follow up, measurements of visual acuity made after the operation were excluded from the analyses. For the patients who were not moderately visually impaired or blind at baseline, incidence rates for these conditions were estimated as the ratio between (1) the number of patients with moderately impaired vision/ blindness at follow up and (2) the sum of follow up times. The follow up times were halved for patients who became moderately visually impaired or blind during follow up, and confidence intervals were calculated assuming Poisson-distributed occurrences of vision impairment. Simple comparisons were made with Kruskal-Wallis tests and c 2-tests. To account for multiple statistical testing, we applied the method of BenjaminiHochberg [28] on all the four columns of p-values in Table 1, i.e. 4 × 28 = 112 p-values, and found that a significance level of 0.0179 was to be used in order to control the false discovery rate at 5%. Accordingly, the nominal level of statistical significance was chosen to be p < 0.05, except in the mixed models in Table 1, where it was p < 0.01.
Results Baseline characteristics
At diabetes diagnosis median (IQR) age was 65.5 (56.073.6) years, male/female ratio was 1.11 (653/588), and median diagnostic plasma glucose was 13.7 (10.7-17.0) mmol/l. The prevalence (95% confidence interval) of blindness and moderate visual impairment was 0.9 (0.41.4) % and 5.4 (4.1-6.7) %, respectively (Table 2). AMD, other non-diabetic retinopathy and, above all, cataract were common. The ophthalmologists estimated that cataract was the most common cause of visual impairment except among the blind (Table 2). At diagnosis the eye doctors reported glaucoma in the best seeing eye in 18
de Fine Olivarius et al. BMC Public Health 2011, 11:80 http://www.biomedcentral.com/1471-2458/11/80
Page 4 of 13
Table 1 Average changes in visual acuity during the first 6 years after diabetes diagnosis according to baseline patient characteristics Test of difference in level of logMAR at diabetes diagnosisa Characteristic at diagnosis
Category
n
Average logMAR at diabetes diagnosis
Average yearly change in logMAR after diabetes diagnosis
1241
-0.24
-0.0250
Female
588
-0.30
-0.0343
Male
653
-0.19
-0.0160
40- < 60 60- < 70
430 377
-0.05 -0.18
-0.0068 -0.0125
≥ 70
434
-0.47
-0.0769
Total Sex
Age (years)
Living alone
Education
Residence
Familial disposition to DM
Diagnostic plasma glucose (mmol/l)
Haemoglobin A1c (%)c
Total cholesterol (mmol/l)
Yes
384
-0.39
-0.0527
No
835
-0.17
-0.0158
Basic
935
-0.26
-0.0293
Higher
252
-0.15
-0.0114
Countryside
486
-0.26
-0.0269
Larger towns
430
-0.24
-0.0211
Copenhagen area
273
-0.20
-0.0211
No
659
-0.25
-0.0314
Yes
466
-0.23
-0.0195
< 10
220
-0.23
-0.0227
10-< 17
706
-0.24
≥ 17
315
-0.24