Vol. 9(1), pp. 1-8, January 2017 DOI: 10.5897/JPHE2016.0883 Article Number: 19B5F0562300 ISSN 2141-2316 Copyright © 2017 Author(s) retain the copyright of this article http://www.academicjournals.org/JPHE
Journal of Public Health and Epidemiology
Full Length Research Paper
Prevalence of occupational injuries and associated factors among construction workers in Addis Ababa, Ethiopia Hanna Mersha1, Seid Tiku Mereta2* and Lamessa Dube1 1
Department of Epidemiology, Jimma University, P. O. Box 378, Jimma, Ethiopia. Department of Environmental Health Science and Technology, Jimma University, P. O. Box 378, Jimma, Ethiopia.
2
Received 16 October, 2016: Accepted 16 November, 2016
The present study aimed to determine the prevalence of occupational injuries and associated factors among building construction workers. A cross-sectional study was conducted in 15 licensed building construction companies in Addis Ababa, the capital city of Ethiopia. A multi-stage sampling was used to recruit 809 study participants. Data was collected using face to face interview and observational checklist. The data were analyzed using SPSS version 20 statistical software. Bivariate and multivariate logistic regression analyses were performed. A total of 683 (84.7%) respondents reported occupational injuries during the past 12 months giving an overall annual prevalence rate of 847 injuries per 1000 construction workers. Of the total 683 injured respondents, 74 (10.8%) were hospitalized. The odds of injuries were two times higher among males when compared with females (OR=2.17, 95%CI (1.47-3.19). Not having job satisfaction increased the odds of occupational injuries by about four folds as compared to those who are satisfied with their job (OR = 4.82, 95% CI (2.75-8.46). Working for more than 48 h per week, lack of vocational trainings, not using of personal protective equipment had significantly contributed to the higher risks of occupational injuries. Key words: Construction, injury, health, occupational safety, prevalence.
INTRODUCTION Occupational injuries have been rendered as one of the most important crippling factors contributing to disabilities and life threatening situations in the developed and developing countries (Majori et al., 2002). The International Labor Organization (ILO) estimates that there are over 270 million occupational accidents causing two million deaths annually (ILO, 2016). The cost of occupational accidents account to 4% of the world’s
gross domestic product (GDP) (USD 1.25 trillion). Occupational injuries can pose direct costs, like suffering, loss of employment, disability and loss of productivity, and indirect costs on families and society (Tadesse and Israel, 2016). Occupational injuries can generate significant costs to employers, place a burden on healthcare providers and potentially have a detrimental effect on the long-term health and socio-economic status
*Corresponding author. E-mail:
[email protected]. Tel: +251913296056. Author(s) agree that this article remain permanently open access under the terms of the Creative Commons Attribution License 4.0 International License
2
J. Public Health Epidemiol.
of injured workers (Macdonald et al., 2012). Studies demonstrated that illnesses, traumatic injuries and fatalities are more prevalent among workers in the construction industry than in other occupational groups in developing and developed countries (Probst et al., 2008; Moore et al., 2013; Khosravi et al., 2014). Within the construction industry, the risk of fatality is five times higher than in manufacturing, whilst the risk of a major injury is two and half times higher (Sawacha et al., 1999). The construction industry is subject to high occupational risk and high rates of occupational accidents, occupational diseases and absenteeism at work. Workers in the construction sector are more exposed to mechanical, biological, chemical and ergonomic risk factors. Occupational injuries and fatalities within the construction industry have also been associated with considerable financial costs. It has been estimated that such injuries cost over 10 billion USD per year (Gittleman et al., 2010). The impact of occupational health and safety hazards faced by construction workers in developing countries is 10 to 20 times higher than those in Industrialized countries (Dong, 2005). The poor occupational safety situation among construction workers in developing countries are because of unsafe working environments such as poor design of equipment and work stations; lack of personal protective equipment and inadequate training of workers. While unsafe working environments are the major cause of most workplace injuries, individual related factors such as young age, male sex, lack of formal education, lack of experience, job dissatisfaction, smoking, excess alcohol use, sleeping problems, lack of physical exercise, extended working hours, night work, physically demanding work, and non-use of personal protective equipment are essential factors (Wong, 1994; Huang and Chen, 2002; Chau et al., 2004; Bresciani et al., 2012, Dong et al., 2015). About three-fifth of construction workers are not sure whether they have to wear protective equipment on the construction sites. They felt that it is inconvenient and uncomfortable when wearing protective equipment at work (Griffin and Neal, 2000). Moreover, studies have shown that young workers (5 years
608 198
75.4 24.6
Monthly salary (in Ethiopian Birr) 200-500 501-1000 1001-1500 >1500
273 428 64 41
33.9 53.1 7.9 5.1
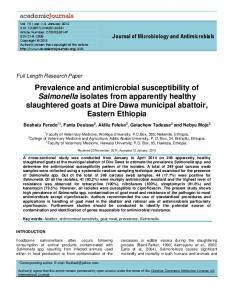
monthly salary of between 501 and 1000 Ethiopian birr (Table 1). From the total of 806 respondents, 532 (66.0%) were daily laborers, 76 (9.4%) were plasterer, 46 (5.7%) were carpenters and 44 (5.5%) were masonry workers (Figure 1).
Prevalence of occupational injury A total of 683 (84.7%) respondents had reported occupational injuries during the past 12 months giving an overall annual prevalence rate of 847 injuries per 1000 construction workers. From which 471(68.9%) respondents sustained more than one injury. In this study, the main types of injuries reported were cut, 36.2% and abrasions, 26.6%. The three leading causes of
injuries were hurt by sharp instrument (46.1%) followed by fall accidents (37.3%) and injuries caused by falling, splinting or splashing objects (8.9%) (Table 2). Most occupational injuries occurred on fingers of the study participants, 38% followed by arm (hand), and 28.8% (Figure 2). Of the total injured respondents, 74 (10.8%) were hospitalized, from which 31 (41.9%) were hospitalized for more than 24 h. Most of them were absent from work for 7 days or less, 86.7% (Table 3).
Determinants of occupational injuries From the socio-demographic variables, sex of respondents remained statistically significant after controlling for confounders. The odds of having work related injury
Mersha et al.
Number of workers
600
532
500 400 300
200 100
76
46
44
33
33
17
17
0
Figure 1. Job category of selected construction site workers in Addis Ababa, Ethiopia, 2015.
Table 2. Distribution, causes and types of occupational injuries among selected construction site workers in Addis Ababa, Ethiopia, March, 2015 (n=806).
Variable Occupational injuries in the last 12 months Yes No
S/N
Percentage
683 123
84.7 15.3
Number of occurrence Once More than once
806 212 471
100 31.1 68.9
Type of injury Abrasion Cut Puncture Burn Dislocation Fracture Suffocation Electrocutions Chemical poisoning
182 247 133 16 59 27 6 9 4
26.6 36.2 19.5 2.3 8.6 3.5 0.9 1.5 0.9
Cause of injury Fall accident Hurt by sharp instrument Injury caused by chemical/poisoning Falling, Splinting or splashing objects Lifting heavy objects Fire Electric
255 315 14 61 29 3 6
37.3 46.1 2.1 8.9 4.3 0.4 0.9
8
5
6
J. Public Health Epidemiol.
Table 3. Severity of occupational injuries among selected construction site workers in Addis Ababa, Ethiopia, 2015 (n=806).
Variable Hospitalized Yes No
S/N
Percentage
74 609
10.8 89.2
No. of days of hospitalization ≤1 day >1 day
43 31
58.1 41.9
No. of days of absentees from work ≤7 days 7-30 days >30 days
592 79 12
86.7 11.6 1.8
Table 4. Determinants occupational injuries construction workers, Addis Ababa, Ethiopia, March, 2015.
Variables Sex @ (Male, Female )
Crude OR (95% CI)
Adjusted OR
2.17 (1.47-3.19)*
4.16 (1.55-11.12)*
Hours worked/week @ (≤48, >48 )
0.06 (0.03-0.11)*
0.43 (0.19-0.97)*
Supervision @ (Yes, No )
0.06 (0.03-0.10)*
0.35 (0.16-0.76)*
Vocational training @ (Yes, No )
0.05 (0.03-0.10)*
0.15 (0.07-0.31)*
PPE availability @ (Yes, No )
0.036 (0.02-0.07)*
0.13 (0.06-0.31)*
Adjusted for educational status, job category and PPE use. Note: * = significantly associated at p