This paper describes the practices of ninety-nine teachers at the beginning of their involvement in a large-scale project investigating the influence of subject ...
Primary and Secondary Mathematics Practice: How Different is it? Brian Doig
Susie Groves
Deakin University
Deakin University
Russell Tytler
Annette Gough
Deakin University
Deakin University
This paper describes the practices of ninety-nine teachers at the beginning of their involvement in a large-scale project investigating the influence of subject cultures on school and teacher change. Data collected from these teachers, using the IMYMS Components of Effective Teaching and Learning mapping procedure, were analysed to investigate similarities and differences in primary and secondary teachers’ perceptions of their practice in mathematics. Results of the analysis show different patterns across a range of components of effective teaching and learning. A first priority when working with teachers is to help them become aware of and make problematic aspects of their current practice …. Only then would they have reason to attempt to reform their instructional practices when working with us. (Yackel, 1994, p. 386)
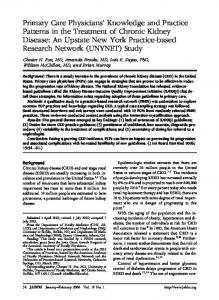
A prior condition for improvement in any subject is agreement on the nature of effective teaching and learning. In science and mathematics education, a major factor that has informed most contemporary change strategies is an emphasis on the role and responsibility of learners in constructing meaning and regulating their learning. This implies a need for teachers to re-examine their assumptions about the nature of learning and teaching (Borko & Putman, 1995; Goldsmith & Schifter, 1997). However, while constructivist learning theories, and socio-cultural theories based on the work of Vygotsky, have underpinned two decades of research into student learning in both mathematics and science, these theories have taken rather different forms in the two subjects (Driver, Asoko, Leach, Mortimer & Scott 1994; Duit & Treagust 1998; Cobb, Wood & Yackel 1990). The Improving Middle Years Mathematics and Science: The role of subject cultures in school and teacher change (IMYMS) project is investigating the role of mathematics and science knowledge and subject cultures in mediating change processes in the middle years of schooling. The project has its roots in the Science in Schools research project (SIS), which developed a successful strategy for improving teaching and learning science based on two major aspects: the SIS Components, a framework for describing effective teaching and learning in science, and the SIS Strategy, a strategic process for planning and implementing change (see, for example, Gough & Tytler, 2001). Based on reviews of the literature on effective teaching (Doig, 2001; 2003) and a series of interviews with fifteen effective teachers of middle years mathematics (Tytler, Waldrip & Griffiths, 2004), the IMYMS project team redeveloped the SiS Components to produce the IMYMS Components of Effective Teaching and Learning (see Figure 1). IMYMS is based on an action planning process that involves auditing the practice of mathematics and science in each school. The major foci of the audit are teacher practice and beliefs, and student perceptions and learning preferences. Each of these processes involves the use of instruments built around the IMYMS Components.
305
The results of the initial student survey and an analysis of the gaps between teachers’ beliefs and their current practices in mathematics are reported elsewhere (see Doig & Groves, submitted; Groves & Doig, submitted). This paper explores the similarities and differences revealed through the component mapping process between primary and secondary teachers’ perceptions of their practice in mathematics at the commencement of the IMYMS project. 1.
The learning environment promotes a culture of value and respect
1.1 The teacher builds positive relationships through knowing and valuing each student. 1.2 The learning environment is characterised by a sense of common purpose and collaborative inquiry 1.3 The learning environment provides a safe place for students to take risks with their learning. 1.4 Persistence and effort are valued and lead to a sense of accomplishment. 2.
Students are encouraged to be independent and self-motivated learners
2.1 Students are encouraged and supported to take responsibility for their learning. 2.2 Students are encouraged to reflect on their learning 3.
Students are challenged to extend their understandings
3.1 Subject matter is conceptually complex and intriguing, but accessible 3.2 Tasks challenge students to explore, question and reflect on key ideas 3.3 The teacher clearly signals high expectations for each student 4.
Students are supported to develop meaningful understandings
4.1 Teaching strategies explore and build on students’ current understandings 4.2 Individual students’ learning needs are monitored and addressed 4.3 Students are supported to make connections between key ideas 4.4 Teaching sequences promote sustained learning that builds over time 4.5 Learning sequences involve an interweaving of the concrete and the abstract/conceptual 5.
Students are encouraged to see themselves as mathematical and scientific thinkers
5.1 Students are explicitly supported to engage with the processes of investigation and problem solving 5.2 Students engage in mathematical/scientific reasoning and argumentation 6.
Mathematics and science content is linked with students’ lives and interests
7.
Assessment is an integral part of teaching and learning
7.1 Learners receive feedback to support further learning 7.2 Assessment practices reflect all aspects of the learning program 7.3 Assessment criteria are made explicit 8.
Learning connects strongly with communities and practice beyond the classroom
8.1 The learning program provides opportunities to connect with local and broader communities 8.2 Learners engage with a rich, contemporary view of mathematics and science knowledge and practice 9.
Learning technologies are used to enhance student learning Figure 1. The IMYMS components of effective teaching and learning.
306
Methodology Ninety-nine teachers (55 primary and 44 secondary) completed the IMYMS Component Mapping process, which audits teacher practice using an interview between individual teachers and their school IMYMS co-ordinator (Tytler, 2001; Tytler, Waldrip & Griffiths, 2004). Each sub-component is discussed, with the teacher and interviewer agreeing on a score out of 5 representing the degree of exemplification of that sub-component in the teacher’s practice. Figure 2 illustrates the Component Mapping instrument for sub-component 5.2. Scores out of 5 are also given for teachers’ perceptions of the importance of each subcomponent. 5.2 Students engage in mathematical/scientific reasoning and argumentation 5. Students regularly 4. 3. Students often 2. 1. Students are engage in Between contribute to Between encouraged to give developing these structured these short, clear explanations and discussions of responses to argument based on activities, targeted questions. evidence. I processes and I tend to focus on encourage and concepts. I clear explanations support students to occasionally of procedures and express their ideas encourage and mathematics and and opinions, to support them to science ideas. question evidence, express opinions, to raise issues and and to question to speculate. evidence. Figure 2. Excerpt from the IMYMS component mapping instrument.
In order to be useful, the ordinal Component Mapping data requires a transformation into an interval scale. This was achieved using Masters’ (1982) Partial Credit Model for rating scales via the Item Response Theory (IRT) software Quest (Adams & Khoo, 1996). As recommended by Wright and Stone (2004) and Bond and Fox (2001), the results of the analysis were subjected to scrutiny with respect to item fit, and re-analyses conducted to accommodate any problems with the data. There are two advantages to this form of analysis. First, the threshold between each pair of response categories is defined so that differences in threshold position on the scale indicate the ease, or difficulty, a respondent would have in endorsing that category. Second, respondents can be placed on the interval scale to indicate their total score, and, importantly, this position indicates their likely response to every survey statement. While the model is probabilistic, the fact that there is a nexus between teacher total score and the difficulty of endorsing a particular response category enables results to be useful to the researcher in a manner not possible when using traditional analyses. In practice this means that categories that lie below a teacher’s position on the scale are easy to endorse, and that categories above are harder to endorse. The category threshold at, or near, the teacher’s position on the scale indicates their most likely category of response to that subcomponent.
307
The analysis provided a variable map (Figure 3) that shows the positions of categories of response relative to one another on the interval scale. The scale values, measured in logits (log odds units) are shown on the extreme left hand side. The scale is centred on zero, with easier to endorse categories towards the bottom of the scale, and harder to endorse categories towards the top. The columns of Xs are a histogram of the teachers at their level of agreement with the components overall. On the right hand side of the figure, separate thresholds are shown for primary and secondary teachers, with the threshold labels prefixed by a “P” or “S” to indicate primary or secondary teacher responses. So, for example, at zero on the scale, P7.1.4 indicates threshold 4 for sub-component 7.1 for primary teachers — that is, zero is the threshold at which a primary teacher is more likely than not to score themselves at level 4 for practice for sub-component 7.1. Primary teachers above this point on the scale have a probability greater than 0.5 of responding at level 4 for this sub-component, while those below this point more likely than not to score themselves below level 4. The fact that the lowest threshold shown is P4.3.3 indicates that all teachers scored their practice at least at 2 on sub-component 4.3. Item Estimates (Thresholds)
3.0 X
X
Primary | | | | | P1.2.5 | | | P5.2.5 | | | P4.2.5 | | P3.2.5 | | P3.1.5 | | P4.5.5 | P8.1.5
N = 99 L = 46 Probability Level=0.50 Secondary S1.3.5 S8.1.4 S8.2.5 S3.1.5 S1.4.5 S1.2.5
S3.2.5
S1.1.5
S5.1.5
S5.2.5 P7.3.5 P8.2.5
S4.2.5 S4.1.5
X | P2.1.5 P2.2.5 P5.1.5 P6.1.5 2.0
X
X XXXX X
1.0
XX X X XXXXX XX X XXXXXX XX XXX XX
| | | | | | | | | | | | | | | | | | | |
P1.3.5
S2.1.5
P7.2.5 S6.1.5 S2.2.5 S5.4.5 S7.1.5
P8.1.4 P4.1.5 P4.4.5 P8.2.4 P3.3.5 P1.4.5
P4.3.5
P3.2.4
P3.1.4 P7.2.4 P1.1.5 P2.1.4
P9.1.4 P7.3.4
| P1.2.4
P2.2.4
P9.1.5
P7.1.5
S4.4.5
S7.2.5
S7.3.5 S3.2.4 S1.2.4 S4.3.5
S8.2.4 S8.1.3 S2.2.4
S5.2.4
P6.1.4
XXXX | XXXX
S9.1.5
P5.1.4
308
S3.3.5
XXXX XXXXXXX
| |
S2.1.4
X | P8.1.3
0.0
XXX XXXXXX X XX XXXX
S3.1.4
S4.5.4
S5.1.4 S9.1.4 S6.1.4
| | P5.2.4 | | P4.5.4 | P7.1.4
S7.2.4
XXX |
S4.1.4 S7.1.4 S8.2.3
X XXXXX XX X XX XX
| | | | | | | | | | | | | | | | | | | | | | | | | | | | | | | | | | | | | | | | | | | | | | | | | | | |
X X -1.0 XX X X X
XX -2.0 X
X -3.0 X
P4.2.4 P8.2.3 P3.3.4
S1.4.4 S7.3.4
S4.2.4
S3.3.4
S8.1.2
S4.3.4 P4.1.4 P1.1.4 P1.4.4 P1.3.4
P9.1.3 P8.1.2 P4.3.4
P4.4.4 P1.2.3 P3.1.3 P7.3.3 P7.2.3
P5.2.3
P2.2.3
P9.1.2
P4.5.3 P2.1.3 P4.1.3 P5.1.3 P4.4.3
P4.2.3 P7.3.2 P1.1.3 P1.3.3
S1.1.4 S1.3.4 S1.2.3 S2.1.3 S4.4.4 S4.5.3
S7.3.3 S5.1.3 S4.2.3 S7.2.3
S2.2.3 S5.2.3
S9.1.3 S5.2.2 S7.3.2
P3.2.3 P7.1.3
S4.1.3 S4.4.3 S2.2.2 S1.3.3 S3.3.3 S4.2.2 S8.2.2
P3.3.3
S3.1.3 S4.5.2 P1.2.2
P3.1.2
P6.1.3
P7.2.2
P1.4.3 S7.1.3 P1.1.2 P4.4.2
P3.3.2 S3.2.3
P4.5.2 P3.2.2 P2.2.2 P5.2.2 P4.3.3
| Each X represents 1 teacher Figure 3. The IMYMS components of effective teaching and learning variable map.
309
The use of an interval scale allows various comparisons to be made. For example, a secondary teacher whose position on the scale is at zero, is most likely to have assessed their teaching practice at level 4 for sub-component 7.3 “Assessment criteria are made explicit”. On the other hand, a primary teacher’s most likely response for this subcomponent is level 3 — that is, the threshold for level 4 is above the teacher’s scale position at 0.87 logits, while the level 3 threshold is well below it at –1.21 logits. Similar information can be read from Figure 3 for other combinations of teachers and responses. Such comparisons can also be made on the basis of distance: notions such as “close” and “same” or “different” have meaning. However, how much distance constitutes similarity or difference is a matter of context. In the present instance, where interpretations are not critical but are more descriptive, we will take a one logit or more difference to be a large difference, between a half and one logit difference to be a small difference, and less than half a logit as a similar scale position.
Results While space does not allow a complete analysis of the data shown in Figure 3, a number of observations can be made, with some differences between primary and secondary teachers’ practices being more pronounced than others. Firstly, for secondary teachers the most difficult sub-component on which to rate their practice highly was 8.1 “The learning program provides opportunities to connect with local and broader communities”, with level 4 being the highest score for secondary teachers on this sub-component. Not only was level 4 the highest score, but even this was the second hardest score to achieve, with no secondary teacher having a probability greater than 0.5 of scoring 4. This contrasts with primary teachers whose threshold for scoring 4 for this subcomponent was more than 1.5 logits below that for secondary teachers, with there even being a small difference between their threshold for a score of 5 and a score of 4 for the secondary teachers. For every other sub-component there were at least some primary and secondary teachers who rated their practice at level 5. Among the other sub-components that secondary teachers found difficult to rate themselves highly on, many also showed a large difference between the thresholds for level 5 for secondary and primary teachers. These included sub-components 1.3 “The learning environment provides a safe place for students to take risks with their learning”, 8.2 “Learners engage with a rich, contemporary view of mathematics and science knowledge and practice”, 1.4 “Persistence and effort are valued and lead to a sense of accomplishment”, and 1.1 “The teacher builds positive relationships through knowing and valuing each student”, which showed the biggest difference, suggesting that this is much more difficult to achieve in secondary practice than in primary practice. It should, however, be noted that for this sub-component primary and secondary teachers were equally likely to rate themselves at least at level 4. There were also small differences in the same direction for sub-components 3.1 “Subject matter is conceptually complex and intriguing, but accessible” and 4.1 “Teaching strategies explore and build on students’ current understandings”. On the other hand, there was only one sub-component for which there was a large difference in scores with primary teachers finding it harder to rate themselves at level 5. This was sub-component 7.3 “Assessment criteria are made explicit”, where there was an equally large difference in the same direction at level 4 also. There were, however, a number of sub-components with a small difference in the same direction, namely sub-
310
components 1.2 “The learning environment is characterised by a sense of common purpose and collaborative inquiry”, 5.2 “Students engage in mathematical/scientific reasoning and argumentation”, 4.2 “Individual students’ learning needs are monitored and addressed”, 4.5 “Learning sequences involve an interweaving of the concrete and the abstract/conceptual”, 7.2 “Assessment practices reflect all aspects of the learning program “, and 4.3 “Students are supported to make connections between key ideas”. The remaining eight sub-components proved equally difficult for primary and secondary teachers to rate themselves at the highest level.
Conclusion In terms of rating their practice at the highest levels with respect to the various subcomponents of the IMYMS Components of Effective Teaching and Learning, a number of patterns emerge from the teachers’ responses. The biggest difference between primary and secondary practice occurred for components 8 “Learning connects strongly with communities and practice beyond the classroom” and 1 “The learning environment promotes a culture of value and respect”, with each of the sub-components of these, with the exception of 1.2, proving much more difficult for secondary teachers to score themselves at the highest level than for primary teachers, with no secondary teacher scoring 5 on sub-component 8.1 “The learning program provides opportunities to connect with local and broader communities”. This subcomponent was seen to be an important aspect of effective practice in the SiS project, but may well be more highly valued in science. This merits further investigation. The component where secondary teachers found it easier to score themselves highly, was component 4 “Students are supported to develop meaningful understandings”. Among the most difficult components for both primary and secondary teachers to score themselves at the highest level were components 3 “Students are challenged to extend their understandings” and 5 “Students are encouraged to see themselves as mathematical and scientific thinkers”. According to Luke et al.(2003), there needs to be a much better understanding of what is going on in school classrooms and more systematic emphasis on intellectual demand, with exemplary practice being found in “classrooms where higherorder thinking about mathematical topics was encouraged … and where mathematical topics were linked to real situations and situations relevant to students” (p. 129). The IMYMS component mapping process drives the action planning for implementing change by identifying gaps between teachers’ views of effective teaching and learning and their actual practice. This has resulted in schools and clusters developing action plans focusing on many of the aspects discussed above. In particular, there has been a focus on higher-order thinking, promoting student reflection, assessment (particularly in relation to assessment criteria and rubrics), and developing community links (particularly in science, but also imn soe instances in mathematics at the secondary level). Acknowledgments. Improving Middle Years Mathematics and Science: The role of subject cultures in school and teacher change (IMYMS) is funded by an Australian Research Council Linkage Grant, with Industry Partner the Victorian Department of Education and Training. The Chief Investigators are Russell Tytler, Susie Groves and Annette Gough.
311
References Adams, R. J., & Khoo, S.T. (1996). Quest: The interactive test analysis system (Version 2). Camberwell: ACER. Bond, T. G., & Fox, C. M. (2001). Applying the Rasch model: Fundamental measurement in the human sciences. Mahwah, NJ: Lawrence Erlbaum Associates. Borko, H., & Putnam, R. (1995). Expanding a teacher’s knowledge base: A cognitive psychological perspective on professional development. In T. Guskey & M. Huberman (Eds.), Professional development in education: New paradigms and practices (pp. 35–65). New York: Teachers College Press. Cobb, P., Wood, T., & Yackel, E. (1990). Classrooms as learning environments for teachers and researchers. In R. B. Davis, C. A. Mayer & N. Noddings (Eds.), Constructivist views on the teaching and learning of mathematics (pp. 125–146). Reston, VA: National Council of Teachers of Mathematics. Doig, B. (2001). Summing up: Australian numeracy performances, practices, programs and possibilities. Melbourne: ACER Press. Doig, B. (2003). Quality learning communities: Effective practices in the Middle Years of Schooling (Report prepared for the Middle Years Pedagogy Research and Development Project). Melbourne: Deakin University Consultancy and Development Unit. Doig, B., & Groves, S. (submitted). Reason for hope: Primary students’ mathematics learning environment. Driver, R., Asoko, H., Leach, J., Mortimer, E., & Scott, P. (1994). Constructing scientific knowledge in the classroom. Educational Researcher, 23(7), 5–12. Duit, R., & Treagust, D. (1998). Learning in science – From behaviourism towards social constructivism and beyond. In B. Fraser & K. Tobin (Eds.), International handbook of science education. Dodrecht: Kluwer. Goldsmith, L., & Schifter, D. (1997). Understanding teachers in transition: Characteristics of a model for developing teachers. In E. Fennema & B. Nelson (Eds.), Mathematics teachers in transition (pp. 19–54). Mahwah, NJ: Lawrence Erlbaum Associates. Gough, A., & Tytler, R. (2001). Researching effective teaching and learning in science: Victoria's Science in Schools research project. In Proceedings of the 2001 annual conference of the Australian Association for Research in Education, Fremantle. Retrieved 30 March 2005 from the World Wide Web: http://www.aare.edu.au/01pap/gou01515.htm Groves, S., & Doig, B. (submitted). Effective mathematics learning environments: Primary teachers’ beliefs and practices. Luke, A., Elkins, J., Weir, K., Land, R., Carrington, V., Dole, S., Pendergast, D., Kapitzke, C., van Kraayenoord, C., Moni, K., McIntosh, A., Mayer, D., Bahr, M., Hunter, L., Chadbourne, R., Bean, T., Alverman, D., & Stevens, L. (2003). Beyond the middle: A report about literacy and numeracy development of target group students in the Middle Years of Schooling. Canberra: Department of Education, Science and Training. Masters, G. N. (1982). A Rasch model for partial credit scoring. Psychometrika, 47, 149–174. Tytler, R. (2001). Describing and supporting effective science teaching and learning in Australian schools: Validation issues. Asia-Pacific Forum on Science Learning and Teaching. Retrieved 30 March 2005 from the World Wide Web: http://www.ied.edu.hk/apfslt/v2_issue2/tytler/index.htm Tytler, R., Waldrip, B., & Griffiths, M. (2004). Windows into practice: Constructing effective science teaching and learning in a school change initiative. International Journal of Science Education, 26(2), 171–194. Wright, B. D., & Stone, M. H. (2004). Making measures. Chicago: Phaneron Press. Yackel, E. (1994). School cultures and mathematics education reform. In J. P. da Ponte & J. F. Matos (Eds.). Proceedings of the Eighteenth International Conference for the Psychology of Mathematics Education. (Vol. IV, pp. 385–392). Lisbon, Portugal: University of Lisbon.
312