NeuroImage: Clinical 2 (2013) 221–228
Contents lists available at ScienceDirect
NeuroImage: Clinical journal homepage: www.elsevier.com/locate/ynicl
Primary motor cortex activation and lateralization in patients with tumors of the central region☆ Magdalini Tozakidou a,⁎, Holger Wenz b, Julia Reinhardt a, b, Ernst Nennig b, Katharina Riffel b, Maria Blatow a, b, Christoph Stippich a, b a b
Division of Diagnostic and Interventional Neuroradiology, Department of Radiology and Nuclear Medicine, University Hospital of Basel, Basel, Switzerland Division of Neuroradiology, Department of Neurology, University of Heidelberg, Heidelberg, Germany
a r t i c l e
i n f o
Article history: Received 7 November 2012 Received in revised form 23 December 2012 Accepted 8 January 2013 Available online 14 January 2013 Keywords: Functional MRI M1 Plasticity Functional reorganization Ipsilateral coactivation
a b s t r a c t Hemispheric lateralization is a frequently encountered phenomenon of cortical function. It describes the functional specialization of a region on one side of the brain for a given task. It is well characterized in motor and sensory, as well as language systems and becomes more and more known for various cognitive domains. While in the adult healthy brain hemispheric lateralization is mostly set, pathological processes may lead to cortical reorganization. In these cases neuroplasticity of the corresponding region in the non-dominant hemisphere seems to play an important role. In a previous study we investigated language associated regions in right-handed patients with frontal and temporal tumors of the left hemisphere. We observed a marked change of language lateralization in these patients towards the non-dominant hemisphere as measured by functional MRI (Partovi et al., 2012). In the present study we evaluated activation and lateralization of cortical motor areas in patients with tumors of the central region. BOLD fMRI was performed during unilateral voluntary movements of the contralesional hand in 87 patients. Individual correlations of measured BOLD-signals with the model hemodynamic reference function were determined on a ROI basis in single subjects and compared to those of 16 healthy volunteers. In volunteers the strongest activation is usually found in the M1 hand representation contralateral to the movement, while a weaker homotopic co-activation is observed in ipsilateral M1 (Stippich et al., 2007a). In the patient group our results show significant changes of motor activations, ranging from a reduction of M1 lateralization to equalization of M1 activations or even inversion of M1 lateralization during contralesional movements. This study corroborates in a large patient group the idea that lesions affecting M1 may lead to functional reorganization of cortical motor systems and in particular equalize hemispheric lateralization. However, it is not yet clear whether these changes are only an epiphenomenon or indeed reflect an attempt of recovery of brain function. © 2013 The Authors. Published by Elsevier Inc. All rights reserved.
1. Introduction The primary motor cortex (M1) plays an important role in the control and execution of voluntary movements. Increasing evidence attributes this function to its connection to a wide range of cortical motor control areas including the premotor area (PMA), the supplementary motor area (SMA) as well as the parietal cortices that are involved in different aspects of a motor task e.g. motor execution, planning and coordination (Lotze et al., 1999).
☆ This is an open-access article distributed under the terms of the Creative Commons Attribution-NonCommercial-ShareAlike License, which permits non-commercial use, distribution, and reproduction in any medium, provided the original author and source are credited. ⁎ Corresponding author. Tel.: +41 613286359. E-mail address:
[email protected] (M. Tozakidou).
Within this network strongest activation during unilateral handmovements is usually found in the M1 motor hand representation contralateral to the executed movement (M1c) as demonstrated in various studies using blood oxygen level dependent (BOLD) functional MRI (fMRI) (Kleinschmidt and Toni, 2005). However, even though M1 activation is strongly lateralized to M1c also M1 coactivation ipsilateral to the executed movement (M1i-CoA) is present in healthy volunteers (Stippich et al., 2007a), and is especially thought to be present in patients with lesions in the primary motor cortex of the contralateral hemisphere (Stoeckel and Binkofski, 2010). Evidence of enhanced ipsilateral activation under pathological conditions arouse from studies in patients with congenital hemiparesis due to intrauterine lesions of the periventricular white matter (Cao et al., 1994; Staudt et al., 2002). Especially those patients with large lesions showed abnormal activation of the hand motor representation in the ipsilateral primary motor cortex as revealed by TMS and fMRI (Staudt et al., 2002). Not only during early injury but also during injury
2213-1582/$ – see front matter © 2013 The Authors. Published by Elsevier Inc. All rights reserved. http://dx.doi.org/10.1016/j.nicl.2013.01.002
222
M. Tozakidou et al. / NeuroImage: Clinical 2 (2013) 221–228
in adulthood plasticity of M1 activation has been demonstrated. For example in patients suffering from motor deficits due to ischemic stroke TMS and fMRI revealed changes in M1 lateralization with presence of prominent ipsilateral M1i-CoA (Stoeckel and Binkofski, 2010). A study conducted by Cramer et al. could show that activation volume was increased in the unaffected hemisphere in stroke patients (Cramer et al., 1997). Similarly Lotze et al. demonstrated that TMS stimulation over contralesional M1 resulted in interference with recovered performance in stroke patients (Lotze et al., 2006). In patients with brain tumors so far only little is known about ipsilateral M1 activation. A study in a heterogeneous patient group with different types of neoplasms and malformations could show that ispilateral M1 activation is more pronounced in patients with cortical malformations than in patients with neoplasms (Carpentier et al., 2001). In addition Alkadhi et al. examined 9 patients with arteriovenous malformations (AVMs) and could show enhanced activity in ipsilateral M1 in 3 patients. In a larger study on patients with neoplasms only Krings et al. could show significant decreases of activation in contralateral M1, but did not assess ipsilateral M1 Co-activation and thus did not address the role of M1 lateralization (Krings et al., 2002). Hemispheric lateralization of cortical function has not only been described for the motor system, but has been shown in various systems. In a previous study we investigated language associated regions in right-handed patients with frontal and temporal tumors of the left hemisphere (Partovi et al., 2012; Stippich et al., 2007b) and observed a marked change of language lateralization in these patients towards the non-dominant hemisphere as measured by fMRI. In the present study we evaluated ipsilateral activation of motor control areas in 87 patients with tumors affecting the central region compared to healthy controls.
2. Materials and methods 2.1. Study population Over a period of 6 years 301 patients with brain tumors were investigated presurgically in a prospective study design using BOLDfunctional MRI (fMRI) of motor and/or language function. Of those the 87 consecutive patients with tumors affecting the central region only – according to established anatomical landmarks – were included in this study. Except for one patient with multiple manifestations of a glioblastoma all patients suffered from single lesions. Tumor types were confirmed histologically as summarized in Table 1. The
Table 1 Types of tumors affecting the central region.
Grade IV/
metastasis
Tumor type Glioblastoma Gliosarcoma Metastasis
Grade I-III tumors
Oligodendroglioma Astrozytoma
No. of patients 18 1 20 9 21
Oligoastrozytoma
8
Ganglioglioma
1
Meningeoma
6
Dysembryoplastic neuroepithelial tumor (DNET)
1
Chondrosarcoma
2
Total
87
study protocol was approved by the local ethics committee of the University of Heidelberg, Medical School and is in line with the Declaration of Human Rights, Helsinki, 2002. The patients' results were compared to the normative data obtained from 16 healthy right handed volunteers (Blatow et al., 2011).
2.2. Functional and morphological MRI After intensive individual training of the movement tasks performed under instruction and direct supervision of the investigator, each patient was positioned in a clinical 1.5-Tesla (T) imager (Symphony Siemens AG, Erlangen, Germany or Edge, Picker/Marconi, Cleveland, OH, USA) or 3.0-T imager (Magnetom TRIO, Siemens AG, Erlangen, Germany). The healthy controls were measured on the 3.0-T MR-imager (Blatow et al., 2011). For all anatomical and functional MR measurements standard birdcage head-coils were used. Movement artifacts were reduced by relaxed positioning of the extremities, by fixing the head with preformed foam cushions and by instructing each patient to gaze at a fixation point. During the fMRI measurements, all patients performed complex finger opposition involving digits 1–5 of the contralesional hand as a standard. Patients unable to perform the complex finger opposition due to contralesional motor deficits performed repeated opening and closing of the hand. All patients were asked to perform the most demanding hand motor task possible in order to achieve maximum BOLD-activation. Tasks were performed upon command of the investigator. Task performance was monitored directly by inspection during execution. Incorrectly performed measurements were excluded from the evaluation and repeated immediately. A standardized block-designed whole brain BOLD-fMRI was carried out in each patient or volunteer using a singleshot blipped gradient echo-planar imaging sequence (GE-EPI: 1.5-T Edge:, TR=3000 ms, TE=80 ms, FOV =256× 256 mm2, Matrix= 128 ×128 voxels, flip angle= 90°, 22 axial slices, slice thickness 5 mm, gap 1 mm; 1.5-T Symphony:, TR= 2860 ms, TE =65 ms, FOV= 256 × 256 mm2, Matrix =64 ×64 voxels, flip angle= 90°, 22 axial slices, slice thickness 5 mm, gap 1 mm; 3.0-T TRIO:, TR =2500 ms, TE=30 ms, FOV= 256 ×256 mm2, Matrix= 64× 64 voxels, flip angle =90°, 36 axial slices, slice thickness 3 mm, gap 1 mm). Individual T1-weighted structural 3D MRI data sets were acquired to superimpose functional on structural images, in patients the following sequences were used: Edge: RF-spoiled FLASH sequence, TR= 30 ms, TE= 4.4 ms, flip angle = 15° FOV= 256× 256 mm2, Matrix = 256 × 256 voxels, 68 sagittal slice thickness 2.5 mm or 135 transversal slices, slice thickness 1.3 mm. Symphony: 3D turbo FLASH sequence, TR = 2180 ms, TE= 3.49 ms, flip angle = 15°, FOV= 256 × 256 mm2, Matrix = 300× 300 voxels, 88 sagittal slices, slice thickness 2.0 mm or FOV= 256 × 256 mm2, Matrix = 512 × 512 voxels, 144 or 128 transversal slices, slice thickness 1.3 mm; TRIO: Magnetization-Prepared Rapid-Acquisition-Gradient-Echo sequence (MPRAGE) sequence, TR= 1680 ms, TE= 4.38 ms, flip angle = 15°, FOV = 256 × 256 mm2, Matrix = 512× 512 voxels, 128 sagittal slices, slice thickness 1.3 mm or MPRAGE sequence, TR = 1570 ms, TE= 3.05 ms, flip angle = 9°, FOV= 256 × 256 mm2, Matrix= 256× 256 voxels, 144 transversal slices, slice thickness 1.3 mm. The axial T1 weighted 3D-data sets were acquired in all patients undergoing functional neuronavigation after administration of i.v. gadolinium. All patients with non-enhancing lesions who were not scheduled for functional neuronavigation received sagittal T1 weighted 3D-data sets as a standard to safe imaging time and by this also reducing movement artifacts. Volunteers were measured using MPRAGE, TR=1680 ms, TE=4.38 ms, flip angle=15°, FOV=256× 256 mm2, matrix=512×512 voxels, 128 sagittal slices, slice thickness 1.3 mm. Tumor volume was measured on T1 weighted 3D-data sets using the following formula: volume = 0.52 ∗ x ∗ y ∗ z according to Pasqualin et al. (1991).
M. Tozakidou et al. / NeuroImage: Clinical 2 (2013) 221–228
2.3. Standardized analysis of individual fMRI data BrainVoyager® (BrainInnovations, Maastricht, The Netherlands) was used for standardized processing and evaluation of both structural and functional MRI data on an individual basis in all patients and all volunteers. Data processing including motion correction, temporal and spatial smoothing, and a voxel-wise calculation of BOLD activation using the general linear model (GLM) was fully standardized and semi-automated. Functional images were overlaid on structural images manually and in each patient, the structural and all functional data sets were transformed to Talairach space (Talairach, 1988). The method has been described elsewhere (Blatow et al., 2011; Stippich et al., 2000, 2007a, 2007b). Ten different regions of interest (ROIs) were defined, namely the primary sensorimotor cortex (M1c, M1i), the premotor cortex (PMAc, PMAi), the supplementary motor cortex (SMAc, SMAi), the superior parietal lobulus (SPLc, SPLi) and the inferior parietal lobulus (IPLc, IPLi) in both hemispheres. The suffix “c” refers to contralateral to the executed movements and the suffix “i” to ipsilateral to the executed movements. The precentral gyrus was identified according to morphological landmarks as established by Yousry et al. (1997) and Naidich et al. (2001). The “hand knob” was used on transverse sections to identify the primary motor hand representation (M1), which was then verified on sagittal images using the “hook sign”. SMA was defined as the cortical area on the medial surface of either the superior frontal gyrus or the cingulated gyrus posterior to the anterior commissure. PMA was localized in continuation of the SMA on the lateral surface of the convexity rostral to the precentral sulcus and caudal to the superior frontal sulcus (Gordon et al., 1998). SPL was identified in the parietal lobe posterior to the postcentral sulcus and superior to the parietooccipital sulcus (Krings et al., 2000), whereas IPL was defined in the parietal lobe inferior to the parietooccipital sulcus. In each ROI, the exact anatomical correlates of the centers of gravity of each BOLD activation were assessed on transverse, sagittal, and coronal sections (3D-view). An independent second reading was performed by an experienced neuroradiologist (CS) to confirm all anatomo-functional correlations. Correlation (r) of the measured BOLD signal to the applied hemodynamic response function (hrf) and the relative BOLD-signal change (ΔS%) was measured for each BOLD cluster. To precisely analyze each individual functional data set, a standardized evaluation routine was employed in which a dynamic statistical threshold was applied (Stippich et al., 2000, 2002, 2004, 2005, 2007a). The empirically proven cluster size of 36 mm3 was taken as the standard for data evaluation so as to most precisely determine the anatomical correlates of the different functional activations by also eliminating very small clusters in the activation maps. At first, a very high statistical threshold value for the correlation (r) between the measured BOLD signal and the hrf was selected so that no functional activation was displayed (empty map). This threshold was then continually reduced. As a result, the activation with the highest correlation to the hrf that exceeded the cluster size of 36 mm3 was displayed first (Suppl. Fig. 1). By further reducing the threshold, activation in other functional areas with a lower correlation between the measured BOLD signal and the hrf was displayed in a hierarchical order. This procedure was continued until the activation was identified in all ROIs. A minimal threshold of r = 0.4 with a false discovery rate (FDR) of 0.05 was established as the lower limit. BOLD-responses with relative signal changes > 5% were excluded from evaluation and considered as artifacts most likely reflecting venous contribution.
2.4. Statistical analysis Results are presented as means ± SD or individual data points to show the distribution of the r-values for cases and controls. To detect possible significant differences in the distribution of coordinates Wilcoxon-U-tests were calculated. P ≤ 0.05 was considered to
223
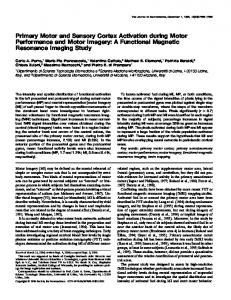
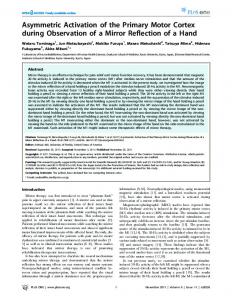
indicate statistical significance. Analyses were performed using GraphPad Prism 5.0 (GraphPad, La Jolla, USA). 3. Results 3.1. M1 activation in patients with central brain tumors In patients BOLD fMRI was performed during unilateral movements of the contralesional hand (Fig. 1D, right panel). Statistical comparison of activations between patients and controls (Fig. 1D) showed on average a similar pattern in both groups with the highest r-value being found in M1c but a higher variability of r-values of activations in all evaluated regions of interest (ROI) in patients. However, mean r-value of M1c activation of the entire patient group was lower than in controls (Fig. 1D). Comparison of r-values in patients measured at 1.5 T and at 3 T showed no significant difference (Suppl. Table 1). 3.2. Cortical motor network activation in patients and volunteers The motor network including the primary motor cortex (M1), preand supplementary motor areas in the frontal lobe (PMA/SMA) and the superior and inferior parietal lobule of both hemispheres is shown schematically in Fig. 1A. Example fMRI activation pattern during movement of the right fingers is presented in Fig. 1B. Statistical comparison of r-values in volunteers showed that during unilateral movements in volunteers highest r-value is found in M1 contralateral to the executed movement (M1c) (Fig. 1C). Ipsilateral co-activation in M1 (M1i-CoA) is also present with a significantly lower r-value (Fig. 1C). Similarly, r-values of activations in pre- or supplementary motor areas (PMA/SMA) or the superior and inferior parietal lobe (SPL/IPL) on the ipsilateral side (Fig. 1C) were significantly lower than r-values of M1c activations, but showed no significant difference compared to r-values of activations in M1i. Since motor network activation in right handed volunteers was similar for movements of the right and left fingers (Fig. 1C) data of both sides were pooled (Fig. 1D, left panel). Occurrence probability of activations was 100% in M1c in both groups (Fig. 1E). Interestingly in volunteers activation in M1i was present in 69% of volunteers and was increased in patients to 91%. In volunteers occurrence probabilities of SMA/PMA and SPL/IPL were 100% and 88% respectively; in patients occurrence probability of SMA/PMA and SPL/IPL was 99% (Fig. 1E). 3.3. Different types of M1 lateralization in brain tumor patients For a more detailed analysis of primary motor cortex activation and in particular interhemispheric lateralization between contralateral and ipsilateral M1 activation we normalized r-values of activations in M1i to r-values of activations in M1c in each individual patient and volunteer. The mean calculated relative r-values (rrel-values) showed no significant difference between volunteers and patients (Fig. 2A, Table 2). However, rrel-values of activations in volunteers ranged from 0.80 to 0.98, whereas rrel-values of activations in patients were widely scattered from 0.67 to 1.14, indicating a higher interindividual variability in the patient group ranging from normal values to inversion of M1 lateralization during contralesional movements. In order to further examine this variability of M1 lateralization patients were divided in three groups according to the deviation from the normal activation pattern of M1 lateralization. The first group included patients with activation in M1c but no activation in M1i and patients with rrel-values comparable to those of M1i-CoA in volunteers (M1c >> M1i; n = 56). The upper inclusion limit for the first group was the 75% percentile of rrel-values of activations in volunteers (rrel = 0.94). The second group (M1c > M1i; n = 16) included
224
M. Tozakidou et al. / NeuroImage: Clinical 2 (2013) 221–228
M. Tozakidou et al. / NeuroImage: Clinical 2 (2013) 221–228
225
patients with a small upward deviation of rrel-values (rrel-values of M1i-CoA> 0.94, butb 1). Finally, the third group showed marked abnormal M1 activations with an inversion of M1 lateralization (M1c ≤M1i; rrel ≥ 1; n = 15) including those in which contralateral M1 activation had disappeared. Individual and group data of rrel-values of M1i-CoA are shown in Fig. 2B and Table 2. Fig. 3A shows schematically 3 types of M1 activation patterns. Representative fMRI of activation patterns are shown in Fig. 3B. 3.4. Influence of tumor characteristics on M1 activation patterns In order to better explain the underlying mechanisms of M1 lateralization we examined different potentially influencing factors in the three groups of M1 lateralization. However, only trends could be identified. Despite the large patient population, subgroups were too small for proper statistical analysis. Analysis of distribution of tumor type within the three groups of M1 lateralization showed the trend that the more M1 lateralization was affected the larger the percentage of patients with malignant tumors and the lower the percentage of patients with grade I-III tumors (Fig. 4A, Table 3). In order to examine the influence of lesion localization we analyzed the number of tumors affecting the precentral gyrus, the postcentral gyrus and/or the superior or inferior parietal lobe (Fig. 4B). The precentral gyrus was affected in 73 patients, the postcentral gyrus in 63 patients and in 39 patients the superior or inferior parietal lobe was involved. In total within the three groups the pre- and postcentral gyrus was similarly affected in all degrees of M1 lateralization (Fig. 4B). However, involvement of the parietal lobe was found in 60% of the patients in the group with inversion of M1 lateralization, whereas only approximately 40% of the group 1 patients showed parietal affection. Clinical data concerning motor deficits were available in 73 patients. Within those patients more patients without deficits were found in the group 1 patients presenting with “normal” M1 lateralization, whereas relatively more patients with motor deficits could be identified when M1 lateralization was affected (Fig. 4C). Regression analysis showed neither correlation between tumor volume and relative r-values (Spearman r = 0.105; p = 0.361) nor correlation between the patients age and relative r-values (Spearman r = − 0.033; p = 0.774). 4. Discussion In the present study we used BOLD-fMRI to assess the functional organization of the motor cortical network in patients with rolandic brain tumors. When focussing on the primary motor cortex activation, the occurrence probability of ipsilateral M1-co-activation was higher than in healthy controls, indicating tumor induced functional reorganization in M1 towards the unaffected side. The observed changes in M1 activation ranged from slight reduction to complete abolishment or even inversion of M1 lateralization during contralesional movements. Patients with inversion of M1 lateralization showed the trend to more likely suffer from grade IV tumors/metastasis and more frequently displayed affection of the parietal lobe. Only in about 50% of our tumor patients the activation pattern in M1 remained physiological with a predominant M1 activation of the hemisphere contralateral to the performed movement. 4.1. M1 lateralization in patients with brain tumors Changes in M1 lateralization under pathological circumstances have been described previously, for example in patients with
Fig. 2. M1 lateralization in volunteers and patients based on the analysis of r-values. (A) r-Values of activation in ipsilateral M1 are presented as fraction of r-value in contralateral M1 (rrel-values); volunteers pooled data of right and left hand (n = 22, out of 32 measurements), patient movement of the contralesional hand (n = 79, in 87 patients). (B) Three degrees of M1 lateralization could be identified. The 75% percentile of healthy volunteers (rrel = 0.94) and the inversion of lateralization (rrel = 1) were used as criteria for group separation.
arteriovenous malformations (AVMs) (Alkadhi et al., 2000), cerebral hemorrhage or ischemic stroke (Stoeckel and Binkofski, 2010). Similar to our results a study on 11 patients with AVMs showed changes in primary motor cortex activations with prominent ispilateral M1-co-activation in 5 cases, out of which 3 cases showed no activation in M1c (Alkadhi et al., 2000). However, it is still a matter of debate whether increased ipsilateral M1 CoA is functionally relevant or rather represents a maladaptive process (Boroojerdi et al., 1996; Stoeckel and Binkofski, 2010). Evidence of functional relevance of ipsilateral activation arouse from TMS and fMRI studies in young patients with congenital hemipareses in which patients with large unilateral cerebral lesions of various etiology (Staudt et al., 2002) as well as in patients suffering from motor deficits due to ischemic stroke (Stoeckel and Binkofski, 2010) displayed increased hand motor activation in the ipsilateral primary motor cortex of the non lesioned hemisphere. It was hypothesized that this was due to enhanced connectivity of motor areas in the contralesional hemisphere (Gerloff et al., 2006) and altered transcortical interactions (Nair et al., 2007; Stoeckel and Binkofski,
Fig. 1. Analysis of activation of the motor cortical network in healthy volunteers and patients with tumors of the central region using BOLD fMRI. (A) Schematic drawing of activations in M1, PMA, SMA, IPL and SPL and (B) example of normal motor network activation in a healthy volunteer during movement of the right hand. Volunteers: (C) Comparison of right and left hand activation showed no difference. Mean r-values of activations in M1 contralateral to the performed movement or in ipsilateral M1i, SMAi/PMAi or SPLi/IPLi during movement of the left (n = 16) or right (n = 16) hand. Comparisons of volunteers and patients: (D) Pooled mean r-values in volunteers (n = 32, left panel) compared to patients (n = 87, right panel). (E) Occurrence probabilities of the different cortical activations in volunteers (n = 32, left panel) and patients (n = 87, right panel).
226
M. Tozakidou et al. / NeuroImage: Clinical 2 (2013) 221–228
Table 2 Relative r-values of M1 activations in volunteers and patients. Volunteers
a
No. of individuals No. of rrel-valuesb Mean Std. deviation Minimum 25% Percentile Median 75% Percentile Maximum
16 22 0.90 0.06 0.80 0.84 0.91 0.94 0.98
Patients Total
M1c >>M1i
M1c > M1i
M1c ≤ M1i
87 79 0.91 0.10 0.67 0.85 0.92 0.98 1.15
56 48 0.85 0.07 0.67 0.81 0.87 0.91 0.946
16 16 0.97 0.01 0.95 0.95 0.97 0.98 0.99
15 15 1.04 0.05 1.00 1.00 1.01 1.09 1.14
a In volunteers measurements were performed for left and right hand (32 measurements). b Note that rrel values were only calculated in volunteers/patients with activations in ipsi- and contralateral M1.
2010). However, while some studies reported enhanced contralesional M1 activation especially in well recovered patients (Nair et al., 2007), another study conducted by Takeuchi et al. could show that in paretic stroke patients inhibited contralesional M1 (TMS) generally improved performance (Takeuchi et al., 2005), indicating that contralesional M1 activation in those patients is maladaptive and rather hinders motor performance.
However, plastic changes after stroke are driven by sudden onset irreversible damage, whereas in patients with brain tumors changes are continuously induced by the neoplasm now allowing or even asking for continuous adaptational processes and may thus differ in clinical outcome as well as in cortical activations. So far only few studies on brain tumor patients examined clinical deficits and functional cerebral changes. For example, in a recent study Otten et al. used resting state fMRI in 22 patients with cerebral neoplasms and could show decreased motor network connectivity in patients with motor weakness, particularly interhemispheric connections in M1 were affected (Otten et al., 2012). Furthermore, Shinoura et al. reported a coincidence of diffusion tensor imaging (DTI) findings, motor reorganization and clinical deficits in a case series of brain tumor patients (Shinoura et al., 2006). Therefore, the characterization of structural changes in white matter connections underlying motor plasticity DTI combined with different fMRI techniques may further improve the insights in functional reorganization in patients with brain tumors. 4.2. Influence of tumor characteristics on activation patterns In the patient group with inversion of M1 lateralization more likely grade IV lesions or metastasis was found, indicating that fast growing, invasive lesions more likely induce plastic changes. In contrast the
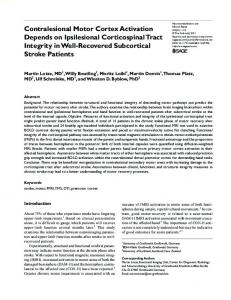
Fig. 3. Examples of fMR images demonstrating different types of M1 lateralization in patients. (A) Schematic drawings and (B) example fMRI of different degrees of M1 lateralization: Type 1 (left column) “Normal M1 lateralization” represented by Case 11 showing robust M1 activation contralateral to the performed movement. Type 2 (middle column): Moderately changed M1 lateralization represented by Case 64. r-Value of M1 activation is still higher in M1c but pronounced ipsilateral M1i activation is present. Type 3 (right column): Inversion of M1 lateralization represented by Case 85. r-Value in M1i is higher than in M1c.
M. Tozakidou et al. / NeuroImage: Clinical 2 (2013) 221–228
Fig. 4. Lesion type, lesion localization and motor deficits. (A) Lesion type: Distribution of lesion type within different groups of M1 lateralization. Strongest effect on M1 lateralization is found in high grade tumors and metastasis (B) Lesion localization: Percentage of patients in which the pre/postcentral or the parietal lobe was affected. Effect on M1 lateralization increases with parietal lobe involvement. Note that in various patients more than one gyrus could be affected. (C) Motor deficit: Percentage of patients without (black) or with (white) motor deficits in each group of M1 lateralization. Atypical M1 lateralization is more pronounced in patients with motor deficits.
results of the above mentioned study on patients with AVMs which are regarded as non-invasive/slow growing lesions point to prominent reorganization in contralesional M1 in those patients (Alkadhi et al., 2000). Hence, one could expect that slow growing lesions in our study such as low grade gliomas would induce more prominent ipsilateral M1 activation. Those differences might be explained by the fact that AVMs represent vascular lesions acquired in infancy or perinatally whereas the brain neoplasms in our patient group are still mainly Table 3 Characteristics of patient groups of M1 lateralization. No of patients
Grade I–III tumors Grade IV tumors/metastasis Precentral gyrus affected Postcentral gyrus affected IPL/SPL affected No motor deficits Motor deficits Age ± std Tumor volume (cm3)
227
acquired in adulthood. Considerable experimental evidence suggests that recovery of function after CNS damage depends on the maturity of the brain at the moment the damage occurred (Carr, 1996; Passingham et al., 1983), implying that the brain possesses a greater ability to compensate functional loss in its immature than in its mature state (Alkadhi et al., 2000). So far in patients with brain neoplasms plastic changes in M1 have mainly been examined using BOLD fMRI during a bimanual motor task (Liu et al., 2005; Schreiber et al., 2000) or a motor task with alternating movements of left and right hand (Carpentier et al., 2001), without addressing the role of ipsilateral M1 Co activation and are thus difficult to compare to our findings. As far as comparable our results concerning less plastic changes in patients with grade I-III gliomas are in line with a study by Carpentier et al. (2001) that showed only minimal plasticity (16 patients with grade I-III gliomas, one patient with a glioblastoma). A study conducted by Schreiber et al. (2000) showed that the BOLD signal is reduced near gliomas but is not affected by nonglial tumors. This finding was partially explained previously by direct effects of tumor mass on hemodynamics, as analyzed with infrared imaging during cranial surgery (Gorbach et al., 2004). Thus, lesion induced neurovascular uncoupling causing reduced fMRI signal in perilesional eloquent cortex, in conjunction with normal or increased activity in the homologous brain region, may simulate hemispheric dominance of the other hemisphere and lesion induced cortical reorganization (Ulmer et al., 2004). In this context Hou et al. examined BOLD fMRI signals in correlation to cerebral blood flow during a bilateral finger task in patients with intra- and extraaxial lesions and found a correlation between activation volume and regional cerebral blood volume in grade IV tumors (Hou et al., 2006). This result could partially explain our finding concerning more pronounced changes in patients with grade IV tumors. In patients with inversion of M1 lateralization the posterior parietal cortex was more likely affected. The posterior parietal cortex is essential for planning of movements. It is important for the integration of visual, acoustic and sensory information and thus plays a role in space perception and guiding actions (Culham and Valyear, 2006). Furthermore, it is connected to premotor cortical areas (Gharbawie et al., 2011; Wise et al., 1997). Our results imply that tumor induced interruption of the parieto-frontal connections is involved in remodeling within M1. In our patients tumor volume did not correlate with the degree of M1 lateralization. This finding differs from results of Staudt et al. (2002), who could show that large lesion more likely induce plastic changes. However, these authors examined a homogeneous group of patients with well defined brain defects resulting from intrauterine periventricular white matter lesions, whereas in many of our tumor patients the precise determination of tumor volumes was difficult, since tumor borders were often ill defined (as in gliomas or other invasive malignancies). The tumor extent visible on MR depends on the MR-sequences applied (T2, T2-FLAIR, T1 with/without i.v. contrast, etc.). MR is not capable to visualize tumor cells and therefore to determine the correct extent of tumor invading brain parenchyma including white matter tracts, which is driving motor reorganization.
4.3. Limitations of the study
Total
M1c >> M1i
M1c > M1i
M1c b M1i
87 48 39 74 62 39 28 43 41.7 ± 14.7 41.2 ± 36.6
56 32 24 47 38 22 19 25 46.3 ± 15.4 37.7 ± 31.0
16 11 5 12 11 8 7 8 49.2 ± 14.5 52.9 ± 36.8
15 5 10 13 13 9 2 10 49.2 ± 13.1 45.5 ± 47.0
Although we included a total of 87 patients in this study, which is a large group compared to other studies on the topic so far, the observed plasticity effects were difficult to quantify statistically. We observed not only changes in M1 lateralization but also increased occurrence probability of ipsilateral M1 activation, which cannot be attributed to direct lesion induced hemodynamic effects. Even though cortical plasticity appears to be influenced by lesion type and lesion location, there is no consistent pattern in our patient group. Also, it is not yet clear whether these changes are only an epiphenomenon
228
M. Tozakidou et al. / NeuroImage: Clinical 2 (2013) 221–228
of the pathology or indeed reflect an attempt of recovery of brain function. Thus, multicenter studies on even larger patient groups are needed to substantiate these findings and to better understand the interaction between tumor and brain plasticity as well as the direct effects of tumor hemodynamics on the measured BOLD signal. Supplementary data to this article can be found online at http:// dx.doi.org/10.1016/j.nicl.2013.01.002. Acknowledgements The authors acknowledge financial support from Bracco S.A., Switzerland. The study sponsor played no role in matters of design, collection, analysis, interpretation of data, and writing the report. JR was supported by BrainLAB AG, Germany. CS and JR were supported by the International Foundation for Research in Paraplegia (IFP), Switzerland, unrelated to this study. MB was supported by the Olympia-MorataProgram of the University of Heidelberg Medical Faculty. Professors V. Tronnier (Neurosurgery, University Hospitals of Schleswig-Holstein, Campus Luebeck) and R. Wirtz (Neurosurgery, University Hospital of Ulm at Guenzburg) were our responsible clinical partners during the study period at the Department of Neurosurgery, University of Heidelberg, Medical School providing access to the clinical data and performing a major part of the brain tumor operations. References Alkadhi, H., Kollias, S.S., Crelier, G.R., Golay, X., Hepp-Reymond, M.C., Valavanis, A., 2000. Plasticity of the Human Motor Cortex in Patients with Arteriovenous Malformations: a Functional MR Imaging Study. AJNR. American Journal of Neuroradiology 21 (8), 1423–1433. Blatow, M., et al., 2011. Clinical functional MRI of sensorimotor cortex using passive motor and sensory stimulation at 3 tesla. Journal of Magnetic Resonance Imaging 34 (2), 429–437. Boroojerdi, B., Diefenbach, K., Ferbert, A., 1996. Transcallosal inhibition in cortical and subcortical cerebral vascular lesions. Journal of Neurological Sciences 144 (1–2), 160–170. Cao, Y., et al., 1994. Functional magnetic resonance studies of the reorganization of the human hand sensorimotor area after unilateral brain injury in the perinatal period. Proceedings of the National Academy of Sciences 91 (20), 9612–9616. Carpentier, A.C., et al., 2001. Patterns of functional magnetic resonance imaging activation in association with structural lesions in the rolandic region: a classification system. Journal of Neurosurgery 94, 946–954. Carr, L.J., 1996. Development and reorganization of descending motor pathways in children with hemiplegic cerebral palsy. Acta Paediatrica 416, 53–57 ((Oslo, Norway: 1992). Supplement). Cramer, S.C., et al., 1997. A functional MRI study of subjects recovered from hemiparetic stroke. Stroke 28 (12), 2518–2527. Culham, J.C., Valyear, K.F., 2006. Human parietal cortex in action. Current Opinion in Neurobiology 16 (2), 205–212. Gerloff, C., et al., 2006. Multimodal imaging of brain reorganization in motor areas of the contralesional hemisphere of well recovered patients after capsular stroke. Brain 129 (3), 791–808. Gharbawie, O.A., et al., 2011. Multiple parietal-frontal pathways mediate grasping in macaque monkeys. The Journal of Neuroscience: The Official Journal of the Society for Neuroscience 31 (32), 11660–11677. Gorbach, A.M., et al., 2004. Intraoperative infrared imaging of brain tumors. Journal of Neurosurgery 101 (6), 960–969. Gordon, A.M., et al., 1998. Functional magnetic resonance imaging of motor, sensory, and posterior parietal cortical areas during performance of sequential typing movements. Experimental Brain Research 121 (2), 153–166.
Hou, B.L., et al., 2006. Effect of brain tumor neovasculature defined by rCBV on BOLD fMRI activation volume in the primary motor cortex. NeuroImage 32 (2), 489–497. Kleinschmidt, A., Toni, I., 2005. Functional Magnetic Resonance Imaging of the Human Motor Cortex. CRC Press LLC. Krings, T., et al., 2000. Cortical activation patterns during complex motor tasks in piano players and control subjects. A functional magnetic resonance imaging study. Neuroscience Letters 278 (3), 189–193. Krings, T., et al., 2002. Activation in primary and secondary motor areas in patients with CNS neoplasms and weakness. Neurology 58 (3), 381–390. Liu, W., et al., 2005. The effect of tumour type and distance on activation in the motor cortex. Neuroradiology 47 (11), 813–819. Lotze, M., et al., 1999. Activation of cortical and cerebellar motor areas during executed and imagined hand movements: an fMRI study. Journal of Cognitive Neuroscience 11 (5), 491–501. Lotze, M., et al., 2006. The role of multiple contralesional motor areas for complex hand movements after internal capsular lesion. The Journal of Neuroscience: The Official Journal of the Society for Neuroscience 26 (22), 6096–6102. Naidich, T.P., et al., 2001. The motor cortex: anatomic substrates of function. Neuroimaging Clinics of North America 11 (2), 171–193 (vii-viii). Nair, D.G., et al., 2007. Imaging correlates of motor recovery from cerebral infarction and their physiological significance in well-recovered patients. NeuroImage 34 (1), 253–263. Otten, et al., 2012. Motor deficits correlate with resting state motor network connectivity in patients with brain tumours. Brain 135, 1017–1026. Partovi, S., et al., 2012. Clinical standardized fMRI reveals altered language lateralization in brain tumor patients. AJNR. American Journal of Neuroradiology 2151–2157. Pasqualin, A., Barone, G., Cioffi, F., Rosta, L., Scienza, R., Da Pian, R., 1991. The relevance of anatomic and hemodynamic factors to a classification of cerebral arteriovenous malformations. Neurosurgery 28, 370–379. Passingham, R.E., Perry, V.H., Wilkinson, F., 1983. The long-term effects of removal of sensorimotor cortex in infant and adult rhesus monkeys. Brain 106 (3), 675–705. Schreiber, A., et al., 2000. The influence of gliomas and nonglial space-occupying lesions on blood-oxygen-level-dependent contrast enhancement. AJNR. American Journal of Neuroradiology 21 (6), 1055–1063. Shinoura, N., et al., 2006. Restored activation of primary motor area from motor reorganization and improved motor function after brain tumor resection. AJNR. American Journal of Neuroradiology 27, 1275–1282. Staudt, M., et al., 2002. Two types of ipsilateral reorganization in congenital hemiparesis. Brain 125 (10), 2222–2237. Stippich, C., et al., 2000. Robust localization of the contralateral precentral gyrus in hemiparetic patients using the unimpaired ipsilateral hand: a clinical functional magnetic resonance imaging protocol. Neuroscience Letters 285 (2), 155–159. Stippich, C., Ochmann, H., Sartor, K., 2002. Somatotopic mapping of the human primary sensorimotor cortex during motor imagery and motor execution by functional magnetic resonance imaging. Neuroscience Letters 331 (1), 50–54. Stippich, C., et al., 2004. Fully automated localization of the human primary somatosensory cortex in one minute by functional magnetic resonance imaging. Neuroscience Letters 364 (2), 90–93. Stippich, C., et al., 2005. Time-efficient localization of the human secondary somatosensory cortex by functional magnetic resonance imaging. Neuroscience Letters 381 (3), 264–268. Stippich, C., et al., 2007a. Global activation of primary motor cortex during voluntary movements in man. NeuroImage 34 (3), 1227–1237. Stippich, C., et al., 2007b. Localizing and lateralizing language in patients with brain tumors: feasibility of routine preoperative functional MR imaging in 81 consecutive patients. Radiology 243 (3), 828–836. Stoeckel, M.C., Binkofski, F., 2010. The role of ipsilateral primary motor cortex in movement control and recovery from brain damage. Experimental Neurology 221 (1), 13–17. Takeuchi, N., et al., 2005. Repetitive transcranial magnetic stimulation of contralesional primary motor cortex improves hand function after stroke. Stroke 36 (12), 2681–2686. Talairach, J., 1988. Co-planar Stereotaxic Atlas of the Human Brain: 3-Dimensional Proportional System: An Approach to Cerebral Imaging. Thieme, Stuttgart. Ulmer, J.L., et al., 2004. Lesion-induced pseudo-dominance at functional magnetic resonance imaging: implications for preoperative assessments. Neurosurgery 569–581. Wise, S.P., et al., 1997. Premotor and parietal cortex: corticocortical connectivity and combinatorial computations. Annual Review of Neuroscience 20 (1), 25–42. Yousry, T.A., et al., 1997. Localization of the motor hand area to a knob on the precentral gyrus. A new landmark. Brain: A Journal of Neurology 120, 141–157.