Primary processes underlying the photostability of isolated DNA bases: Adenine Helmut Satzger†, Dave Townsend† Marek Z. Zgierski†, Serguei Patchkovskii†, Susanne Ullrich‡, and Albert Stolow†§ †Steacie
Institute for Molecular Sciences, Ottawa, ON, Canada K1A 0R6; and ‡Department of Physics and Astronomy, University of Georgia, Athens, GA 30602-2451
Edited by Robin M. Hochstrasser, University of Pennsylvania, Philadelphia, PA, and approved May 15, 2006 (received for review March 31, 2006)
The UV chromophores in DNA are the nucleic bases themselves, and it is their photophysics and photochemistry that govern the intrinsic photostability of DNA. Because stability is related to the conversion of dangerous electronic to less-dangerous vibrational energy, we study ultrafast electronic relaxation processes in the DNA base adenine. We excite adenine, isolated in a molecular beam, to its * state and follow its relaxation dynamics using femtosecond time-resolved photoelectron spectroscopy. To discern which processes are important on which timescales, we compare adenine with 9-methyl adenine. Methylation blocks the site of the much-discussed * state that had been thought, until now, minor. Time-resolved photoelectron spectroscopy reveals that, although adenine and 9-methyl adenine show almost identical timescales for the processes involved, the decay pathways are quite different. Importantly, we confirm that in adenine at 267-nm excitation, the * state plays a major role. We discuss these results in the context of recent experimental and theoretical studies on adenine, proposing a model that accounts for all known results, and consider the relationship between these studies and electron-induced damage in DNA. dynamics 兩 photochemistry
H
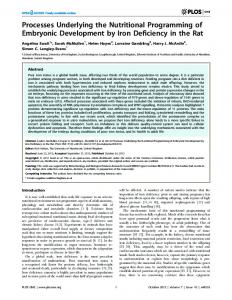
ow did nature protect the genetic code from damage by harmful UV radiation? Presumably, DNA itself must have inherent protection mechanisms that quickly convert dangerous electronic excitation into less-dangerous vibrational energy that subsequently cools rapidly in solution. Unfortunately, the details of these mechanisms remain obscure (1). The main UV chromophores in DNA are the nucleotide bases themselves, and therefore it is their primary photophysics and interactions, both long- and short-range, which underlie DNA photostability. The isolated DNA bases are small enough to attempt detailed quantum chemical calculations, and considerable effort has been devoted to this area (for a recent review, see ref. 1). Focusing on interactions, a study using a model of an isolated DNA base pair shed new light on possible electronic relaxation mechanisms (2). Recently, it was argued that excimer formation due to base stacking could be a major relaxation channel for the double helix in solution (3). Despite this, even the primary photophysical dynamics of a single nucleic base remains controversial and unresolved (1). Adenine is a prominent example. The observed electronic relaxation timescales of isolated adenine do not fit well with prevailing models, which often are based on the proximity effect of close-lying n* and * electronic states within the molecule (4). Unless stated otherwise, all excited states discussed here are of singlet character. In the gas phase, the 9H tautomer of isolated adenine (shown in Fig. 1) is the lowest-energy and most abundant form (1, 5), and therefore gas-phase experiments have focused on this structure. Studies of the UV absorption spectrum showed that the 252-nm band is predominantly a transition to an optically bright * state (6, 7). However, very close in energy lie at least one other much darker * state, the optically dark n* state, and a * state that is discussed in more detail below (1, 4, 8–10). A widely accepted mechanism for adenine electronic relaxation involves two sequential steps: *3 n* followed by n*3S0 (ground 10196 –10201 兩 PNAS 兩 July 5, 2006 兩 vol. 103 兩 no. 27
state) internal conversion (1). A much-discussed mechanism involves a * state centered at the N9–H position¶ (where the sugar attaches in adenosine; refs. 11 and 12). Large-amplitude motion of this hydrogen atom potentially leads to a very efficient relaxation channel. Recent calculations revealed yet another electronic relaxation channel involving a conical intersection of the * state directly with the ground state at a ‘‘ring-puckering’’ geometry on the six-membered ring (10, 13–15). The relative importance of these various channels has been a matter of debate and is the subject of the present contribution. Optically dark repulsive * states are a common feature of heteroatom-containing organics (11, 16) and have a conical intersection with the ground state, promoting fast radiationless transitions that can dominate their photochemistry. Unfortunately, * states are difficult to detect spectroscopically. Nevertheless, indirect evidence of * state participation has been obtained from H-atom loss experiments. Hydrogen atom detection is highly sensitive and can reveal even minor H-atom loss channels. The observation of fast hydrogen atoms after UV excitation of adenine is a compelling argument for the * state (17, 18): fast H atoms result from an excited-state potential that is repulsive in the N9–H coordinate. A comparison of the H-atom loss signals for adenine and 9-methyl adenine confirmed that the observed hydrogen atoms preferentially emit from the azine position (N9H). Although this shows that a * channel exists, it may play only a minor role, because relative quantum yields remain unknown. To determine the global importance of the * channel, a comparison of the primary photophysics of adenine with 9-methyl adenine will be useful, because the latter lacks a * channel at the excitation energies of concern here. A time-resolved ion-yield study comparing adenine with 9-methyl adenine (19) shed new light on this issue. The (gas phase) absorption spectra, photoelectron spectra, and calculated geometries for adenine and 9-methyl adenine are all very similar. Methylation, arguably, changes little but should lead to longer lifetimes in 9-methyl adenine compared with adenine, because of the absence of the * channel in the former. Indeed, quantum calculations suggest there is no conical intersection between the * and ground states in 9-methyl adenine (20). The observed 1-ps time constant in adenine may result from vibronic coupling of the * and n* states and a conical intersection of the n* and ground states (19, 21). A more recent time-resolved ion yield study found two time constants of 0.1 and 1 ps (22), the faster being attributed to relaxation within the * state (22). Unfortunately, the *兾n* proximity effect explains neither the methylation nor solvation effects (for details, see ref. 1), and many theoretical studies have sought to explain the discrepancies (4, 9, 10, 13, 15, 20, 23–26). Interestingly, these time-resolved ion Conflict of interest statement: No conflicts declared. This paper was submitted directly (Track II) to the PNAS office. Abbreviations: TRPES, time-resolved photoelectron spectroscopy; FC, Franck–Condon. §To
whom correspondence should be addressed. E-mail:
[email protected].
stated otherwise, * herein always refers to the * state centered at the N9 –H position.
¶Unless
© 2006 by The National Academy of Sciences of the USA
www.pnas.org兾cgi兾doi兾10.1073兾pnas.0602663103
yield studies did not reveal differences between adenine and 9-methyl adenine (19, 22), thus apparently disfavoring the * channel. By contrast, time-resolved photoelectron spectroscopy (TRPES) studies of adenine supported the existence of a * channel, based upon the pump-wavelength dependence of the TRPES spectra (27, 28). Finally, recent solution-phase measurements of adenine fluorescence lifetimes as a function of the pump wavelength also supported a * channel (29). Here we present a high-resolution TRPES comparison of adenine with 9-methyl adenine. TRPES is particularly suited to studying ultrafast nonadiabatic processes such as internal conversion and, combined with quantum calculations, can permit determination of the orbital character of the states involved (30–32). In this communication, we offer clear evidence that the * channel plays a major role in the electronic relaxation of photoexcited adenine and develop a mechanism that is consistent with all known experimental results. In addition, we spec-
ulate on the relationship between these results and the observed dissociative electron attachment of low-energy (⬍3 eV; 1 eV ⫽ 1.602 ⬘ 10⫺19 J) electrons to nucleobases and DNA. The ultrafast * to * relaxation channel may help to explain the observed dominance of sugar-phosphate COO bond rupture in electrondamaged DNA. Results and Discussion Our molecular-beam TRPES spectra of isolated adenine and 9-methyl adenine, using a femtosecond 267-nm pump and a 200-nm probe, are presented in Fig. 2 and are discussed below. Further experimental details are discussed in supporting information, which is published on the PNAS web site. In 9-methyl adenine, a broad spectral feature that covers the 7.5- to 10.8-eV electron-binding energy (Eb) range is seen. This spectrum, peaking toward 10.8 eV, decays quickly and, beyond 500 fs, transforms into a second spectral feature spanning the
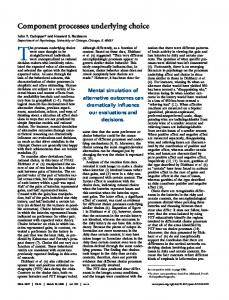
Fig. 2. Photoelectron spectra and deconvoluted decay-associated spectra. TRPES spectra for 9-methyl adenine (a) and adenine (c). The time dependence is plotted by using a linear兾logarithmic scale with a linear scale in the region ⫺0.5–1.0 ps and a logarithmic scale for delay times 1.0 –10.0 ps. Below, b and d show the decomposition into decay-associated spectra obtained from the global fitting algorithm. The assignments are discussed in the text.
Satzger et al.
PNAS 兩 July 5, 2006 兩 vol. 103 兩 no. 27 兩 10197
BIOPHYSICS
Structures of (a) 9-methyl adenine and (b) adenine (nitrogen in dark blue; carbon, light blue; and hydrogen, white).
CHEMISTRY
Fig. 1.
8.5- to 10.8-eV (Eb) range. This second spectrum grows smoothly between 8.5 and 9.6 eV and is flat between 9.6 and 10.8 eV. This feature decays more slowly, in ⬇3 ps. Beyond ⬇6 ps, no remaining photoelectron signal was observed. Global fitting algorithms determined that two exponential time constants, 1 ⫽ 70 fs ⫾ 25 fs and 2 ⫽ 1.1 ps ⫾ 0.11 ps, were needed to accurately describe these data (further details on the fitting procedure can be found in supporting information). The decay-associated spectra obtained from the fitting algorithm are shown in Fig. 2b. The spectrum of the fast (70-fs) component has two features, at 7.7- to 9.3-eV Eb and at ⬎9.8-eV Eb. The spectrum of the slower (1.1-ps) component begins near 8.8-eV Eb, rising between 8.8 and 9.5 eV, and is flat in the 9.5- to 10.8-eV Eb range. As in 9-methyl adenine, the TRPES spectrum of adenine (Fig. 2c) exhibits a broad feature ranging from 7.5 to 10.8 eV and peaking toward 10.8-eV Eb. There appear to be shoulders ⬇9.2and 9.8-eV Eb. Beyond 500 fs, this evolves into a second spectral feature that covers the 8.5- to 10.8-eV Eb range. Again, this spectrum rises smoothly between 8.5 and 9.6 eV and is flat between 9.6- and 10.8-eV Eb. Once again, this feature decays in ⬇3 ps. The global fitting algorithm yields 1 ⫽ 40 ⫾ 20 fs and 2 ⫽ 1.2 ⫾ 0.18 ps. The decay-associated spectra are shown in Fig. 2d. In a previous study on adenine, we reported three time constants: ⬍50 fs, 750 fs, and a nanosecond component at 267-nm excitation (27, 28). The adenine data presented here are in good basic agreement with these earlier results, but, because of much higher signal-to-noise ratios, we are now able to precisely fit the data using only two time constants. For the fastest process, we determined a time constant of 40 fs. Importantly, only a single time constant of 2 ⫽ 1.2 ps is required to describe the slower decay rate. Methylation, it was argued, should make the N9–H * channel inaccessible and therefore considerably slow down the dynamics in 9-methyl adenine. Earlier studies comparing adenine with 9-methyl adenine (19, 22) determined time constants from integrated ion yield data, finding no differences between the two molecules. At first glance, the present results appear to confirm this finding, with the extracted time constants for adenine (40 fs and 1.2 ps) and 9-methyl adenine (70 fs and 1.1 ps) being the same within our confidence intervals. Central to the present paper is that, although the time constants for adenine and 9-methyl adenine are similar, the associated photoelectron spectra reveal important differences that are obscured in ionyield measurements. As can be seen from the raw data in Fig. 2 a and c and especially from the decay-associated spectra in Fig. 2 b and d, the overall decay of adenine is dominated by the faster process, but in 9-methyl adenine, the fast and slow processes have similar amplitudes. Importantly, the decay-associated spectra of the fast component are clearly different in the two molecules, with adenine having significant amplitude in the 9.3- to 9.8-eV region, where 9-methyl adenine exhibits a gap. Insight into the differences between 9-methyl adenine and adenine may be obtained from Fig. 3. We call the electronic states of the cation D0, D1, D2. . . and label them according to which electron is removed (e.g., ⫺1, n⫺1). We compare the associated spectrum of the fast component in 9-methyl adenine (70 fs; dashed line in Fig. 3a) with calculated Franck–Condon (FC) structures for the *3 D0 (⫺1) ⫹ e⫺ (solid line) and *3 D2 (⫺1) ⫹ e⫺ (dotted line) ionizing transitions. The associated spectrum of the 70-fs time constant represents the (transient) photoelectron spectrum of the initially populated state. The two separated peaks agree well with the FC calculations. Note that the FC structure has been calculated from the zero-point level of the excited singlet electronic state. Incorporating the excess energy of the 267-nm photon will lead to additional broadening of the FC structures. In the 9.3- to 9.8-eV Eb range, we might expect to see contributions from the n*3 D1 (n⫺1) ⫹ e⫺ transition. Applying a Koopmans’ corre10198 兩 www.pnas.org兾cgi兾doi兾10.1073兾pnas.0602663103
Fig. 3. Decay-associated spectrum of the initially populated state compared with calculated FC spectra for (a) 9-methyl adenine and (b) adenine. Because of the excess energy at 267-nm excitation, the FC spectra should be broader than shown, especially for the diffuse * state. The * channel fills in the FC gap in adenine; its absence leaves a gap in 9-methyl adenine.
lation analysis (31), we expect that the * state should preferentially ionize into a ⫺1 cation state and, similarly, that the n* state should preferentially ionize into a n⫺1 cation state. Because we do not see amplitude in the D1 energy range, we conclude that the initially excited state is predominantly *, with little n* character. In adenine, calculations (11, 16) suggest that the * channel is rapidly populated from the initial * state. In this case, we expect that the associated spectrum of the 40-fs component in adenine contains an additional contribution beyond the * 3 D0 (⫺1) ⫹ e⫺ (blue solid line in Fig. 3b) and * 3 D2 (⫺1) ⫹ e⫺ (blue dotted line) transitions seen in 9-methyl adenine. Again, the excess energy of the 267-nm photon has not been taken into account and would lead to broadened FC spectra, especially for the * 3 D0 (⫺1) ⫹ e⫺ transition. Largeamplitude H-atom motion should smear out the sharp peaks, leading to a broad spectral signature. The experimentally observed spectrum shows distinctly nonzero amplitude in the energy region 9.3 to 9.8 eV. In adenine, this region is filled from the left by transitions due to * 3 D0 (⫺1) ⫹ e⫺ and from the right by * 3 D2 (⫺1) ⫹ e⫺. These calculated FC structures provide strong evidence that the * is present in adenine and absent in 9-methyl adenine. Accordingly, adenine has two fast relaxation channels from the * state, whereas 9-methyl adenine has only one. This is consistent with our observation that, despite the large error bars, the extracted time constants seem faster for adenine (40 fs) than for 9-methyl adenine (70 fs). [Experiments in solution also found slightly faster dynamics for adenine than for 9-methyl adenine (33).] Assuming this difference to be due to the * channel operating only in adenine, we can use the * lifetimes in a simple kinetic model to crudely estimate the lifetime of the * state as being ⬇90 fs. We now consider the global importance of the * channel in isolated adenine. To compare the relative amplitudes of competing channels, we scaled the data in Fig. 2 b and d such that the time-integrated spectra are normalized to unit ionization yield for each molecule. We see that the relative amplitude of the Satzger et al.
Satzger et al.
takes a sequential pathway, going rapidly (1 ⫽ 70 fs) to the n* state and from there via a conical intersection into the ground state (2 ⫽ 1.1 ps). By contrast in adenine, the fast decay (1 ⫽ 40 fs) is accompanied with a branching, with 10–55% of the population going to the n* state, but the majority (45–90%) of the population proceeding via the dissociative * state directly to the ground state. We believe other channels (such as ring puckering) play only a minor role at this excitation wavelength. Roughly the same time constants are extracted upon 250-nm (27) excitation, compared with 267-nm excitation. The ⬇1-ps component at 267 nm, however, has ⬇2–2.5 times more amplitude than its equivalent at 250-nm excitation (27). This implies that at 250 nm, 2–2.5 times more population decays via the n* channel. In our picture, the * channel is still active, but because of high internal energy, the molecule has access to multiple pathways leading to the n* state, thus increasing the yield of this channel. The recently suggested deactivation pathway involving a six-ring-puckering mode (10, 13–15) describes a fast and barrierless pathway from the * state directly to the ground state. If this were the case, we would expect this channel to become more important with increasing excitation energy, and hence TRPES should detect less amplitude in the transient n* spectrum at 250-nm excitation than at 267 nm. Because the converse is observed, we suggest that more population takes the sequential pathway * 3 n*兾biradical 3 S0. Our findings therefore tend to support Broo’s picture that the six-ring puckering leads to a crossing from * 3 n*兾biradical (4). The problem of photostability mainly concerns DNA directly exposed to light. Hard radiation, however, easily penetrates the body and is known to generate slow secondary electrons that can subsequently attach to DNA, leading to single- and doublestrand breaks in the double helix (37–42). Dissociative electron attachment of low-energy electrons (⬍3 eV) to adenine injects an electron into an empty * orbital and leads exclusively to dehydrogenation at the N9 position (40). It is interesting to compare this with the observed dehydrogenation of adenine upon optical pumping into the * band (ref. 18; see also ref. 40). Because in both cases the ejection of hydrogen is observed and a * orbital is involved, we speculate that the * orbital is PNAS 兩 July 5, 2006 兩 vol. 103 兩 no. 27 兩 10199
BIOPHYSICS
Fig. 4. Schematic depiction of the electronic relaxation dynamics in adenine (the picture for 9-methyl adenine is identical, save for a missing * state). Red and green indicate Koopmans’ allowed ionization propensities. The abscissa is a generalized reaction coordinate. For example, the N9 –H distance is the reaction coordinate for the * state, whereas in * and n*, it is the out-of-plane displacement of C2 (see supporting information for more information about the depiction of the potential energy curves).
CHEMISTRY
1-ps component is reduced by a factor of four in adenine compared with 9-methyl adenine. In Fig. 2b, it can also be seen that the decay-associated spectra of the fast and slow components in 9-methyl adenine (where the * does not play a role) have nearly the same area. This confirms that a sequential relaxation pathway via n* is the dominant one. Given this assertion, we suggest that in adenine, only ⬇25% of * decay proceeds via the (sequential) n* channel, with the majority proceeding via *. The relatively large uncertainty in the values of the fast time constants leads to uncertainties in the exact ratio of the fast vs. (much more accurately determined) slowamplitude components. Nevertheless, we can conservatively estimate that in adenine, decay proceeds via * with 45–90% probability (these values represent upper and lower bounds to our estimate). This pathway therefore plays a highly significant role in the relaxation dynamics of the system. This tendency in adenine for having less amplitude in the slower component is also distinguishable in the previously reported ion yield data (19, 22). We note that the shapes of the associated 1-ps spectra in Fig. 2 b and d are almost identical for the two molecules and are simply shifted by ⬇0.1 eV, as expected from He(I) photoelectron spectra (6). The very similar geometries and He(I) photoelectron spectra of adenine and 9-methyl adenine help justify this type of analysis. There is a second * state located at the NH2 group on the six-membered ring (C6 position), the importance of which is unclear. Our calculations find the * state at the NH2 position to be higher in energy and therefore not accessible at 267-nm excitation. Even if this second * state were to play a role in the dynamics at 267 nm, it will be open for both adenine and 9-methyl adenine, and its contribution to the photoelectron spectra should be similar in both cases. Similar arguments exist for the recently proposed ring-puckering deactivation from * directly to the electronic ground state, because this involves a distortion of the six-membered ring (common to both adenine and 9-methyl adenine) and located well away from the 9H position. Consequently, neither of these mechanisms is able to account for the differences we observe in the decay-associated photoelectron spectra of the fast channel. The clear Koopmans’ correlations in the decay-associated spectra in Fig. 3 a and b allow for unambiguous assignment of the fast time constant to the decay of a * state in 9-methyl adenine (*兾* in adenine) and of the slow time constant to the decay of an n* state. The clean contrast in these spectra would seem to imply very little mixing occurs between the * and n* channels [a finding somewhat at odds with the proximity effect arguments of Canuel et al. (22)]. Very recently, however, some doubt has been cast upon the origin of the slow time constant signal. Calculations on cytosine found a relevant biradical conformation (34, 35): ongoing calculations on adenine point to a similar biradical state that lies at a considerably lower (⬇0.8-eV) energy than the n* state and that would preferentially ionize into the cationic D1 state. We therefore note this channel could also contribute to the slow time constant (M. Z. Zgierski and S. Patchkovskii, personal communication), although our data do not permit a definite assignment. In the following, we summarize our findings in a coherent picture that explains the observations at different pump wavelengths (see Fig. 4). Excitation of adenine at 277 nm brings the molecule to the minimum of the * state where a lifetime of 9 ps was observed (7). The 9-ps time constant was interpreted as stemming from the inaccessibility of the n* state. Relaxation was therefore proposed to proceed via intersystem crossing to a triplet state (most likely 3n* by El Sayed’s rules; ref. 36). This also explained an asymptotic offset seen in the experimental data. The additional possibility of a *3n* tunneling mechanism cannot be ruled out, however. As discussed, in 9-methyl adenine, upon 267-nm excitation, the majority of the population
involved in both cases. The situation is of course more complex for DNA. The present work shows that attachment of a methyl group at the N9 position of adenine effectively removes the N9–H * state. Inside DNA, however, adenine is incorporated via a sugar group that attaches at the N9 position. The sugar acts as an electron-withdrawing group that might lower the * state. This could be tested in future TPRES experiments by attaching electron-withdrawing substituents to adenine at the N9 position. Work on low-energy electron attachment suggests that electrons attach either to the phosphate P ⫽ O * orbital or directly to a * orbital of the nucleobase (39, 43). Theoretical considerations show that electron attachment to a * orbital at the nucleobase can lead to rupture of the COO bond between the sugar and the phosphate (39, 44–46). We therefore speculate that an electron attached to the * orbital of adenine couples rapidly and efficiently to * at the N9 position in a manner similar to that demonstrated in the present communication for the case of photoexcitation. Subsequent steps involving through-bond electron transfer to the base-sugar *, and the sugar’s various * orbitals lead eventually to the electron being localized at the sugar-phosphate COO * orbital, where bond cleavage may occur (47). In conclusion, we have used TRPES to study the primary electronic relaxation processes in the isolated DNA base adenine and its 9-methyl analogue. By comparing our experimental results with calculated FC progressions for each molecule, we confirmed that the * state plays a major role in the deactivation dynamics of adenine. These fast processes are a key to the inherent photostability of DNA itself. The ability of TRPES to observe both bright and dark states and to provide dispersed (photoelectron) spectra of the excited configurations involved was key to determining the rate and yields of the processes involved. We expect TRPES studies to shed new light on the fast dynamics of a broad range of biologically relevant molecules. Materials and Methods Experimental. Adenine was purchased from Sigma-Aldrich, and 9-methyl adenine was purchased from Fischer Scientific. All samples were used without further purification. The TRPES spectra were collected in a magnetic bottle spectrometer (for details, see refs. 28 and 48). The samples were brought into the gas phase by using a high-temperature glass nozzle with an orifice of 500-m diameter and by heating the whole assembly to 180–230°C. Preheated argon at a stagnation pressure of 100–120 torr (1 torr ⫽ 133 Pa) was used as carrier gas for the sublimed sample molecules. No signs of cluster formation were observed. The laser system consists of a Ti:sapphire oscillator and regenerative amplifier, yielding ⬇2.7 mJ at a central wavelength 1. Crespo-Hernandez, C. E., Cohen, B., Hare, P. M. & Kohler, B. (2004) Chem. Rev. 104, 1977–2019. 2. Schultz, T., Samoylova, E., Radloff, W., Hertel, I. V., Sobolewski, A. L. & Domcke, W. (2004) Science 306, 1765–1768. 3. Crespo-Hernandez, C. E., Cohen, B. & Kohler, B. (2005) Nature 436, 1141– 1144. 4. Broo, A. (1998) J. Phys. Chem. A 102, 526–531. 5. Lin, J., Yu, C., Peng, S., Akiyama, I., Li, K., Lee, L. K. & LeBreton, P. R. (1980) J. Am. Chem. Soc. 102, 4627–4631. 6. Clark, L. B., Peschel, G. G. & Tinoco, I. (1965) J. Phys. Chem. 69, 3615–3618. 7. Lu ¨hrs, D. C., Viallon, J. & Fischer, I. (2001) Phys. Chem. Chem. Phys. 3, 1827–1831. 8. Sobolewski, A. L. & Domcke, W. (2002) Eur. Phys. J. D 20, 369–374. 9. Chen, H. & Li, S. (2005) J. Phys. Chem. A 109, 8443–8446. 10. Perun, S., Sobolewski, A. L. & Domcke, W. (2005) Chem. Phys. 313, 107–112. 11. Sobolewski, A. L. & Domcke, W. (2000) Chem. Phys. 259, 181–191. 12. Domcke, W. & Sobolewski, A. L. (2003) Science 302, 1693–1694. 13. Marian, C. M. (2005) J. Chem. Phys. 122, 104314. 14. Marian, C., Nolting, D. & Weinkauf, R. (2005) Phys. Chem. Chem. Phys. 7, 3306–3316. 10200 兩 www.pnas.org兾cgi兾doi兾10.1073兾pnas.0602663103
of 800 nm. The pump (267 nm, ⬇1 J) and probe (200 nm, ⬇0.3 J) pulses were produced by generating the third and fourth harmonic of the 800-nm output. The two pulses were combined on a dichroic mirror and focused (f兾80) into the interaction region using a concave aluminum mirror. The pump-probe crosscorrelation was ⬇160 fs, measured by nonresonant twocolor multiphoton ionization of both NO and NH3. TRPES were recorded in the ⫺1- to 10-ps range by using 5 ⫻ 105 laser shots per time step. Dynamic background subtraction of one-laser signals was implemented. The time of flight to energy calibration was obtained by using photoelectron spectra from NO. Time constants were extracted from the data by using a global fitting algorithm (Levenberg–Marquardt). Confidence intervals for time constants obtained have been estimated by using an exhaustive search algorithm, as reported in refs. 49 and 50. The visualizations in Fig. 1 were created by using VMD (51). Quantum Chemical Calculations. The geometries and force fields of the S0, Sn, D0, and D2 states of neutral adenine and its radical cation were obtained with the Hartree–Fock and configuration interaction singles and correlation-consistent valence double- methods with the 6–31⫹⫹G** and cc-pVDZ basis sets. Additionally, they were obtained with the three-parameter Becke– Lee–Yang–Parr Density Functional Theory method for the ground states of the neutral molecule and its cation. Vertical electronic excitation energies were calculated with the timedependent method at the optimized geometries. The calculated geometries and force fields allow for the calculation of the FC structure of the electronic transitions. These structures have been obtained for the S(*) 3 D0 ⫹ e⫺, S(*) 3 D0, D2 ⫹ e⫺ ionization processes from the zero-point level of the excited singlet electronic states. The FC structure of the S(*) 3 D0,D2 ⫹ e⫺ transitions was obtained for a N9–H distance of 1.2 Å and a stretching frequency in the * state of ⬇1,500 cm⫺1. The long progression belongs to the N9–H stretch mode (see Fig. 3). If the * state is dissociative, as suggested by time-dependent Density Functional Theory calculations (8), then the FC structure due to photoionization from this state will be even more diffuse and wider than is shown here. Calculating the FC structure for transitions to higher cationic states was not possible due to ultrafast relaxation into the cationic ground state, D0. The excess energy of the 267-nm probe photon (⬇0.2 eV) has not been taken into account in the calculations; this would additionally broaden the calculated spectra. We thank Niklas Gador from the National Research Council in Ottawa and Prof. Jack Simons from the University of Utah, Salt Lake City, for helpful discussions. H.S., D.T., and A.S. thank the Natural Sciences and Engineering Research Council for funding. 15. Perun, S., Sobolewski, A. L. & Domcke, W. (2005) J. Am. Chem. Soc. 127, 6257–6265. 16. Sobolewski, A. L., Domcke, W., Dedonder-Lardeux, C. & Jouvet, C. (2002) Phys. Chem. Chem. Phys. 4, 1093–1100. 17. Hu ¨nig, I., Plu ¨tzer, C., Seefeld, K. A., Lo ¨wenich, D., Nispel, M. & Kleinermanns, K. (2004) Chem. Phys. Chem. 5, 1427–1431. 18. Zierhut, M., Roth, W. & Fischer, I. (2004) Phys. Chem. Chem. Phys. 6, 5178–5183. 19. Kang, H., Jung, B. & Kim, S. K. (2003) J. Chem. Phys. 118, 6717–6719. 20. Nielsen, S. B. & Sølling, T. I. (2005) Chem. Phys. Chem. 6, 1276–1281. 21. Kang, H., Lee, K. T., Jung, B., Ko, Y. J. & Kim, S. K. (2002) J. Am. Chem. Soc. 124, 12958–12959. 22. Canuel, C., Mons, M., Piuzzi, F., Tardivel, B., Dimicoli, I. & Elhanine, M. (2005) J. Chem. Phys. 122, 074316. 23. Mennucci, B., Toniolo, A. & Tomasi, J. (2001) J. Phys. Chem. A 105, 4749–4757. 24. Matsika, S. (2005) J. Phys. Chem. A 109, 7538–7545. 25. Tsolakidis, A. & Kaxiras, E. (2005) J. Phys. Chem. A 109, 2373–2380. 26. Blancafort, L. (2006) J. Am. Chem. Soc. 128, 210–219.
Satzger et al.
40. Abdoul-Carime, H., Langer, J., Huels, M. A. & Illenberger, E. (2005) Eur. Phys. J. D 35, 399–404. 41. Sanche, L. (2005) Eur. Phys. J. D 35, 367–390. 42. Ray, S. G., Daube, S. S. & Naaman, R. (2005) Proc. Natl. Acad. Sci. USA 102, 15–19. 43. Gu, J. D., Xie, Y. M. & Schaefer, H. F. (2006) J. Am. Chem. Soc. 128, 1250–1252. 44. Barrios, R., Skurski, P. & Simons, J. (2002) J. Phys. Chem. B 106, 7991–7994. 45. Berdys, J., Skurski, P. & Simons, J. (2004) J. Phys. Chem. B 108, 5800–5805. 46. Berdys, J., Anusiewicz, I., Skurski, P. & Simons, J. (2004) J. Phys. Chem. A 108, 2999–3005. 47. Anusiewicz, I., Sobczyk, M., Berdys-Kochanska, J., Skurski, P. & Simons, J. (2005) J. Phys. Chem. A 109, 484–492. 48. Lochbrunner, S., Larsen, J. J., Shaffer, J. P., Schmitt, M., Schultz, T., Underwood, J. G. & Stolow, A. (2000) J. Electron Spectrosc. Rel. Phenom. 112, 183–198. 49. Satzger, H. & Zinth, W. (2003) Chem. Phys. 295, 287–295. 50. Roelofs, T. A., Lee, C.-H. & Holzwarth, A. R. (1992) Biophys. J. 61, 1147–1163. 51. Humphrey, W., Dalke, A. & Schulten, K. (1996) J. Mol. Graphics 14, 33–38.
CHEMISTRY
BIOPHYSICS
27. Ullrich, S., Schultz, T., Zgierski, M. Z. & Stolow, A. (2004) J. Am. Chem. Soc. 126, 2262–2263. 28. Ullrich, S., Schultz, T., Zgierski, M. Z. & Stolow, A. (2004) Phys. Chem. Chem. Phys. 6, 2796–2801. 29. Pancur, T., Schwalb, N. K., Renth, F. & Temps, F. (2005) Chem. Phys. 313, 199–212. 30. Blanchet, V., Zgierski, M. Z., Seideman, T. & Stolow, A. (1999) Nature 401, 52–54. 31. Stolow, A. (2003) Annu. Rev. Phys. Chem. 54, 89–119. 32. Stolow, A., Bragg, A. E. & Neumark, D. M. (2004) Chem. Rev. 104, 1719–1757. 33. Cohen, B., Hare, P. M. & Kohler, B. (2003) J. Am. Chem. Soc. 125, 13594–13601. 34. Zgierski, M. Z., Patchkovskii, S., Fujiwara, T. & Lim, E. C. (2005) J. Phys. Chem. A 109, 9384–9387. 35. Zgierski, M. Z., Patchkovskii, S. & Lim, E. C. (2005) J. Chem. Phys. 123, 081101. 36. El-Sayed, M. (1963) J. Chem. Phys. 38, 2834. 37. Aflatooni, K., Gallup, G. A. & Burrow, P. D. (1998) J. Phys. Chem. A 102, 6205–6207. 38. Boudaı¨ffa, B., Cloutier, P., Hunting, D., Huels, M. A. & Sanche, L. (2000) Science 287, 1658–1660. 39. Berdys, J., Anusiewicz, I., Skurski, P. & Simons, J. (2004) J. Am. Chem. Soc. 126, 6441–6447.
Satzger et al.
PNAS 兩 July 5, 2006 兩 vol. 103 兩 no. 27 兩 10201