spectrum-based fault localisation approach to rank explanations ... validation and debugging of software consumes a considerable ..... tions in best-first order rather than computing all explanations at once ..... Checking C programs with lint.
Prioritising Model-Based Debugging Diagnostic Reports Wolfgang Mayer† and Rui Abreu‡ and Markus Stumptner† and Arjan J.C. van Gemund‡ †
Abstract Model-based debugging has proved successful as a tool to guide automated debugging efforts, but the technique may suffer from large result sets in practice, since no means to rank or discriminate between the returned candidate explanations are available. We present a unique combination of model- and spectrum-based fault localisation approach to rank explanations and show that the combined framework outperforms the individual approaches as well as other state of the art automated debugging mechanisms.
1
‡
Advanced Computing Research Centre University of South Australia Australia {mayer,mst}@cs.unisa.edu.au
Introduction
The problem of faulty software has been recognised as longstanding issue, with considerable costs attached to locating and eliminating problems in development as well as after deployment of software systems [19]. In particular, testing, validation and debugging of software consumes a considerable slice of the overall software development costs. Hence, numerous approaches have been proposed to automate parts of this process to help detect more defects earlier in the development cycle and to guide software engineers towards possible faults. Early debugging efforts were geared towards reducing the size of a program that must be investigated by analysing the structure and dependencies between different parts of the program’s source code [16]. More recently, dynamic analysis techniques have been proposed that exploit traces of program executions to accommodate the size of modern software systems [23]. While applicable to a wide variety of programs, both approaches are limited by the absence of a detailed model of the correct behaviour of a program. To overcome these limitations, a spectrum of model-based fault isolation techniques has been advocated as powerful debugging aid that can help to isolate faults in complex programs [12]. By comparing the state and behaviour of a program to what is anticipated by its programmer, model-based reasoning techniques separate those parts of a program that may contain a fault from those that cannot be responsible for observed symptoms. A distinguished advantage of the model-based framework is that it helps programmers by systematically exploring different fault assumptions while hiding the complex underlying reasoning procedures behind a simple intuitive conceptual interface.
Embedded Software Lab Delft University of Technology The Netherlands {r.f.abreu,a.j.c.vangemund}@tudelft.nl Initial experiences with model-based software debugging (MBSD) have shown that the approach is competitive with other state of the art automated debugging aids [13], but it has also become clear that no single technique is sufficient to deal with a variety of programs and faults. Instead, a combination of approaches must be pursued where the strengths of individual techniques complement each other to lead to a more accurate and robust debugging tool. In this paper we present a combined framework that integrates model-based debugging with popular dynamic program analysis techniques to focus search and rank results. We show that, as a result, fewer program fragments are being implicated, leading to considerably increased accuracy as well as reduced computational complexity of the overall approach. While MBSD is general enough to be combined with almost any debugging tool that can expose its findings in terms of the original program’s source code and a set of fault assumptions, the combination of semantic and trace-based analysis is particularly appealing, since the approaches contribute complementary information: MBSD injects and analyses specific modifications to the semantics of a program, while dynamic analysis exploits fault correlation to focus the search. Our presentation is structured as follows: The principles of model-based debugging are outlined in Section 2, followed by a discussion of spectrum-based fault localisation in Section 3. The combined framework is discussed in Section 4. Empirical validation of our approach and our findings are given in Section 5. Section 6 discusses relevant related works, followed by the conclusion.
2
Model-based Software Fault Localisation
In search for effective (semi-) automated debugging aids, many different strategies have been proposed in the last three decades. Approaches to automate analysis and isolation of faults in programs range from purely syntactical checks to isolate common fault patterns [4], over execution trace-based analysis [15] to full-fledged semi-automatic program verification [2]. Syntax-based analysis can be easily applied to most programs, but its results are often language-specific and depend on particular syntactic programming styles; trace-based techniques depend on a suitable test harness being available. Better results can often be achieved if a model of the correct program behaviour is available to guide debugging efforts. For example, a partial specification expressed in some formal lan-
guage. Unfortunately, building such models is error prone and prohibitively expensive for many software development scenarios. Attempts to devise formal specifications for non-trivial systems has shown that constructing a model that captures an abstraction of the semantics of a system can be as difficult and error-prone as building a concrete implementation [14]. Model-based debugging [12] aims to close the gap between powerful formal analysis techniques and executionbased strategies in a way that does not require the end-user to possess knowledge of the underlying reasoning mechanisms. Here, an adaption of the classic “reasoning from first principles” paradigm borrowed from diagnosis of physical systems is particularly appealing, since much of the complexity of the formal underpinnings of program analysis can be hidden behind an interface that resembles the end-user’s traditional view of software development.1 Different to classical model-based diagnosis, where a correct model is furnished and compared to symptoms exhibited by an actual faulty physical artifact, debugging software reverses the roles of model and observations. Instead of relying on the user to formally specify the desired program behaviour, the (faulty) program is taken as its own model and is compared to examples representing correct and incorrect executions. Hence, the model in MBSD reflects the faults present in the program, while the observations indicate program inputs and correct and incorrect aspects of a program’s execution. Observations can either be introduced interactively, or be sourced from existing test suites. Example 1 Consider the program in Figure 1. An observation for this program consists of concrete program inputs, that is values for variables tbl, n and k before line 1, together with the anticipated result value returned by the algorithm. For example, the assignments tbl ← [90, 21, 15, 0, 0, 0, 8, 23, 0, 0, 0, 0, 50, 60, 59], n ← 16, k ← 90 and the assertion result = 0 could be an “observation” specifying the inputs and the desired result of a particular program execution. Since the result (−1) obtained by running the program on the given inputs contradicts the anticipated result (0), it has been shown that the program is incorrect. (Indeed, the program contains a defect in line 9; when assigning 0 to variable i, the program works as expected.) In the following, we briefly outline the model construction. More detailed discussion can be found in [11; 12]. A program is partitioned into “components”, each representing a particular fragment in the program’s source code. The behaviour of each component is automatically derived from the effects of individual expressions the component comprises. Connections between components are based on control- and datadependencies between the program fragments represented by each component. Example 2 Assume a model at statement granularity is to be created from the program in Figure 1. For each statement s, a separate component is created that is comprised of the expressions and sub-expressions in s. The inputs and outputs 1
In the software engineering context, the notion of “first principles” may be interpreted in the sense of “directly available from program execution and source code”.
function F IND I NDEX(tbl, n, k) . Find the index of key k in the hash table tbl[0, . . . , n − 1], or −1 if not found. Assumes that tbl contains a free slot. 1 2 3 4 5 6 7 8 9 10 11 12
i ← H ASH(k) while tbl[i] 6= 0 do if tbl[i] = k then return i end if if i < n − 1 then i←i+1 else i←1 end if end while return −1 end function
. Hash key . Empty slot? . Found match . At end? . Try next . Wrap around (incorrectly) . Not found
Figure 1: Algorithm to search in a hash table. (There is a fault in line 9.) of the components correspond to the used and modified variables, respectively. Connections between the components are created to reflect data dependencies between statements in the program (as determined by a simple data flow analysis). Additional variables and components may be introduced to correctly capture data flow at points where control flow paths may split or merge. The component C7 corresponding to statement 7 in Figure 1 is represented as a component with input i2 and output i7 . Here, i7 represents the result value of statement 7, and i2 denotes the previous value of variable i that is implicitly defined at the loop head in line 2. Similar to classical model-based diagnosis, the model also provides different operating modes for each component, where the “correct” mode ¬AB(C) of component C corresponds to the case where C is not to blame for a program’s misbehaviour. In this case, C is defined to function as specified in the program. Conversely, when C is assumed “abnormal” (AB(C)), the C may deviate from the program’s behaviour. Example 3 The behaviour of C7 can be expressed as the logical sentence ¬AB(C7 ) ⇒ i7 = i2 + 1.
(1)
In the case where C7 is considered faulty (AB(C7 ) is true), the effect on i7 is left unspecified. The main difference between the original program and its model is that the model represents the program in a form that is suitable for automated consistency checking and prediction of values in program states in the presence of fault assumptions. This includes program simulation on partially defined program states and backward propagation of values or constraints, which would not occur in a regular (forward) program execution. Since the resulting model includes the same faults as the program, means to compensate for incorrect structure and behaviour of components must be introduced. While heuristics to diagnose structural deficiencies in physical systems can be
based on invariants and spatial proximity [3], in software, the model must be adapted and restructured once a defect in its structure has become a likely explanation. Here, detection and model adaption must be guided by using abstract assertions that capture simple “structural invariants” [11]. Also, since different fault assumptions may alter the control and data flow in a program, models may be created on-the-fly rather than in the initial setup stage. A trade-off between computational complexity and accuracy can be achieved by selecting different abstractions and models [12], both in terms of model granularity and representation of program states and executed transitions. Example 4 In Example 3 the representation of program state has been left unspecified. Using an interval abstraction to approximate a set of values, sentence (1) becomes a constraint over interval-valued variables i2 and i7 [13]. Another possible abstraction is to encode the operation as logical sentences over the variables’ bit representations [13]. In this paper, we use the interval abstraction described in [12], since it provides good accuracy but avoids the computational complexity of the bit-wise representation. Similar to consistency-based diagnosis in physical systems [17], from discrepancies between the behaviour predicted by the model and the behaviour anticipated by the user, sets of fault assumptions are isolated that render the model consistent with the observations. Diagnoses are obtained by mapping the implicated components into the program’s source code. Formally, our framework is based on extensions to Reiter’s consistency-based framework [12]: Definition 1 (Diagnosis) Let P denote a program and T a set of test cases, where each T ∈ T is a pair hI, Ai where I specifies P’s inputs and A is a set of assertions over variables in P that (partially) specify the correct behaviour of P with respect to T . Let C denote a partition of the statements in P. A diagnosis of P with respect to T is a set of components D such that ∀hI, Ai ∈ T : P(I) ∧{AB(C)|C ∈ D} ∧{¬AB(C)|C ∈ C \ D} 6|= ¬A. Example 5 Continuing Example 4, a contradiction between the test case from Example 1 and the program is detected when the assertion checking the expected result fails. It is derived that the (cardinality-)minimal fault assumptions that are consistent with our test specification are: {AB(C1 )}, {AB(C7 )}, {AB(C9 )}, and {AB(C12 )}. Hence, the statements in lines 1, 7, 9 and 12 are considered the possible root causes of the symptoms. Any other statement cannot alone explain the incorrect result, since the result remains incorrect even if a statement is altered.
2.1
Issues in MBSD
While the pure MBSD framework is well-suited to carry out complex inferences, its application in practice is limited due to the following factors: Result interpretation: If many explanations are returned, MBSD alone provides little information to discriminate between the different explanations. Here, a mechanism to rank results would be desired.
Different to electronic circuits, where long sequences of e.g. inverters are uncommon, program executions frequently contain long chains of control- and data dependencies, leading to a number of explanations that cannot be distinguished without further observations. For example, the value of the conditional test in line 2 depends on all statements executed in previous iterations. Interactive measurement selection techniques are difficult to apply, since program states in different executions may be incomparable, rendering entropy-based solutions ineffective.Returning a “super component” as explanation is also not viable in general, since the involved statements can span many different program fragments. Therefore, an approach that works with little or no user involvement is desired. Scalability: The application of MBSD has been limited to small programs, since the computational effort exceeds what is considered reasonable for interactive scenarios. Hence, inference processes must be applied selectively to remain efficient. External interfaces: MBSD requires that effects of program fragments can be simulated even if only partial information is available. Programs interacting with external components, such as I/O, files and GUIs, must be modified to either remove these interactions or provide placeholder implementations. The first two issues can be addressed by introducing a mechanism to estimate, for each component C in the model, how likely it is that C contains a fault. The third issue is common to most program analysis techniques and is beyond the scope of this paper. Assuming a suitable measure is available, ranking of results based on fault probability and investigating different explanations in best-first order rather than computing all explanations at once are straight forward. Since a priori probabilities are typically not directly available, other means to determine a suitable likelihood value must be used. The aim of this paper is to show that correlation between the execution patterns of statements with correct and failed executions can significantly improve diagnosis results. The following section outlines our approach to assessing the similarity between different program executions and test outcomes. Since MBSD does not usually exploit correct program executions in any way, this approach can contribute valuable information to guide the model-based framework.
3
Spectrum-based Fault Localisation
When more than one test case are available, dynamic program analysis techniques have shown that comparing the program behaviour over multiple test runs can indicate which program components may be likely to contribute to an observed symptom. In the following, we assume that a program P comprises a set of M = |C| components (statements in the context of this paper) and is executed using N = |T | test cases that either pass of fail. Program (component) activity is recorded in terms of program spectra [1; 8]. This data is collected at run-time, and
M components o11 o21 . .. oN 1 N spectra
o12 o22 .. . oN 2
. . . o1M . . . o2M .. .. . . . . . oN M
error vector e1 e2 .. . eN
For each component the Ochiai similarity sj is given below the matrix. For C3 , the similarity coefficient s3 is 0.63: as can be seen from the third column in the matrix, there are two failing test runs where C3 is executed (a11 (3) = 2), no failing run where C3 does not participate (a01 (3) = 0), and three successful executions where C3 is involved (a10 (3) = 3). C6 , C7 and C9 are considered to be most closely correlated with failing tests and should be examined first. Conversely, C4 is not considered relevant at all.
Figure 2: Participation Matrix O typically consists of a number of counters or flags for the different components of a program. We use the so-called hit spectra that indicate whether a component was involved in a (test) run or not. Both spectra and pass/fail information is input to a spectrumbased fault localisation (SFL) mechanism. The combined information is expressed in terms of the N × (M + 1) participation matrix O (see Figure 2). An element oij is equal to 1 if component j took part in the execution of test run i, and 0 otherwise. The rightmost column of O, the error vector e, represents the test outcome. The element ei = oi,m+1 is equal to 1 if run i failed, and 0 if run i passed. For j ≤ M , the row Oi∗ indicates whether a component was executed in run i, whereas the column O∗j indicates in which runs component j was involved. In SFL one measures the similarity between the error vector e and the activity profile vector O∗j for each component j. This similarity is quantified by a similarity coefficient, expressed in terms of four counters apq (j) that count the number of positions in which O∗j and e contain respective values p and q; that is, for p, q ∈ {0, 1}, we define apq (j) = |{i | oij = p ∧ ei = q}|. In this paper, the Ochiai similarity coefficient is used, known from molecular biology, since previous investigations have identified it as the best coefficient to be used for SFL [1]. It is defined as a11 (j) sj = p (a11 (j) + a01 (j)) ∗ (a11 (j) + a10 (j)) The similarity coefficient sj associated with each component Cj indicates the correlation between the executions of Cj and the observed incorrect program behaviour. Applying the hypothesis that closely correlated components are more likely to be relevant to an observed misbehaviour, sj can be reinterpreted as “fault probability” and components can be ranked. Example 6 Executing the program in Figure 1 using the test case described in Example 1, the first row vector in the participation matrix below is obtained: The vector contains a single 0 entry, indicating that all components but C4 are executed. Since the returned value does not match the anticipated result, the entry in the error vector is set to 1. Assume that further tests are executed to yield the following participation matrix: 2 C1 1 6 1 6 6 1 6 1 6 4 1 1
C2 1 1 1 1 1 1
C3 1 0 1 1 1 1
C4 0 0 1 1 0 0
C6 1 0 0 1 1 1
C7 1 0 0 1 1 1
C9 1 0 0 1 1 1
C12 1 1 0 0 1 0
0.58 0.58 0.63 0.00 0.71 0.71 0.71 0.58
˛ ˛ ˛ ˛ ˛ ˛ ˛ ˛ ˛ ˛ ˛
e 1 0 0 0 0 1
3 7 7 7 7 7 5
Recent studies on spectra-based fault localisation indicated that this scheme is effective even for small test suites containing only few test cases [1]. For the programs investigated here, good fault localisation was achieved when using six failing test cases and twenty passing runs.
4
Spectra-Enhanced MBSD
As SFL functions without a semantic model of the program, the technique is easily applied. Experiments with different similarity measures have shown that Ochiai similarity generally outperforms other spectra-based indicators and can give good hints on the location of a fault in a program [1]. At the same time, the absence of a model also limits the accuracy of fault localisation. Even for comprehensive test suites, the execution patterns of some components may not be distinguishable, and faulty components may show erroneous behaviour only in particular execution contexts. As a result, the similarity measure may implicate unrelated program fragments. Conversely, the model-based technique captures the semantics of programming constructs, but does not assign ranking information to candidate explanations. Furthermore, modelbased diagnosis traditionally only considers discrepancies, but does not utilise correct test cases, although all failing test cases will be considered. In contrast, spectra-based methods exploit both correct and failing test runs to rank candidates. Hence, both techniques complement each other. Algorithm 1 outlines our combined approach. The algorithm executes in three stages, with the similarity-based approach used in the setup stage (steps 1 to 5), feeding into the subsequent model-based filtering stage (steps 6 to 16), followed by an optional best-first search stage (lines 17 to 24). This combination has significantly lower resource requirements than applying MBSD on the whole program but using SFL only to rank results. We start by partitioning the program P into a set of components C and execute P on the available test cases T to obtain the participation matrix M. Using M, we partition T into passing tests (TP ) and failing ones (TF ). From M, the Ochiai similarity vector is computed; its values are subsequently assigned to components as a-priori fault probabilities to yield the component list Cb sorted by fault probability.2 In the subsequent loop, candidate explanations are computed using the MBSD approach to isolate the most likely explanations based on Cb and TF . While it is possible to apply MBSD once to compute all explanations and present the ranked candidates to the user, an incremental strategy permits 2
We use the term probability as synonym for likelihood to be incorrect. Our measure does not necessarily conform to the laws of probability theory.
Algorithm 1 Spectra-Enhanced MBSD Algorithm Inputs: Program P, set of test cases T Output: Fault assumptions explaining failed test runs 1 2 3 4 5 6 7 8 9 10 11 12 13 14 15
C ← C REATE C OMPONENTS(P ) M ← G ET C OMPONENT M ATRIX(C, T ) hTP , TF i ← T S ← C OMPUTE S IMILARITY(M) Cb ← A SSIGN C OMPONENT P ROBABILITIES(C, S) t←1+� R ← Cb repeat b TF , t) D ← MBSD(C, if Dbug ∈ D is confirmed then return Dbug else t ← P ROBABILITY(D) for some D ∈ D end if [ R←R\ C OMPS(D) D∈D
16 until D = ∅ or t = 0 17 while R 6= ∅ do 18 C ← arg max P ROBABILITY(C) C∈R ∧ ∃N ∈N EIGHBOURS(C):N ∈R /
19 if C is confirmed faulty then 20 return {AB(C)} . Partial explanation 21 end if 22 R ← R ∪ (N EIGHBOURS(C) ∩ R) \ {C} 23 end while 24 return No explanation found
the algorithm to stop early once a fault has been identified. In each iteration, the user is presented a number of candidate explanations for examination. If the actual fault has been located, the algorithm stops; otherwise, none of the candidates represent valid explanations and other candidates must be generated. The algorithm stops once no more explanations could be found or if none of the remaining components was executed for a failing test. We modified the basic MBSD algorithm to return only the explanations with probability p less than a given threshold t, with the additional restriction that p is maximal among the returned diagnoses. Hence, only explanations with the same likelihood are returned in an iteration of Algorithm 1. Initially, t is set to a value slightly larger than 1 (the Ochiai similarity is always ≤ 1), hence candidate explanations with maximum likelihood are enumerated first. By decreasing t in each iteration, lower-scoring alternatives are explored if no higher-scoring candidate has been confirmed by the user. Our implementation of MBSD caches intermediate models and conflicts to avoid repeated computations. If no explanation is found after all components implicated by MBSD have been explored, we employ a best-first search procedure that traverses the program along dependencies between components with decreasing fault probability. No explanation may be found if a fault in the program has larger cardinality than the MBSD threshold or if the fault affects component inter-dependencies such that the fault assumptions
and model abstraction can no longer represent the fault. Function N EIGHBOURS (C) returns the set of components that are directly connected to C in P, C OMPS(D) returns the set of components that occur in diagnosis D, and P ROBABILITY(C) returns the fault probability assigned to component C by SFL. In line 18, the component with maximum fault probability that is connected to a previously explored component is selected. If the component is confirmed to be (part of) a valid explanation, the search stops and the diagnosis is returned. Note that the explanation may only cover part of the true fault. Line 24 in Algorithm 1 can only be reached if the faulty program fragment is not covered by any component, or if the user oracle that decides whether an explanation is indeed a satisficing explanation is imperfect and may miss a fault. We employ the common assumptions that components may fail independently. While faults in a statement can imply failure in subsequent statements due to data dependencies, this need not be true in general; since most faults in our test suite are confined to a single component and only few statements occur where implied faults are possible, this assumption has not significantly affected the outcomes of our study. Also, since fault probabilities are estimated from correlation with failing tests, different components participating in the same failure will be assigned higher similarity, partially compensating for missed component fault interactions. Example 7 Applying Algorithm 1 using the test suite from Example 6, {AB(C7 )} and {AB(C9 )} form the set of candidate explanations. Both candidates are associated with the highest similarity coefficient 0.71. Notably, this result improves upon both individual fault localisation procedures. Different from pure SFL, {AB(C6 )} is no longer considered an explanation. Conversely, candidates {AB(C1 )} and {AB(C12 )} obtained using pure MBSD are low-ranking in SFL and hence omitted at this stage. (AB(C12 ) is already eliminated by pure MBSD when using the second failing test case introduced in Example 6.) Without further information, neither approach can discriminate between the two remaining candidate explanations. Since it is assumed that the user acts as oracle that can reliably recognise true faults, the algorithm stops after the first iteration, once the statement in Figure 1 corresponding to {AB(C9 )} has been confirmed to be incorrect. Otherwise, the diagnosis threshold t would be set to 0.71 and the algorithm would continue to present {AB(C1 )} as the (last) remaining alternative explanation. The use of similarity measures to guide diagnosis can potentially lead to considerable savings; moreover, the behaviour of Algorithm 1 degrades gracefully if components with high probability do not actually correspond to faults. In the worst case, the number of diagnoses to be examined by the user is the same as when using the non-guided MBSD strategy. In the next section we evaluate our algorithm on a larger test suite.
5
Empirical Evaluation
To gain a better understanding of the combined approach, the TCAS program was taken from the Siemens Test Suite3 , a test 3
http://www-static.cc.gatech.edu/... .../aristotle/Tools/subjects/
where Di represents the ith -ranked candidate explanation, S TMNTS is a function that returns the set of program statements covered by the components in a diagnosis, and |P| denotes the number of statements in the program. Otherwise, if Algorithm 1 stops without locating the true fault, the breadthfirst search procedure is invoked starting with all implicated statements [ S TMNTS(D) b F ,1+�) D∈MBSD(C,T
to obtain q as outlined previously.
5.1
Experimental Results
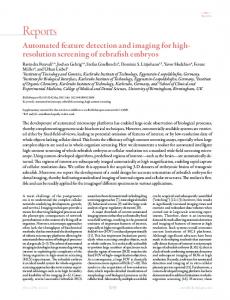
Results for the individual approaches have already been published elsewhere; an evaluation of MBSD is presented in [13], where an interval abstraction is applied to yield, on average, nine statements to be inspected. The median quality indicator is 0.87. The results obtained with SLF are discussed in [1]. Exploring the program beginning with the highest-ranked statement, the true fault is located after 28 statements have been examined on average. The resulting median report quality is 0.86. Figures 3 and 4 summarise the overall outcomes. To obtain a first impression how well the two approaches complement each other, Figure 3 contrasts the components implicated by either model with those blamed by both. It can be seen that the AIM significantly reduces the number of components, and that neither model subsumes the other.
60
MBSD only
SFL only
10
20
30
40
50
both
1 2 3 4 5 6 7 8 9 10 11 12 13 14 15 16 17 18 19 20 21 22 23 24 25 26 27 28 29 30 31 32 33 34 35 36 37 38 39 40 41
0
bench commonly used in the debugging community. The program simulates the resolution-advisory component of a collision avoidance system similar to those found in commercial aircraft. The program consists of 138 lines of C code and takes twelve parameters as input; the numeric result value encodes one out of three possible resolution advisories. The program is equipped with 1608 test cases and 41 different variants with known faults. For each variant, on average, forty test cases reveal a fault. In our experiments, all available test cases were used. As the efficiency of debugging in practice often depends on the experience of the software developer, comparing different approaches is difficult. In particular, simple precision and recall-based evaluation may be insufficient, since the structure of a program is not taken into account. In an attempt to devise an objective measure to assess the quality of automated debugging aids, a quality metric that exploits dependencies within a program has been proposed, where the quality of a report depends on the fraction of a program that need not be examined given the debugging tool’s output. Starting with the program elements implicated by an automated debugger, dependencies between program elements are traversed in breadth-first order until the fault has been reached. This strategy aims to mimic programmer behaviour, where possible influences along control- and data flow paths are explored. The fraction of the program that has not been traversed leads to the quality indicator [18]. In our framework, if the explanation covering the true fault is ranked nth among the candidate explanations, the fraction of the program that is traversed is given by Pn |S TMNTS(Di )| , q = i=1 |P|
Figure 3: Components implicated by SFL and MBSD Restricting the debugging process to those statements that appear in both models, the median number of statements reduces from 36 to 8. Hence, the total number of statements considered relevant reduces considerably when using the combined approach. Similar improvements can be observed in the ranking of components. Using the pure SFL approach one hits the true fault after inspecting twenty statements on average, but many unrelated statements must be examined. When using MBSD as filtering mechanism, the true fault is located after seven statements on average. Hence, the model-based filtering mechanism seems well-suited to prune away irrelevant components from the SFL fault profiles. The improved accuracy of the combined approach also reflects in much improved quality indicators. Figure 4 depicts the quality measure obtained for the individual 41 test programs using our fault localisation approaches. It is observed that the combined approach largely outperforms the individual techniques. In some cases, SFL outperforms the combined approach, suggesting that the model used in MBSD may not be able to accurately reflect the fault. This difference may also be attributed to the execution of some faulty code correlating well with the failing test cases. If the MBSD part of our algorithm cannot precisely locate the fault, the SFL method can score higher. So far, we have not been able to devise heuristics that can consistently predict this discrepancy from the a-priori component probabilities and diagnoses to further improve accuracy. Since both approaches use heuristics to rank candidates, it may be the case that one method outperforms the combination on individual candidates, even though it is superior overall. Overall, the fraction of the program that must be inspected reduces from 13% and 30%, respectively, to 8%. Although MBSD alone is not able to locate faults for 9 of the 41 programs (due to limitations on faults in global variable initialisation in our current implementation), the overall performance of the combined approach does not seem to be adversely affected in most cases. This can be explained by two observations: (i) the number of diagnoses that are implicated in those cases is small (4 on average), and (ii) the suspect program fragments are close to the actual faults when navigating the program structure.
30 20 15 0
5
SFL MBSD SFL+MBSD Top6
10
Number of located bugs
25
0.65 0.70 0.75 0.80 0.85 0.90 0.95 1.00
q value
NN Sober SFL+MBSD
TCAS Variants
[0,
[ [ [ [ [ [ [ [ [ 10 10,2 20,3 30,4 40,5 50,6 60,7 70,8 80,9 90,1 ) 0) 0) 0) 0) 0) 0) 0) 0) 00
]
Figure 4: Report quality
Percentage of inspected code
Figure 5: Debugging efficiency We also evaluated a modified version of Algorithm 1, where the MBSD section is stopped after the six4 most highly ranked components have been explored; the remaining components were subsequently explored using the best-first part of our algorithm. The resulting quality indicators are labelled Top6 in Figure 4. The results indicate that the components implicated by the combined approach sometimes narrowly miss the true faults; in these cases, the score measure improves compared to the combined approach. In other cases, following the original algorithm is more successful. Overall, the quality indicators do not differ significantly between the two models. Investigating whether heuristics can be developed that choose a cutoff to improve accuracy remains for future work. Figure 5 visualises the number of located bugs for different fractions of inspected code. Our approach vastly outperforms the simple spectrum-based fault localisation techniques proposed in [18], where different combinations of union and intersection of “similar” passing and failing test runs are computed. This can be attributed to the improved ranking mechanisms built into our algorithm that is more robust with respect to overlapping passing and failing executions. Our combined approach also improves with respect to SOBER [10], a statistical approach based on hypothesis testing that has been shown to dominate other recent bug detectors. Delta slicing and explain [7] are two techniques for fault localisation that exploit differences between passing and failing abstract program executions traces found by a model checker. Comparing our results to the published results in [7], we conclude that the combination of SFL and MBSD is far superior than explain (which requires the user to explore 24–64% of a program) and performs competitive with respect to Delta Slicing (within 5%). Interestingly, when using the cutoff variant of or our algorithm described in Figure 4, our approach also dominates Delta Slicing. (This comparison is not exhaustive, since results for only a small subset of the examples considered in our study is available for the competing approaches.) 4 This cutoff seemed to have the best overall effect for an extended test suite used in [1].
6
Related Work
Several systems employing dynamic analysis techniques for fault localisation are present in the literature. Tarantula [8] obtains program spectra from test case executions and graphically visualises the fault proneness indicator based on participation of individual statements in passing and failing runs. Tarantula does not exploit information about the anticipated behaviour of a program and hence relies on external tools to assess the outcome of test runs. Machine learning techniques have been applied to programs [21] and their executions [15] to infer likely invariants that must hold at particular locations in a program. Violations can subsequently be used to detect potential errors. Modelbased approaches have been shown to provide more reliable behaviour than [15], since success of the trace analysis depends much on the test runs and type of invariants to be inferred [9]. The static program analysis approach requires that similar patterns appear repeatedly in a program, but is not applicable when common patterns are not easily identified. Combining program execution and symbolic evaluation has been proposed to infer possible errors [5]. Similar to MBSD, a symbolic, under-constrained representation of a program execution and memory structures are built. Instead of using fault probabilities to guide diagnosis, only those candidate explanations that definitively imply a test failure are flagged. Hence, the tool complements our approach by highlighting a subset of all provable faults in a program, while our approach aims at identifying those program fragments that may contribute to a fault. Model-based debugging has been explored using a variety of different abstractions of concrete programs [12]. Recently, similar techniques have also been proposed to isolate specific faults stemming from incorrect implementation of high-level conceptual models [22]. Mutations applied to state machine models allow to detect conceptual errors, such as incorrect control flow and missing or additional features found in the implementation compared to its specification. Model-based test generation [6] from abstract specifications of systems
employs a similar idea where possible faults manifested as differences in abstract state machines are analysed to generate tests. Our work differs in that we are concerned with program representations that more closely reflect the actual program artefact to locate faults at a more detailed level. While initial steps to integrate similar conceptual abstract models have been undertaken in an attempt to isolate “structural” faults [11], detailed analysis remains future work. Diagnosis and repair in the context of distributed systems composed from Web Services has also been investigated [20]. In particular, diagnosability and analysis of diagnosis and repair plans are central parts of this work. Similar ideas are in principle applicable in the debugging context, but further work is required to devise a suitable analysis framework that can operate on the more implementation-centric view employed in this work.
7
References
[2]
[3]
[4] [5]
[6]
[8]
[9]
[10]
[11]
Conclusions & Future Work
We have shown that the accuracy of model-based debugging increases significantly when applied in combination with complementary approaches that estimate fault probabilities. The unique combination of semantics-based analysis as undertaken in MBSD and dynamic aspects obtained from program execution spectra has proved to focus debugging efforts; overall, a reduction of user effort to less than 10% compared to the complete program has been achieved on our test suite. We have further shown that our approach is among the state of the art automated debugging tools. Several issues for further research remain: On the MBSD side, connecting the lower-level models that reflect the program to high-level conceptual models to detect a more diverse set of faults seems promising to address current limitations. The same idea may be useful to aid model selection and focus fault assumptions. On the dynamic analysis side, introducing machine learning techniques to infer likely invariants that can then be used to further filter and guide the MBSD modelling efforts are possible avenues worth further exploration.
[1]
[7]
Rui Abreu, Peter Zoeteweij, and Arjan J. C. van Gemund. On the accuracy of spectrum-based fault localization. In TAIC PART’07, pages 89–98. IEEE, 2007. Thomas Ball and Sriram K. Rajamani. The SLAM project: debugging system software via static analysis. In POPL, pages 1–3, 2002. Claudia B¨ottcher. No faults in structure? How to diagnose hidden interaction. In Proc. 14th IJCAI, pages 1728–1735, 1995. Ian F. Darwin. Checking C programs with lint. O’Reilly & Associates, Inc., 1986. Dawson R. Engler and Daniel Dunbar. Underconstrained execution: making automatic code destruction easy and scalable. In Proc. ACM ISSTA, pages 1–4. ACM, 2007. Michael Esser and Peter Struss. Automated test generation from models based on functional software specifications. In Proc. 20th IJCAI, pages 2255–2268, 2007.
[12]
[13]
[14]
[15]
[16]
[17] [18]
[19]
[20]
[21] [22]
[23]
Alex Groce, Sagar Chaki, Daniel Kroening, and Ofer Strichman. Error explanation with distance metrics. STTT, 8(3):229–247, 2006. James A. Jones and Mary Jean Harrold. Empirical evaluation of the tarantula automatic fault-localization technique. In ASE, pages 273–282. ACM Press, 2005. Daniel K¨ob and Franz Wotawa. A comparison of fault explanation and localization. In Proc. DX’05 Workshop, pages 157–162, 2005. Chao Liu, Xifeng Yan, Long Fei, Jiawei Han, and Samuel P. Midkiff. SOBER: statistical model-based bug localization. In ESEC/SIGSOFT FSE, pages 286–295. ACM, 2005. Wolfgang Mayer. Static and Hybrid Analysis in Modelbased Debugging. PhD thesis, School of Computer and Information Science, University of South Australia, 2007. Wolfgang Mayer and Markus Stumptner. Model-based debugging - state of the art and future challenges. ENTCS, 171:61–82, 2007. Wolfgang Mayer and Markus Stumptner. Models and tradeoffs in model-based debugging. In Proc. DX’07, 2007. Madanlal Musuvathi and Dawson R. Engler. Some lessons from using static analysis and software model checking for bug finding. ENTCS, 89(3), 2003. Jeremy W. Nimmer and Michael D. Ernst. Static verification of dynamically detected program invariants: Integrating Daikon and ESC/Java. In Proc. RV’01, 2001. Hsin Pan and Eugene H. Spafford. Heuristics for automatic localization of software faults. Technical report, Purdue University, 1992. Raymond Reiter. A theory of diagnosis from first principles. Artificial Intelligence, 32(1):57–95, 1987. Manos Renieris and Steven P. Reiss. Fault localization with nearest neighbor queries. In ASE’03, pages 30–39. IEEE, 2003. RTI. Planning report 02-3: The economic impacts of inadequate infrastructure for software testing. Planning Report 02-3, NIST, 2002. WSDIAMOND. WS-Diamond deliverable D5.1: Characterization of diagnosability and repairability for selfhealing web services. Technical Report IST-516933, University of Torino and others, 2007. Yichen Xie and Dawson R. Engler. Using redundancies to find errors. IEEE TSE, 29(10):915–928, 2003. Cemal Yilmaz and Clay Williams. An automated modelbased debugging approach. In ASE, pages 174–183. ACM Press, 2007. Peter Zoeteweij, Rui Abreu, Rob Golsteijn, and A. J. C. van Gemund. Diagnosis of embedded software using program spectra. In Proc. ECBS’07. IEEE, 2007.