Priority Based Routing for Forest Fire Monitoring in Wireless Sensor Network
Paper
Takuma Koga, Kentaroh Toyoda, and Iwao Sasase Department of Information and Computer Science, Keio University, Yokohama, Japan Abstract—Recently, forest fire monitoring system in wireless sensor networks has received much attention. The conventional scheme receives fire alert data quickly to inform about fire forest event. However, since two or more nodes may detect a fire, high priority fire detection data frequently collide. In this paper, a new forest fire monitoring system is proposed in order to reduce high priority fire detection data dropped rate, by specifying a high priority received data immediately after fire detection and just before the destruction by fire. Furthermore, the node only transmits high priority data to a node, which has a low possibility of destruction by fire for low end-to-end delay of high priority fire detection data. The simulation results show that proposed scheme can reduce high priority data dropped ratio and the end-to-end delay, and have less effect of wind direction compared with the conventional scheme. Keywords—event detection, forest fire, priority, routing, wind.
1. Introduction The forest fire is a serious problem in the world: it is reported that as many as 66,343 wildfires occurred and burned 6,319,586 acres in the USA in 2013 [1]. Currently a satellite-based monitoring is a popular method to detect forest fire [2]. A satellite sends short or medium infrared wavelength images with 500 m resolution per day. These images are analyzed of reflectance and brightness corresponding to burning and non-burning pixels. However, because of long scan period and poor resolution the initial phase of fire forest can be missed [3]. Although there are other fire forest detection schemes, e.g., using a digital camera [4], a long-wave infrared camera [5] or sensors with four propellers [6], they cannot be used in a large areas due to the high cost. Nowadays, it is expected to use Wireless Sensor Networks (WSNs) for the forest fire event detection by periodically sensing the temperature, humidity and light in whole forest area. In WSN, the sink node (data collector) gathers information from many sensor nodes [7]. They are expected to work with limited energy for a long time period because they are small and lightweight. After obtaining environmental data, sensors apply the processing algorithm such as neural network to detect and forecast fire [8]. In forest fire monitoring, the fact that nodes might burn down when the fire breaks out have to be considered. Although there are many routing protocols, e.g., Leach [9], 90
PEGASIS [10], Teen [11], PEQ [12], none of them considers the case when some nodes are burned down. As a consequence of the fire event, the path between sensor nodes and data collector may be unavailable. In order to overcome this path failure, the unrecoverable path to the data collector causes unnecessary delay. It is also necessary to the utilize power energy from nodes which will be destroyed by fire. Ansar et al. propose Maximise Unsafe Path routing protocol (MUP) [13] that maximizes the utilization of nodes that are going to fail sooner, in order to save power in the others. Although MUP selects nodes that must be in a dangerous area, many data are buffered. Thus, superfluous data concentration causes possibility of its loss by node burn before sending whole information. Moreover, MUP loses the high priority data, e.g., when a fire event is first detected reference, because MUP does not manage the priority of each fire alert data. Thus, it causes significant packets loss. In this paper, two methods to achieve a lower dropped data packets ratio and smaller end-to-end delay is proposed. The first one is to limit attaching the highest priority only to truly urgent events, e.g., when a node detects a fire. The second one is to change the routing methodology. In presented scheme, high priority nodes transmit data to more survival node, while lower priority nodes transmit data to less survival node. In addition, the authors send high priority data ahead of low priority for low dropped ratio and delay. In order to show the effectiveness of proposed schemes, they are compared with MUP by evaluating the dropped rate and end-to-end delay of high priority data through computational simulation. Two environmental situations are considered. The first case is without wind, and the other one is with wind. The authors show that presented scheme can improve both of dropped ratio and end-to-end delay, and have less effect of wind. The remaining of the paper is structured as follows: related work is described in Section 2. The conventional MUP is presented in Section 3. Section 4 explains the network configuration and forest fire scenario used in the simulation. Simulation results and analysis are discussed in Section 5. The paper ends with conclusions in Section 6.
2. Related Work There are many fire forest-specific routing protocols. Environmental Monitoring Aware routing (EMA) [14] and
Priority Based Routing for Forest Fire Monitoring in Wireless Sensor Network
Delay-bounded Robust Routing protocol (DRR) [15] are proposed as path predictable methods in a fire event. In EMA, when nodes detect a fire, they send information to the data collector and then it informs every node in the network of the fire event. Therefore, only the safe nodes relay fire alert data to the sink. However, node state information might quickly become antiquated since the fire spreads very fast. On the other hand, DRR sends fire alert data and only uses more survivable nodes by leveraging neighbor node’s state. Thus, DRR achieves better-dropped data ratio and delay. However, DRR does not consider network lifetime. Therefore, MUP [13] has been proposed. MUP extends the network lifetime by making the most of unsafe state nodes, which have detected fire and will be burned sooner or later. Moreover, it is important to know the forest fire shape in order to fight a fire. Yuanyuan et al. proposed a reliable wildfire monitoring system based on WSN [16]. In this system, fire-detecting nodes periodically send data including temperature to know fire point certainly. Serna et al. proposed method to obtain an approximation of the fire shape by analizing the data of WSN [17]. Fire spreads in response to the wind influence and a strong wind accelerates fire spreading. Since sensor nodes have to monitor in case of fire, how fast fire spreads by wind is important to be evaluated in the simulation. Kim develops a flame spread velocity model by testing fuel combustion and flame characteristics, and research about fire spreading with wind [18].
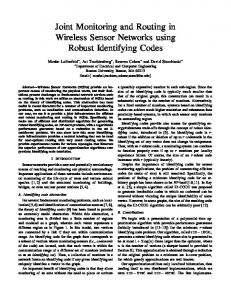
In MUP, whenever a node detects temperature higher than a threshold, it changes its state. Figure 1 shows a node health status example versus measured temperature. Nodes always have safe status in normal situation. If a node detects fire and when the temperature increases above threshold T1 = 60◦ C, its health status changes to almost-failed when the temperature reaches T2 = 100◦ C. The node is considered totally burnt (failed) when the temperature reaches T3 = 130◦C, which is the maximum possible operating temperature. Nodes change state low safe from safe when a neighbor located one-hop away from the node-detected fire. All nodes send routing management messages including its own health state periodically. 3.1. Data Flow During fire forest monitoring in WSN, nodes send measured data to the gathering host (sink) by relaying to other network nodes. Normally, all nodes periodically send data to the host at long interval e.g. 100 s. But, when nodes detect fire, the interval is much shorter e.g. 10 s. If a node detects a fire, it changes its parent. MUP selects a parent node that must be in dangerous area in order to utilize its energy before being burnt in the fire. If one node has the lowest hop to the sink, then it will be selected as the parent. However, if there is more than one node, the mechanism considers the node’s health status in the following order: unsafe, low safe and safe. The decision algorithm can be simplified as follows:
3. Conventional MUP Method
– nodes search the node with the lowest hop to the sink,
MUP selects nodes, which are going to be burnt earlier as forwarding nodes, in order to save the other nodes energy. MUP defines each node five levels of health status:
– if there is more than one node, then selects the node according to these health statuses in the following order: unsafe, low safe, and safe.
• safe – initial stage and while there is no fire, • low safe – one-hop away from a detected fire, • unsafe – fire detected,
The almost-failed nodes are excluded from forwarding candidates to avoid broken paths due to failures. However, the routing mechanism selects them as the parent if there are almost-failed nodes only. Figure 2 shows an example of
• almost-failed – just about to be destroyed, sink safe low safe unsafe almost-failed failed transmitting directions candidate of transmitting direction
Temperature [o]
• dead – destroyed by fire or battery discharged.
T3
Failed
T2
Almost-failed
T1
Unsafe
Position by the hop number to the sink
Fig. 2. Destination node selection without fire. Safe 0
Time [s]
Fig. 1. Change state of detecting fire nodes.
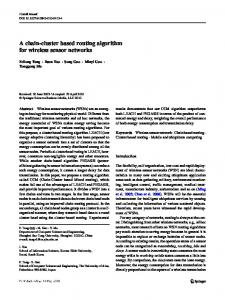
the way the MUP algorithm changes the routing tree of the network when nodes have detected fire and then be burnt. Figure 3 shows that MUP can utilize the energy of node K which will be burnt. 91
Takuma Koga, Kentaroh Toyoda, and Iwao Sasase
sink safe low safe unsafe almost-failed failed transmitting directions candidate of transmitting direction
K
Position by the hop number to the sink
Fig. 3. Destination node selection with unsafe nodes.
3.2. Problem in MUP Although MUP selects a node that must be in a dangerous area, many data are accumulated in its buffer. Thus, data overconcentration causes possibility of loss, while node is burnt before sending all information. At the same time, high priority alert data can be dropped because MUP does not consider the each alert data priority. Figure 4 shows an (a)
K
M
E
G
sink safe low safe unsafe almost-failed failed transmitting directions candidate of transmitting direction
(b)
K
Fig. 4. Example of dropped high priority data: (a) the real position, (b) position by the hop number to the sink.
example of dropped high priority data. In Fig. 4, fire diffusion around node. Nodes J, L, Q, R and S select node K as their parent and then send high priority fire detection data. These high priority data may be dropped in node K due to the superfluous data concentration with fire.
4. Proposed Method To avoid data losses to send high priority data to more survivable nodes in order to reduce dropped rate of high priority fire detection data is proposed. The high priority 92
is set only after fire detection and just before destruction by fire. Furthermore, nodes send most important data ahead of low priority data to improve dropped ratio and delay. This can be executed by sorting the buffer content. 4.1. Priority Fire Detection Data The proposed method attempts to select a parent node depending on the priority of alert data. The almost failed nodes are removed from forwarding node candidates in order to avoid broken paths due to failures. Therefore, the three levels of priority were set to alert data depending on three node status (unsafe, low safe and safe). The highest priority 3 is the most important alert data when each node detects fire since fire detection in an early stage. The priority 2 was set with a probability P1 for the fire detection data to be dropped, and priority 1 with a probability 1 − P1 in order to avoid excessive increase of high priority data. And furthermore, the priority 2 was set to the alert data of changing state to almost-dead, because the node may not generate any more data by the destruction. Similarly, the priority 2 was set to the alert data of changing state to almost-dead in order to avoid an excessive increase of the highest priority information. 4.2. Parent Election To avoid all priority data concentrated on a specific node high priority data is sent to a node far from the fire. All nodes inform about their health state in time, and each node recognizes neighbor node’s state. Table 1 shows the parent election depending on the priority of alert data. Each node checks the neighbors’ state with fewer numbers of hops to the sink than itself in order shown in Table 1. When an applicable node is found, the node transmits data to him. If there is no candidate, the node looks up the routing table and finds the parent candidate who is as far as or further than itself. Table 1 The parent election depending on the priority of alert data Order
Priority 1
Priority 2
Priority 3
1
Unsafe
Low safe
Safe
2
Low safe
Safe
Low safe
3
Safe
Unsafe
Unsafe
4
Almost-dead
Almost-dead
Almost-dead
For example, when a node has three hops to the sink but only has neighbor nodes with four hops, it selects a node with four hops to the sink in order shown in Table 1. When a node transmits the priority 3 data, each node checks state of neighbor nodes in turn from the safe state to almostdead. Then the node who has data of priority 2 checks in turn from the low safe state to almost-dead state. Therefore, the dropped ratio of the priority 2 data gets lowered and priority 2 data go through the different path. Furthermore,
Priority Based Routing for Forest Fire Monitoring in Wireless Sensor Network
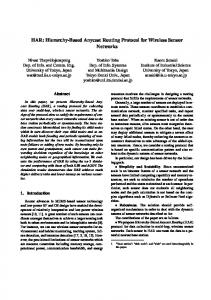
each node has the fire detection priority 1 data checks in turn from the unsafe state to almost-dead state. Thus the energy could be utilized before it is lost on fire. Figure 5 shows transmission of priority 2 data on fire detection. In Fig. 5, priority 2 data concentrate node B whose state is low safe according to the Table 1. However, low safe nodes can send more data than unsafe state nodes because of more time until being burnt by fire. Furthermore, low safe state nodes have high possibility of destruction by fire, so its energy could be utilized before it melts down. (a) sink safe low safe unsafe almost-failed failed transmitting directions candidate of transmitting direction
K
(b)
K
Fig. 5. Data transmission of priority 2 data of fire detection: (a) real position, (b) position by the hop number to the sink.
data generated by alive nodes. Similarly, the MUP performance with priority and with sort are evaluated to show its effectiveness by considering priority or sort data in MUP method. MUP with priority means the combination of node health status by MUP and proposed parent selection. In other words, it is equivalent to the proposed method without sorting buffer. MUP with sort means the combination of MUP parent selection and proposed data sort method. Table 2 Simulation specifications Number of sensing nodes Distance between nodes Node arrangement Number of sink nodes Fire spread speed Time interval between fire alarm data Wind directions Wind speed Node status P1 Bit rate Data size Priority of fire alarm data Tx power consumption Rx power consumption Power consumption on idle state Power consumption on sleep state Simulation tool (language)
100 (10 · 10) 100 m Grid 1 5 m/s 10 s 9 directions 2 m/s 5 levels 0.2, 0.4, 0.6, 0.8, 1 256 kb/s 2560 B 3 levels 345 mW 260 mW 13 mW 0.19 mW C
4.3. Sort in Buffer Data in the buffer are rearranged to send high priority data ahead of low priority. Therefore, they reach the sink early. Moreover, dropped data ratio (DDR) decreases by transmitting high priority data before fire spreading.
5. Performance Evaluation
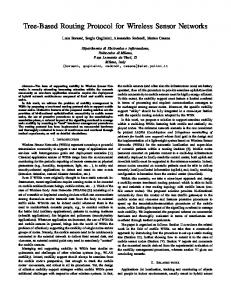
Table 2 shows the used simulation parameters based on [13], [18]. Figure 6 shows a simulation topology model. In presented model, initial fire randomly occurs from the node except the sink and spread towards 40% of the network. The authors consider two fire-spread situation: with and without wind. When no wind situation, fire is diffused concentrically. Fire spreads in the direction of the
5.1. Simulation Model The performance of the conventional and proposed schemes are evaluated in terms of the fire alarm DDR, end-toend delay of fire alarm data, total number of transmitted and received data by detection fire node and total residual energy in survivable nodes after fire. The total number of transmitted and received data by fire detection node are evaluated to show if the proposed method efficiently utilizes the energy before the destruction as much as the conventional method. The authors define DDR as the data coefficient, which are not reached the sink to all
sink node available paths
Fig. 6. Topology model.
93
Takuma Koga, Kentaroh Toyoda, and Iwao Sasase
wind [18], and nodes might be isolated by fire when wind blows to the specific direction. Figure 7 shows that a graph-
40
Dropped data ratio [%]
35
Isolated nodes
MUP MUP with sort MUP with priority proposed
30 25 20 15 10 5
Wind direction 0 Priority 1
sink alive burned down
Fig. 7. Graphical representation of nodes isolated by fire spread.
ical model of nodes isolated by fire spread. The wind blows from right to left and fire spreads this direction. Therefore, upper left nodes will be isolated and cannot send data to the sink via the shortest path. The data of these nodes tend to be dropped or delayed. Figure 8 shows used wind direc-
W5 W4
W6 W7
W3 W8
W2 W1
spreading fire. Figure 9 shows that the proposed scheme and MUP with priority achieve better DDR in all priorities than MUP. The proposed scheme reduces the DDR of priority 2 by 13% and priority 3 by 10% compared to MUP. This is because the proposed method transmits high priority data to more survivable nodes. In MUP with sort, the higher priority data, the better DDR can be achieved. This is because this method sends high priority data ahead of low priority data by sorting the buffer content at each intermediate node. Figure 10 shows the fire alarm DDR versus probability P1 . Figure 10 shows the DDR by averaging the results of all wind directions. The DDR of priority 1 gets decreased as P1 decreases. This is because P1 controls how frequent the priority 1 data is chosen after priority 3 data are sent. On the contrary, the DDR of priority 2 data is increasing as P1 decreases in Fig. 10. Moreover, as P1 decreases, the DDR of priority 2 is more moderately decreased than that of priority 1. This is because data concentration is relaxed as P1 decreases. 35
Dropped data ratio [%]
tions. The nine patterns (WN , W1 , . . . , W8 ) including the no wind (WN ) was used. W2 blows to the sink and W6 blows to the opposite direction. Note that the wind direction and P1 remain unchanged and the wind blows towards only one direction during each trial of the simulation. It is assumed that sensors are deployed so tall as to avoid obstacles, e.g. grass [19].
Priority 3
Fig. 9. Fire alarm dropped data ratio versus data priorities.
Sink
Fig. 8. Wind directions.
Priority 2
30
MUP proposed: P1=1 proposed: P1=0.8 proposed: P1=0.6 proposed: P1=0.4 proposed: P1=0.2
25 20 15 10 5 0 Priority 1
5.2. DDR of Fire Alarm Data Figure 9 shows the fire alarm DDR versus data priorities. The DDR is presented by averaging the results of all wind directions (WN , W1 , . . . , W8 ) and P1 (P1 = 0.2, 0.4, . . . , and 1). Although MUP does not consider fire alarm data priority, the high priority DDR is lower than that of low priority data. This is because priority 3 data is first sent before 94
Priority 2
Priority 3
Fig. 10. Fire alarm versus P1 data priorities.
Figures 11 and 12 show the DDR of priorities 2–3 data per wind directions. It is shown that the proposed method decreases the priority 3 DDR less than 2%, regardless wind directions. This is because the proposed method relays priority 3 data to more survival node before being surrounded by burning down nodes. It is shown from Fig. 11 that
Priority Based Routing for Forest Fire Monitoring in Wireless Sensor Network
nodes are more quickly burnt down when the wind blows towards them. It is shown that the DDR of W4 and W8 are higher than other wind directions. In W4 and W8 directions, fire spread perpendicularly for the direction toward the sink node and more relay nodes which cause missed routing path disconnect tend to be burnt down. Although the ratio of dropped data varies, each scheme is similarly influenced by the effect of wind (Fig. 13). In MUP with priority and with proposed method, data concentration of priority 1 are relaxed.
Dropped data ratio [%]
12 10 8 6 4 2 0 WN W1 W2 W3 W4 W5 W6 W7 W8 MUP
MUP with sort
MUP with priority
proposed
Fig. 11. Priority 3 DDR as a function of wind directions (P1 = 0.4).
30
Figure 14 depicts the delay of fire alarm data as a function of data priority without wind (WN ). Figure 14 shows the delay by averaging the results of all wind directions and P1 = 0.2, 0.4, . . . , and 1. By definition the delay is the time from generating a data in a node to receiving it by the sink. Figure 14 shows that the proposed method
25
18
20 15 10 5 0 MUP
WN W1 W2 W3 W4 W5 W6 W7 W8 MUP with priority proposed MUP with sort
Fig. 12. Priority 2 DDR versus wind directions (P1 = 0.4).
Average end to end delay [s]
Dropped data ratio [%]
35
5.3. Delay of Fire Alert Data
MUP MUP with sort MUP with priority proposed
16 14 12 10 8 6 4 2 0 Priority 1
the DDR of W6 is lowest in the proposed method. The fire spreads slowly toward the sink node with W6 direction and the proposed method with W6 sends high priority data before being surrounded by burning down nodes. Figures 11 and 12 show that proposed method decreases the DDR more than MUP in the case if wind is present. The proposed method sends high priority data before being isolated, as shown in Fig. 7. Figure 13 shows the priority 1 DDR as a function of wind directions. It is shown that the DDR without wind (WN ) is the lowest. With wind present,
achieves better fire alert priority 2 data delay by 38% and priority 3 by 29% than MUP. The high priority data collisions are avoided by parent election of the proposed method. Moreover, the proposed method and MUP with sort is better on priority 1 data delay compared with MUP because each node sends high priority data ahead of low priority. Figure 15 shows delay of fire alarm data ver-
45
Average end-to-end delay [s]
Dropped data ratio [%]
35 25 20 15 10 5
MUP
MUP proposed: P1=1 proposed: P1=0.8 proposed: P1=0.6 proposed: P1=0.4 proposed: P1=0.2
18
30
WN W1 W2 W3 W4 W5 W6 W7 W8 MUP with priority proposed MUP with sort
Fig. 13. Priority 1 DDR versus wind directions (P1 = 0.4).
Priority 3
Fig. 14. Delay of fire alarm data versus data priorities.
40
0
Priority 2
16 14 12 10 8 6 4 2 0 Priority 1
Priority 2
Priority 3
Fig. 15. Delay of fire alarm data versus P1 data priorities.
95
Takuma Koga, Kentaroh Toyoda, and Iwao Sasase
10 9 8 7 6 5 4 3 2 1 0 MUP
WN W1 W2 W3 W4 W5 W6 W7 W8 MUP with sort
MUP with priority
proposed
Fig. 16. Priority 3 data delay versus wind directions (P1 = 0.4).
priority 3 data delay as a function wind directions. The delay of MUP with sort, MUP with priority and proposed method are almost the same and lasts about 6 s. The fire is prevented from spreading to a large area by detecting in about six minutes [20]. Therefore mentioned 6 s delay is enough to detect fire. 5.4. Data Amounts
4400 P1=1
P1=0.8
P1=0.6
P1=0.4
P1=0.2
4200
4000
3800
3600
MUP
Proposed Data received
Data transmitted
Fig. 18. Transmitted and received data by fire detection nodes versus P1 .
data by fire detection nodes versus P1 by averaging the results of all wind directions. It is shown from Fig. 18 that presented scheme achieves same transmitted and received data compared with the conventional scheme.
6. Conclusion
Figure 17 shows the total of transmitted and received data by fire detection nodes without wind by averaging the results of all wind directions and P1 = 0.2, 0.4, . . . , and 1. Transmitted and received data [bytes]
decreases the number of received data by fire detection node compared with MUP. It is also shown that total transmitted and received data in MUP and MUP with sort are almost the same. The reason is that parent selection method of these schemes are the same. The proposed method controls the total transmitted and received data by the fire detection nodes approximately 2% of decrease compared with MUP method. Figure 18 shows the total transmitted and received Transmitted and received data [bytes]
Average end-to-end [s]
sus data priorities changing P1 . It presents the delay by averaging the results of all wind directions. The delays of proposed method with P1 = 1 and P1 = 0.8 are longer than MUP. It is a result of change the order, and each node sends high priority data ahead of low priority. Moreover, these delays are decreasing with P1 because the data concentration is relaxed as P1 decreases. Figure 16 shows
4400 4200 4000 3800
In this paper, a new forest fire monitoring system is proposed to reduce dropped rate of high priority fire detection data, by specifying a high priority on data immediately after fire detection and just before destruction by fire. Furthermore, the node only transmits high priority data to a node, which had low possibility of destruction by fire to achieve low end-to-end delay of high priority fire detection data. The simulation results showed that proposed scheme could reduce dropped rate of high priority data and the end-toend delay, and have less effect of wind compared with the conventional solutions.
3600
Acknowledgements
3400 MUP
MUP with sort Data received
MUP with priority
Proposed
Data transmitted
This work is partly supported by the Grant in Aid for Scientific Research (No. 26420369) from Ministry of Education, Sport, Science and Technology, Japan.
Fig. 17. Transmitted and received data by fire detection nodes.
References It is shown that the proposed scheme achieves more transmitted data by fire detection node than the MUP. The total transmitted and received data of the proposed method is as many as in the MUP method, although the proposed method 96
[1] “National Report of Wildland Fires and Acres Burned by State”, National Interagency Coordination Center [Online]. Available: http://www.predictiveservices.nifc.gov/intelligence/ 2013 Statssumm/fires acres13.pdf
Priority Based Routing for Forest Fire Monitoring in Wireless Sensor Network
[2] Z. Li, S. Nadon, and J. Cihlar, “Satellite-based detection of Canadian boreal forest fires: Development and application of the algorithm”, Int. J. Remote Sensing, vol. 21, no. 16, pp. 3057–3069, 2000. [3] MODIS Web [Online]. Available: http://modis.gsfc.nasa.gov/ [4] A. A. A. Ahmad, “A review on forest fire detection techniques”, Int. J. Distrib. Sensor Netw., vol. 2014, 2014. [5] Y. G. Sahin and T. Ince, “Early forest fire detection system”, Thesis, California Polytechnic State University, Auckland, 2014. [6] K. J. Gill, R. B. Prasetiyol, H. J. Park, S. B. Liml, and Y. D. Eol, “Fire monitoring system based on open map API”, in Proc. 6th Int. Conf. Netw. Comput. Adv. Inform. Manag., Seoul, South Korea, 2010, pp. 600–605. [7] M. Bahrepour, N. Meratnia, and P. Havinga, “Automatic fire detection: A survey from wireless sensor network perspective”, Tech. Rep. TR-CTIT-08-73, Centre for Telematics and Information Technology University of Twente, Enschede, Dec. 2008. [8] L. Yu, N. Wang and X. Meng, “Real-time forest re-detection with wireless sensor networks”, in Proc. Int. Conf. Wirel. Commun., Netw. Mob. Comput. WCNM 2005, Wuhan, China, 2005, vol. 2, pp. 1214–1217. [9] W. Heinzelman, A. Chandrakasan, and H. Balakrishman, “Energyefficient communication protocol for wireless micro sensor networks”, in Proc. 33rd Ann. Hawaii Int. Conf. Sys. Sciences, Maui, Hawaii, USA, 2000. [10] L. Stephanie and C. S. Raghavendra, “PEGASIS: Power-efficient gathering in sensor information systems”, in Proc. Int. Conf. Aerospace Experts, Academics, Military Personnel and Industry Leaders, Big Skay, MT, USA, 2001, vol. 3, no. 3, pp. 1125–1130. [11] A. Manjeshwar and D. P. Agrawal, “TEEN : A Routing protocol for enhanced efficiency in wireless sensor networks”, in Proc. Int. Parall. Distrib. Process. Symp., San Francisco, CA, USA, 2001, pp. 2009–2015. [12] A. Boukerche, R. W. Pazzi, and R. B. Araujo, “Fault-tolerant wireless sensor network routing protocols for the supervision of contextaware physical environments”, J. Parall. Distrib. Comput., vol. 66, no. 4, pp. 586–599, 2006. [13] J. Ansar et al., “Maximise unsafe path routing protocol for forest fire monitoring system using wireless sensor networks”, in Proc. 3rd Int. Conf. Netw. Embedd. Syst. Every Appl. NESEA 2012, Liverpool, UK, 2012, pp. 1–8. [14] B.-L. Wenning, D. Pesch, A. Timm-Giel, and C. Görg , “Environmental monitoring aware routing in wireless sensor networks”, in Proc. IFIP Joint Conf. Mob. Wirel. Commun. Netw. (MWCN 2008) and Personal Wirel. Commun. (PWC 2008), Toulouse, France, 2008, vol. 284, pp. 5–16. [15] Z. Yuanyuan and G. Zheng, “Delay-bounded and robust routing protocol for emergency applications using wireless sensor networks”, in Proc. 2nd Int. Conf. Adv. Comp. Contr. ICACC 2010, Shenyang, Liaoning, China, 2010, vol. 4, pp. 37–41. [16] I. Yoon, D. K. Noh, D. Lee, R. Teguh, T. Teguh and H. Shin, “Reliable wildfire monitoring with sparsely deployed wireless sensor networks”, in Proc. 26th IEEE Int. Conf. Adv. Inform. Netw. Appl. AINA 2012, Fukuoka, Japan, 2012, pp. 460–466. ´ Serna, A. Bermudez, R. Casado and P. Kulakowski, “A convex [17] M. A. hull-based approximation of forest fire shape with distributed wireless sensor networks”, in Proc. 7th Int. Conf. Intell. Sens., Sens. Netw. Inform. Process. ISSNIP 2011, Adelaide, Australia, 2011, pp. 419–424. [18] K. D. Hyun, “A study for surface fire behavior and flame spread model in forest fire”, Ph.D. Thesis, University of Kyoto, Mar. 2010. [19] L. Yunhao et al., “Long-term large-scale sensing in the forest: recent advances and future directions of greenorbs”, J. Frontiers of Comp. Sci. in China, vol. 4, no. 3, pp. 334–338, 2010. ¨ Ulusoy, “A framework for use of [20] Y. E. Aslan, I. Korpeoglu and O. wireless sensor networks in forest fire detection and monitoring”, J. Comp., Environ. Urban Syst., vol. 36, no. 6, pp. 614–625, 2012.
Takuma Koga received his B.E. degree from Keio University in 2013. Currently he is a M.Sc. student at Keio University. His research interest are Wireless Sensor Networks. He is a member of IEICE.
E-mail:
[email protected] Department of Information and Computer Science Keio University 3-14-1 Hiyoshi, Kohoku, Yokohama 223-8522, Japan
Kentaroh Toyoda received his M.Sc. degree from Keio University in 2013. He is a Ph.D. student and a research assistant at Keio University. His research interest are security & privacy. He is a member of IEEE, IPSJ, and IEICE.
E-mail:
[email protected] Department of Information and Computer Science Keio University 3-14-1 Hiyoshi, Kohoku, Yokohama 223-8522, Japan
Iwao Sasase received the B.E., M.E., and D.Eng. degrees in Electrical Engineering from Keio University, Yokohama, Japan, in 1979, 1981 and 1984, respectively. From 1984 to 1986, he was a Post Doctoral Fellow and Lecturer of Electrical Engineering at University of Ottawa, Canada. He is currently a Professor of Information and Computer Science at Keio University, Yokohama, Japan. His research interests include modulation and coding, broadband mobile and wireless communications, optical communications, communication networks and information theory. E-mail:
[email protected] Department of Information and Computer Science Keio University 3-14-1 Hiyoshi, Kohoku, Yokohama 223-8522, Japan
97