A Systematic Review and Meta-Analysis of randomised controlled trials. Hu Ma MD, Ph.D, Yuan Liu MM, Su-Han Jin MM, Xian-Tao Zeng Ph.D, Joey S.W.Kwong.
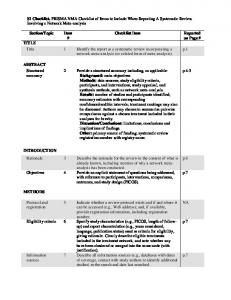
PRISMA 2009 Checklist Section/Topic
Reported on Page #
#
Checklist Item
1
Identify the report as a systematic review, meta-analysis, or both.
2
Provide a structured summary including, as applicable: background; objectives; data sources; study eligibility criteria, participants, and interventions; study appraisal and synthesis methods; results; limitations; conclusions and implications of key findings; systematic review registration number.
Abstract 2-3#
Rationale
3
Describe the rationale for the review in the context of what is already known.
Introduction 3-4#
Objectives
4
Provide an explicit statement of questions being addressed with reference to participants, interventions, comparisons, outcomes, and study design (PICOS).
Introduction 3-4#
5
Indicate if a review protocol exists, if and where it can be accessed (e.g., Web address), and, if available, provide registration information including registration number.
Methods 4# Selection
TITLE Title
Title 1#
ABSTRACT Structured summary
INTRODUCTION
METHODS Protocol and registration
criteria and Eligibility criteria
6
Specify study characteristics (e.g., PICOS, length of follow-up) and report characteristics (e.g., years considered, language, publication status) used as criteria for eligibility, giving rationale.
Data extraction 4-5#
Information sources
Search
7
8
Describe all information sources (e.g., databases with dates of coverage, contact with study authors to identify additional studies) in the search and date last searched.
Search strategy 4#
Present full electronic search strategy for at least one database, including any limits used, such that it could be repeated.
Appendix: PubMed and Embase
PRISMA 2009 Checklist search terms 11# Study selection
Data collection process
9
State the process for selecting studies (i.e., screening, eligibility, included in systematic review, and, if applicable, included in the meta-analysis).
Selection criteria 4-5#
10
Describe method of data extraction from reports (e.g., piloted forms, independently, in duplicate) and any processes for obtaining and confirming data from investigators.
Data extraction 5#
Data items
11
List and define all variables for which data were sought (e.g., PICOS, funding sources) and any assumptions and simplifications made.
Selection criteria and Data extraction 4-5#
Risk of bias in individual studies
12
Describe methods used for assessing risk of bias of individual studies (including specification of whether this was done at the study or outcome level), and how this information is to be used in any data synthesis.
Assessment for Risk 5# Selection criteria and Data extraction 4-5#
Summary measures
13
State the principal summary measures (e.g., risk ratio, difference in means).
Synthesis of results
14
Describe the methods of handling data and combining results of studies, if done, including measures of 2 consistency (e.g., I ) for each meta-analysis.
Statistical methods 5-6#
Page 1 of 2
Section/Topic
#
Checklist Item
Reported on Page #
Risk of bias across studies
15
Specify any assessment of risk of bias that may affect the cumulative evidence (e.g., publication bias, selective reporting within studies).
Publication bias 9#
PRISMA 2009 Checklist subgroup analyses 7-8#
16
Describe methods of additional analyses (e.g., sensitivity or subgroup analyses, meta-regression), if done, indicating which were pre-specified.
Study selection
17
Give numbers of studies screened, assessed for eligibility, and included in the review, with reasons for exclusions at each stage, ideally with a flow diagram.
Results 6#
Study characteristics
18
For each study, present characteristics for which data were extracted (e.g., study size, PICOS, follow-up period) and provide the citations.
Results 6#
Risk of bias within studies
19
Present data on risk of bias of each study and, if available, any outcome level assessment (see item 12).
Subgroups analysis 6-7#
Additional analyses
RESULTS
Relative risk for all AEs 7-8#
Results of individual studies
20
For all outcomes considered (benefits or harms), present, for each study: (a) simple summary data for each intervention group (b) effect estimates and confidence intervals, ideally with a forest plot.
Synthesis of results
21
Present the main results of the review. If meta-analyses done, include for each, confidence intervals and measures of consistency.
Risk of bias across studies
22
Present results of any assessment of risk of bias across studies (see Item 15).
Additional analysis
23
Give results of additional analyses, if done (e.g., sensitivity or subgroup analyses, meta-regression [see Item 16]).
subgroup analyses 7-8#
Summary of evidence
24
Summarize the main findings including the strength of evidence for each main outcome; consider their relevance to key groups (e.g., healthcare providers, users, and policy makers).
Discussion 9-10#
Limitations
25
Discuss limitations at study and outcome level (e.g., risk of bias), and at review-level (e.g., incomplete retrieval of identified research, reporting bias).
Discussion 10#
Conclusions
26
Provide a general interpretation of the results in the context of other evidence, and implications for future research.
Discussion 10-11#
Results 7-8# Publication bias 9#
DISCUSSION
FUNDING
PRISMA 2009 Checklist Funding
27
Describe sources of funding for the systematic review and other support (e.g., supply of data); role of funders for the systematic review.
Funding 11#
From: Moher D, Liberati A, Tetzlaff J, Altman DG, The PRISMA Group (2009). Preferred Reporting Items for Systematic Reviews and Meta-Analyses: The PRISMA Statement. PLoS Med 6(6): e1000097. doi:10.1371/journal.pmed1000097
For more information, visit: www.prisma-statement.org.
Page 2 of 2
The Adverse Events of Oxycodone in Cancer-Related Pain: A Systematic Review and Meta-Analysis of randomised controlled trials Hu Ma MD, Ph.D, Yuan Liu MM, Su-Han Jin MM, Xian-Tao Zeng Ph.D, Joey S.W.Kwong Ph.D, Yu-Ju Bai MD, Xu Tian MN, RN, Jian-Guo Zhou MD* Supplemental Data 2. The Search Strategy of PubMed and Embase PubMed Search terms #1 Search ("Oxycodone"[Mesh]) OR ((((((((((((Oxycone[Title/Abstract]) OR Dinarkon[Title/Abstract]) OR Oxycodeinon[Title/Abstract]) OR Dihydrohydroxycodeinone[Title/Abstract]) OR Dihydrone[Title/Abstract]) OR Oxiconum[Title/Abstract]) OR Theocodin[Title/Abstract]) OR Oxycontin[Title/Abstract]) OR Purdue Frederick Brand of Oxycodone[Title/Abstract]) OR Pancodine[Title/Abstract]) OR Eucodal[Title/Abstract]) OR Oxycodone Hydrochloride [Title/Abstract]) #2 Search (cancer[MeSH Terms]) OR ((((((((((Neoplasm[Title/Abstract]) OR Tumors[Title/Abstract]) OR Tumor[Title/Abstract]) OR Neoplasia[Title/Abstract]) OR Benign Neoplasms[Title/Abstract]) OR Neoplasms, Benign[Title/Abstract]) OR Benign Neoplasm[Title/Abstract]) OR Neoplasm, Benign[Title/Abstract]) OR Cancer[Title/Abstract]) OR Cancers[Title/Abstract]) #3 Search (((pain[Title/Abstract]) OR Pain Measurement[MeSH Major Topic]) OR Pain Management[MeSH Major Topic]) OR pain[MeSH Terms] #4 Search ((("Controlled Clinical Trial"[Publication Type]) OR ("Randomized Controlled Trials as Topic"[Mesh] OR "Randomized Controlled Trial"[Publication Type] OR "Controlled Clinical Trials as Topic"[Mesh]))) OR ((((((Controlled Clinical Trial[Title/Abstract]) OR Controlled Clinical Trials, Randomized[Title/Abstract]) OR Clinical Trials, Randomized[Title/Abstract]) OR Trials, Randomized Clinical[Title/Abstract]) OR Controlled Clinical Trials[Title/Abstract]) OR random*[Title/Abstract]) #5 #1 AND #2 AND #3 AND #4 Embase Search terms #1 ‘oxycodone’ OR ‘Oxycone’ OR ‘Dinarkon’ OR ‘Oxycodeinon’ OR ‘Oxycodone Hydrochloride’ OR ‘Dihydrone’ OR ‘Oxiconum’ OR ‘Theocodin’ OR ‘Oxycontin’ OR ‘Purdue Frederick Brand of Oxycodone’ OR ‘Pancodine’ OR ‘Eucodal’ OR ‘Oxycodone Hydrochloride’ #2 'controlled clinical trial'/exp OR 'controlled clinical trial' OR 'randomized controlled trials'/exp OR 'randomized controlled trials' OR 'controlled clinical trials'/exp OR 'controlled clinical trials' OR 'controlled clinical trials, randomized' OR 'clinical trials, randomized' OR 'trials, randomized clinical' OR 'random' #3 ‘Pain’ OR ‘Pain Management’ OR ‘Pain Measurement’ #4 ‘cancer’ OR ‘Neoplasm’ OR ‘Tumors’ OR ‘Tumor’ OR ‘Neoplasia’ OR ‘Cancer’ OR ‘Cancers’ #5 #1 AND #2 AND #3 AND #4
The Adverse Events of Oxycodone in Cancer-Related Pain: A Systematic Review and Meta-Analysis of randomised controlled trials Hu Ma MD, Ph.D, Yuan Liu MM, Su-Han Jin MM, Xian-Tao Zeng Ph.D, Joey S.W.Kwong Ph.D, Yu-Ju Bai MD, Xu Tian MN, RN, Jian-Guo Zhou MD* Supplemental Data 2. The Result of SAS Meta Power Anlysis data constipation; input es v; cards; -2.1776161 2.2026125 0.04546237 0.03357327 0.64435702 0.46746032 0.37320425 0.38440021 0 0.31292517 -0.06499214 0.0651521 0.06669137 0.16662959 0.15822401 0.08037166 -0.24116206 0.2474026 -0.48550782 0.12019231 0.54654371 0.65191388 ; run; %metapower (test='M', model='fixed', raw_data='yes', alpha=.05, tau2=99,heterogeneity=99, n1=99, n2=99, k=99, eff_type='or', T= -0.005243, Dataset= constipation, B=NA, v=v, x=NA, es=es, p=NA, weight=NA); run;
Estimated Power of Test (Two-Tailed) = 0.0502704
-------------------------------------------------------------------
data Nausea; input es v; cards; -0.78249228 0.34214993 0.04546237 0.03357327 -0.25299651 0.12898099 -0.19798988 0.13354727 0.48972545 0.20647408 -0.08742281 0.08774091 -0.18232156 0.25648148 -0.08590334 0.08628251 -0.63252256 1.3786765 -0.19415601 0.39201681 -1.1631508 0.535 ; run; %metapower (test='M', model='fixed', raw_data='yes', alpha=.05, tau2=99,heterogeneity=99, n1=99, n2=99, k=99, eff_type='or', T= -0.04769, Dataset= Nausea, B=NA, v=v, x=NA, es=es, p=NA, weight=NA); run;
The SAS System
2015年10月21日 星期三 上午05时00分50秒
1
---------------------Meta-Analysis Power Macro--------------------
Test of Mean Effect Size
Model = Effect Size Metric = or
fixed
Raw data provided= Yes
Mean Effect Size = Number of Studies =
-0.04769 11
Sampling Variance = 0.0117891 Alpha =
0.05
Estimated Power of Test (One-Tailed) = 0.0185765 Estimated Power of Test (Two-Tailed) = 0.0723783
data Vomiting; input es v; cards; -2.5261095 2.1344214 0.07711303 0.03269768 -0.61558895 0.26894559 -0.16632122 0.33466462 -0.17206506 0.34615331 0.28995222 0.29632035 0.23638878 0.33060429
-0.54796517 0.24172297 -0.34830669 0.71895425 -0.25782911 0.52361854 0.30538165 0.73308271; run; %metapower (test='M', model='fixed', raw_data='yes', alpha=.05, tau2=99,heterogeneity=99, n1=99, n2=99, k=99, eff_type='or', T= -0.04866, Dataset= Vomiting, B=NA, v=v, x=NA, es=es, p=NA, weight=NA); run; The SAS System
2015年10月21日 星期三 上午05时10分40秒
1
---------------------Meta-Analysis Power Macro---------------------
Test of Mean Effect Size
Model =
fixed
Effect Size Metric = or
Raw data provided= Yes
Mean Effect Size =
-0.04866
Number of Studies =
10
Sampling Variance =
0.018354
Alpha =
0.05
Estimated Power of Test (One-Tailed) = 0.0225335
The SAS System 2015年10月21日 星期三 上午05时10分40秒
2
Estimated Power of Test (Two-Tailed) = 0.0649056
------------------------------------------------------------------
data Pruritus; input es v; cards; -0.3801473 0.15970085 -0.131336 0.41322537 -0.34830669 0.71895425 0.19237189 0.48787879 ; run; %metapower (test='M', model='fixed', raw_data='yes', alpha=.05, tau2=99,heterogeneity=99, n1=99, n2=99, k=99, eff_type='or', T= -0.097997, Dataset= Pruritus, B=NA, v=v, x=NA, es=es, p=NA, weight=NA); run; Estimated Power of Test (Two-Tailed) =
0.06344
data Sleepiness; input es v; cards; -0.78495473 0.15982531 -0.23687374 0.20854629 0 0.88235294 -0.63252256 0.68933824 -0.04879016 0.56904762 ; run; %metapower (test='M', model='fixed', raw_data='yes', alpha=.05, tau2=99,heterogeneity=99, n1=99, n2=99, k=99, eff_type='or', T= -0.20691, Dataset= Sleepiness, B=NA, v=v, x=NA, es=es, p=NA, weight=NA); run;
data dizziness; input es v; cards; -0.55004634 0.37371795 0.05339289 0.07932773 -0.38865799 0.79971751 -0.65981076 0.7166574 0.20686267 0.20950185 -0.43332206 0.35667722 0 0.27272727 0.17185026 0.34736842 -0.66139848 1.4364919 0.27193372 0.32738095 ; run; %metapower (test='M', model='fixed', raw_data='yes', alpha=.05, tau2=99,heterogeneity=99, n1=99, n2=99, k=99, eff_type='or', T= -0.02872, Dataset= dizziness, B=NA, v=v, x=NA, es=es, p=NA, weight=NA); run;
data anorexia; input es v; cards; 0.05571061 0.08377805 -1.063521 2.5964696 -0.34830669 0.71895425 -0.05406722 1.8918129 ; run; %metapower (test='M', model='fixed', raw_data='yes', alpha=.05, tau2=99,heterogeneity=99, n1=99, n2=99, k=99, eff_type='or', T= -0.01278, Dataset= anorexia, B=NA, v=v, x=NA, es=es, p=NA, weight=NA); run;
data Dysuia; input es v; cards; -1.5755364 2.366092 -1.0815179 2.6324761 -0.66139848 1.4364919 ; run; %metapower (test='M', model='fixed', raw_data='yes', alpha=.05, tau2=99,heterogeneity=99, n1=99, n2=99, k=99, eff_type='or', T= -0.464705879957229, Dataset= Dysuia, B=NA, v=v, x=NA, es=es, p=NA, weight=NA); run;
The Adverse Events of Oxycodone in Cancer-Related Pain: A Systematic Review and Meta-Analysis of randomised controlled trials Hu Ma MD, Ph.D, Yuan Liu MM, Su-Han Jin MM, Xian-Tao Zeng Ph.D, Joey S.W.Kwong Ph.D, Yu-Ju Bai MD, Xu Tian MN, RN, Jian-Guo Zhou MD* Supplemental Data 4. The Result of Publication Bias by Egger’ and Begg’ Regression
The publication bias of our meta-analysis was assessed using funnel Begg’s and Egger’s regreesion. There was no evidence of significant publication bias by inspection of the formal statistical tests [(1) dysuria: Begg’s test, P = 1.00; Egger’s test, P = 0.41); (2) constipation: Begg’s test, P = 0.64; Egger’s test, P = 0.78); nausea: Begg’s test, P = 0.06; Egger’s test, P = 0.06); vomiting: Begg’s test, P = 0.16; Egger’s test, P = 0.09); pruritus: Begg’s test, P = 0.73; Egger’s test, P = 0.43); sleepiness: Begg’s test, P = 1.00; Egger’s test, P = 0.34); dizziness: Begg’s test, P = 0.05; Egger’s test, P = 0.07); anorexia: Begg’s test, P = 0.31; Egger’s test, P = 0.17) ]. 1. Dysuria: . metabias logrr _selogES, _ES egger Note: default data input format (theta, se_theta) assumed. Tests for Publication Bias Begg's Test adj. Kendall's Score (P-Q) = Std. Dev. of Score = Number of Studies = z Pr > |z| = z Pr > |z| =
-1 1.91 3 = -0.52 0.602 = 0.00 (continuity corrected) 1.000 (continuity corrected)
Egger's test -----------------------------------------------------------------------------Std_Eff | Coef. Std. Err. t P>|t|
[95% Conf. Interval]
-------------+---------------------------------------------------------------slope | 1.210149 1.716098 0.71 0.609 bias | -1.594985 1.212918 -1.31 0.414
-20.59495 -17.00657
23.01525 13.8166
2. Constipation Note: default data input format (theta, se_theta) assumed. Tests for Publication Bias Begg's Test adj. Kendall's Score (P-Q) = 7 Std. Dev. of Score = 12.85 Number of Studies = 11 z = 0.54 Pr > |z| = 0.586 z = 0.47 (continuity corrected) Pr > |z| = 0.640 (continuity corrected) Egger's test -----------------------------------------------------------------------------Std_Eff | Coef. Std. Err. t P>|t| [95% Conf. Interval] -------------+---------------------------------------------------------------slope | .0478924 .19199 0.25 0.809 -.3864192 .4822041 bias | -.1554965 .5363993 -0.29 0.778 -1.368916 1.057923 3. Nausea Note: default data input format (theta, se_theta) assumed. Tests for Publication Bias Begg's Test adj. Kendall's Score (P-Q) = Std. Dev. of Score = Number of Studies = z Pr > |z| = z Pr > |z| = Egger's test
-25 12.85 11 -1.95 0.052 = 1.87 (continuity corrected) 0.062 (continuity corrected)
=
-----------------------------------------------------------------------------Std_Eff | Coef. Std. Err. t P>|t| [95% Conf. Interval] -------------+---------------------------------------------------------------slope | .2309468 .1691424 1.37 0.205 -.1516799 .6135735 bias | -.9987682 .4696943 -2.13 0.062 -2.061291 .0637542 -----------------------------------------------------------------------------4. Vomiting Note: default data input format (theta, se_theta) assumed. Tests for Publication Bias Begg's Test adj. Kendall's Score (P-Q) = Std. Dev. of Score = Number of Studies = z Pr > |z| = z Pr > |z| =
-19 12.85 11 = -1.48 0.139 = 1.40 (continuity corrected) 0.161 (continuity corrected)
Egger's test -----------------------------------------------------------------------------Std_Eff | Coef. Std. Err. t P>|t| [95% Conf. Interval] -------------+---------------------------------------------------------------slope | .2297391 .1821207 1.26 0.239 -.1822466 .6417248 bias | -.7686158 .4103623 -1.87 0.094 -1.69692 .1596883 5. Pruritus . Note: default data input format (theta, se_theta) assumed. Tests for Publication Bias Begg's Test adj. Kendall's Score (P-Q) = 2 Std. Dev. of Score = 2.94 Number of Studies = 4 z = 0.68 Pr > |z| = 0.497 z = 0.34 (continuity corrected)
Pr > |z| =
0.734 (continuity corrected)
Egger's test -----------------------------------------------------------------------------Std_Eff | Coef. Std. Err. t P>|t| [95% Conf. Interval] -------------+---------------------------------------------------------------slope | -.6339154 .4302076 -1.47 0.279 -2.484949 1.217119 bias | .7341634 .7489287 0.98 0.430 -2.488217 3.956544 6. Sleepiness Note: default data input format (theta, se_theta) assumed. Tests for Publication Bias Begg's Test adj. Kendall's Score (P-Q) = 0 Std. Dev. of Score = 4.08 Number of Studies = 5 z = 0.00 Pr > |z| = 1.000 z = -0.24 (continuity corrected) Pr > |z| = 1.000 (continuity corrected) Egger's test -----------------------------------------------------------------------------Std_Eff | Coef. Std. Err. t P>|t| [95% Conf. Interval] -------------+---------------------------------------------------------------slope | -.9429237 .4569466 -2.06 0.131 -2.397132 .5112842 bias | .9008406 .8017623 1.12 0.343 -1.650725 3.452406 7. Dizziness Note: default data input format (theta, se_theta) assumed. Tests for Publication Bias Begg's Test adj. Kendall's Score (P-Q) = -23 Std. Dev. of Score = 11.18 Number of Studies = 10 z = -2.06
Pr > |z| = 0.040 z = 1.97 (continuity corrected) Pr > |z| = 0.049 (continuity corrected) Egger's test -----------------------------------------------------------------------------Std_Eff | Coef. Std. Err. t P>|t| [95% Conf. Interval] -------------+---------------------------------------------------------------slope | .3788555 .2154277 1.76 0.117 -.1179216 .8756325 bias | -.8627398 .4076116 -2.12 0.067 -1.802694 .0772142 8. Anorexia Note: default data input format (theta, se_theta) assumed. Tests for Publication Bias Begg's Test adj. Kendall's Score (P-Q) = Std. Dev. of Score = Number of Studies = z Pr > |z| = z Pr > |z| =
-4 2.94 4 = -1.36 0.174 = 1.02 (continuity corrected) 0.308 (continuity corrected)
Egger's test -----------------------------------------------------------------------------Std_Eff | Coef. Std. Err. t P>|t| [95% Conf. Interval] -------------+---------------------------------------------------------------slope | .2105003 .1366696 1.54 0.263 -.3775416 .7985421 bias | -.5442062 .2578762 -2.11 0.169 -1.653758 .5653456
The Adverse Events of Oxycodone in Cancer-Related Pain: A Systematic Review and Meta-Analysis of randomised controlled trials
Hu Ma MD, Ph.D, Yuan Liu MM, Su-Han Jin MM, Xian-Tao Zeng Ph.D, Joey S.W.Kwong Ph.D, Yu-Ju Bai MD, Xu Tian MN, RN, Jian-Guo Zhou MD*
Supplemental Data 5 The GRADE profile evidence of the included studies Date: 2015-10-24 Question: Should Oxycodone vs Other opioid agents be used in Cancer-Related Pain? Settings: The Adverse Events of Oxycodone in Cancer-Related Pain Bibliography:
Quality assessment
No of patients
Effect Quality Importance
Other No of
Risk of Design
studies
Other Inconsistency
bias
Indirectness
Imprecision
Relative Oxycodone
opioid
considerations
Absolute (95% CI)
agents
Dysuria 3
randomised
no serious
no serious
no serious
no serious
trials
risk of bias
inconsistency
indirectness
imprecision
none
1/144
5/144
RR 0.343
23 fewer per 1000
(0.69%)
(3.5%)
(0.071 to
(from 32 fewer to 23
1.667)
more)
0%
⊕⊕⊕⊕ IMPORTANT HIGH
-
Constipation 11
randomised
no serious
no serious
no serious
no serious
trials
risk of bias
inconsistency
indirectness
imprecision
none
3 fewer per 1000 (from ⊕⊕⊕⊕ IMPORTANT
128/604
132/607
RR 0.988
(21.2%)
(21.7%)
(0.800 to
43 fewer to 48 more)
0%
1.220)
-
24/183
25/184
RR 0.971
(13.1%)
(13.6%)
(0.579 to
57 fewer to 85 more)
0%
1.628)
-
18/118
24/121
RR 0.798
40 fewer per 1000
(15.3%)
(19.8%)
(0.456 to
HIGH
Anorexia 4
randomised
no serious
no serious
no serious
no serious
trials
risk of bias
inconsistency
indirectness
imprecision
none
4 fewer per 1000 (from ⊕⊕⊕⊕ IMPORTANT HIGH
Pruritus 4
randomised
no serious
no serious
no serious
no serious
trials
risk of bias
inconsistency
indirectness
imprecision
none
1.398) 0%
⊕⊕⊕⊕
(from 108 fewer to 79 HIGH
NOT IMPORTANT
more) -
Sleepiness 5
randomised
no serious
no serious
no serious
no serious
trials
risk of bias
inconsistency
indirectness
imprecision
none
22/211
38/212
RR 0.621
68 fewer per 1000
(10.4%)
(17.9%)
( 0.379 to
(from 111 fewer to 3
1.018)
more) 76 fewer per 1000
20% (from 124 fewer to 4
⊕⊕⊕⊕ IMPORTANT HIGH
more) Vomiting 11
randomised
no serious
no serious
no serious
no serious
trials
risk of bias
inconsistency
indirectness
imprecision
none
88/604
100/607
(14.6%)
(16.5%)
RR 0 (0.690 to 165 fewer per 1000 1.158)
(from 51 fewer to 26
⊕⊕⊕⊕ IMPORTANT HIGH
more) 0%
-
Nausea 11
randomised
no serious
no serious
no serious
no serious
trials
risk of bias
inconsistency
indirectness
imprecision
none
125/604
144/607
RR 0.896
25 fewer per 1000
(20.7%)
(23.7%)
(0.725 to
(from 65 fewer to 26
1.108)
more)
0%
⊕⊕⊕⊕ IMPORTANT HIGH
-
Dizziness 10
randomised
no serious
no serious
no serious
no serious
trials
risk of bias
inconsistency
indirectness
imprecision
none
8 fewer per 1000 (from ⊕⊕⊕⊕ IMPORTANT
61/512
65/515
RR 0.936
(11.9%)
(12.6%)
(0.676 to
41 fewer to 37 more)
0%
1.295)
-
HIGH


![S10 Table. PRISMA checklist [29]. - PLOSwww.researchgate.net › 327361117_S10_Table › data](https://m.moam.info/img/260x300/s10-table-prisma-checklist-29-ploswwwresearchgaten_606e23c6097c47494d8b45ab.jpg)