Iranica Journal of Energy & Environment 3 (3): 259-263, 2012 ISSN 2079-2115 IJEE an Official Peer Reviewed Journal of Babol Noshirvani University of Technology DOI: 10.5829/idosi.ijee.2012.03.03.3004 BUT
Probabilistic and Deterministic Seismic Hazard Assessment in Amol Center, a City in North of Iran H.R. Tavakoli and M. Talebzadeh Amiri Department of Civil Engineering, Babol University of Technology, Babol, Iran (Received: April 9, 2012; Accepted: August 23, 2012)
Abstract: In this paper, the peak ground acceleration (PGA) over the bedrock is calculated by a probabilistic and deterministic seismic hazard assessment. An active fault map of the region is prepared. For this purpose, all active faults in a radius of 100 km from Amol city center are recognized and their seismic and rapture parameters are determined. Afterwards, for seismic hazard analysis, the seismic parameters of study region are determined and seismic classification zone is performed. Maximum earthquake, seismic parameters and also occurrence rate are determined. Seismic hazard analysis is performed using 3 different attenuation relationships resulted in seismic hazard curves for Amol city center. The peak ground acceleration (PGA) for design levels MCE, OBE and benefit life structure 50 and 100 years are presented. For the PGA quantity design levels operating base earthquake (OBE), maximum credible earthquake (MCE) for horizontal and vertical dimensions were equal to sequences of 0.33, 0.5 and 0.3, 0.53 g, respectively. Key words: Active fault; Seismic hazard assessment; Logic tree; Return period INTRODUCTION
Seismic Hazard Assessment Deterministic Seismic Hazard Analysis: The methodology for the analysis can be described in four steps:
Iran, one of the most seismic countries of the world, is situated over the Himalayan-Alpied seismic belt. In this region faults movements do not have a logic process. In many regions especially in Alborz region horizontal movements can be observed along with the faults; in addition to vertical movements which are a reason for turbulent deformations. The devastated types of these sorts of deformations in central Alborz region have apparently happened after 1990 Manjil- Rudbar earthquake. This paper presents Probabilistic and deterministic seismic hazard assessment of Amol City center. The study area having the center points as Amol city with latitude of 52° 21’ N and longitude of 77° 36’ E and probabilistic and deterministic seismic hazard assessment. Probabilistic and deterministic approaches to seismic hazard analyses are often demonstrated as diametrically opposed. In fact, they are complementary. For many engineering design purposes they are benefited in combined form.
C
C C
C
Source characterization includes identification and characterization of all earthquake sources which may cause significant ground motion in the study area. Selection of the shortest distance between the source and the site of interest. Selection of controlling earthquake i.e., the earthquake that is expected to produce the strongest level of shaking. Formally define the hazard in terms of ground motions produced by the controlling earthquake at the site.
Seismogenic Sources: The seismic tectonic conditions of Amol city center are under the influence of the Iranian tectonic plate in Middle East region. The most significant and primary faults in the vicinity of Amol city center include: Khazar, North Alborz,
Corresponding Author: AH.R. Tavakoli, Department of Civil Engineering, Babol University of Technology, Babol, Iran. Tel/Fax: +981113231707, E-mail:
[email protected]
259
Iranica J. Energy & Environ., 3 (3): 259-263, 2012
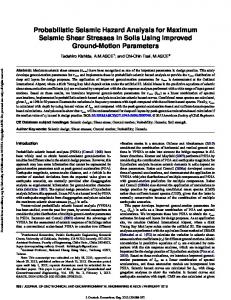
Fig. 1: Active fault map of Iran Table 1: Controlling earthquake for each fault source
Fault name
Khazar North Alborz no. 3 no. 4 Kandevan Mosha North Tehran Astaneh Atari no. 10
Surface rupture length (km)
R (km)
EQ.1*
EQ.2
EQ.3
EQ.4
EQ.5
Ave.EQ
92.7 139.8 24 31.8 33.6 57.3 49.5 42 18 4.2
15 25 46 82 89 87 136 110 105 111
7.46 7.57 7.09 7.17 7.18 7.33 7.29 7.24 7.02 6.63
7.51 7.68 6.97 7.09 7.11 7.32 7.26 7.20 6.86 6.28
7.37 7.57 6.71 6.85 6.88 7.14 7.06 6.98 6.57 5.86
7.37 7.55 6.78 6.90 6.93 7.16 7.09 7.02 6.66 6.02
7.40 7.62 6.68 6.83 6.86 7.14 7.07 6.98 6.53 5.76
7.42 7.60 6.85 6.97 6.99 7.22 7.16 7.09 6.73 6.11
EQ1*: ( Mw=5.16+1.12LogL)
Kandevan, Mosha, North Tehran, Astaneh, Atari and no. 3, 4, 10 faults. The locations of these faults are shown in Figure 1 within Amol city center.
Coppersmith [1], Nowroozi [2] and other relationships, as given as follows: Mw Ms Ms Ms Mw
Selection of the Controlling Earthquakes: Once all sources are identified, the controlling earthquakes for each need to be determined. The definition of controlling earthquake is subjective and varies depends on the created and resulted hazards if the prospective facility fails. It has been known that earthquake magnitude is correlated to rapture parameters such as length of displacement. The maximum earthquake, caused by a fault, may be estimated by empirical relationships between magnitude and fault length. Surface rapture length is the most important factor in these functions; it has been assumed as 30% of the fault length. Maximum magnitude for each fault source was obtained using the Wells and
= = = = =
5.16+1.12Log L 6.24+0.619Log L 5.71+0.916Log L 5.4+Log L 5.0+1.22 Log L
(1) (2) (3) (4) (5)
where, Mw and Ms are the moments and surface wave magnitudes, respectively. Also L is the fault surface rupture length in km. Controlling earthquakes presented in Table 1. Attenuation Relationships: For predicting future ground motions magnitude, distance and site conditions are the principal variables. A number of predictive relationships 260
Iranica J. Energy & Environ., 3 (3): 259-263, 2012 Table 2: PGA Horizontal and Vertical with used Deterministic Seismic Hazard Analysis in Amol center
Ghasem i [5 ] , Gh ase m i [ 5 ] , H ,PGA V ,PGA
F a u lt n a m e K hazar N o rth A l b or z no. 3 no. 4 K a n d e v an Mosha N o rth T e h r a n A s taneh A tari n o . 10
Gib b s et al. [4], H ,PGA
Cam pbell and Cam pbell and Bo zorgnia [3], Bo zorgnia [3], H ,PGA V ,PGA
A T .1
A T .2
A T .3
A T .4
A T .5
P G A .H
P G A .V
0 .3 1 3 0 .2 1 2 0 .0 6 5 0 .0 3 8 0 .0 3 6 0 .0 4 3 0 .0 2 5 0 .0 3 1 0 .0 2 5 0 .0 1 5
0.176 0.120 0.037 0.022 0.021 0.025 0.015 0.018 0.014 0.008
0 .38 4 0 .29 0 0 .12 6 0 .08 6 0 .08 1 0 .09 3 0 .06 4 0 .07 2 0 .06 3 0 .04 4
0.4 7 1 0.3 5 6 0.1 2 4 0.0 7 4 0.0 6 9 0.0 8 3 0.0 4 9 0.0 5 9 0.0 4 8 0.0 3 0
0.532 0.362 0.106 0.056 0.051 0.062 0.034 0.042 0.034 0.020
0 .38 9 0 .28 6 0 .10 5 0 .06 6 0 .06 2 0 .07 3 0 .04 6 0 .05 4 0 .04 5 0 .03 0
0 .354 0 .241 0 .071 0 .039 0 .036 0 .044 0 .024 0 .030 0 .024 0 .014
derived from regression analysis of strong motion data available for the horizontal peak ground acceleration, as well as, the analysis required a seismic source model of the region and appropriate attenuation relationships. In this research, Campbell and Bozorgnia [3], Gibbs et al. [4] and Ghasemi et al. [5] the source attenuation of peak acceleration from world-wide accelerograms records using the logic-tree method were employed. These relations were derived empirically from the recorded accelerograms produced by earthquakes in different parts of the world.
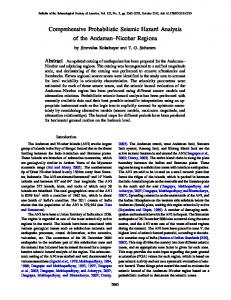
Fig. 2: Applied logic tree for horizontal dimension
Fig. 3: Applied logic tree for vertical dimension Computation of Design Ground Motion Parameters: With respect to attenuation relationships, relationship between earthquake magnitude and rupture length fault, maximum PGA horizontal and vertical accelerations are summarized in Table 2 (Deterministic Seismic Hazard Analysis).
explicitly incorporated in PSHA. As such, regions of greater seismic activity (thus higher probabilities of earthquake occurrence) will have higher ground motion levels for the given probabilities or return periods. The uncertainty or randomness in earthquake location is explicitly incorporated in PSHA. Thus, the conservatism of assuming that the earthquake occurs at the closest location on the source to the site is not necessary in PSHA. Uncertainties in the earthquake occurrence and ground motion estimation process are explicitly considered in PSHA.
Probabilistic Seismic Hazard Analysis: Unlike deterministic seismic hazard analysis, probabilistic analysis allows the uncertainties in size, location, rate of recurrence and effect of earthquakes to be explicitly considered in the evaluation of seismic hazard. In addition, there are some advantages using probabilistic seismic hazard analysis: A probabilistic seismic hazard analysis (PSHA) allows the designer to balance risk and cost for a project in a manner similar to that used for other environmental loadings such as flood or wind loading. The reduction in risk by electing a lower probability level (longer return period) and correspondingly higher seismic loading may be compared to the increased project cost involved while designing for the higher loading. The frequency of occurrence of earthquake is
Logic Tree Method: The probability computations described previously allow systematic consideration of uncertainty in values of the parameters of a particular seismic hazard model. However, in some cases the best choices for elements of the seismic hazard model itself may not be clear. The logic tree approach allows the use of alternative models, each of which is assigned a weight factor that is interpreted as the relative likelihood of that model being correct. It consists of a series of nodes, 261
Iranica J. Energy & Environ., 3 (3): 259-263, 2012
Fig. 4: Combined hazard curve based on Ghasemi et al., Gibbs et al., Campbell and Bozorgnia attenation (Horizontal)
Fig. 6: Levels of Hazard in 50 Years
Fig. 5: Combined hazard curve based on Ghemi et al., Campbell and Bozorgnia attenation (Vertical)
Fig. 7: Levels of Hazard in 100 Years probability level. Depending of the importance of the structure a lower or higher probability level is chosen [6]. Return periods of different ground accelerations were evaluated using specified time intervals (t) and different probabilities of exceedance that were derived from hazard curves. Curvatures of benefit life structure, 50 and 100 years with respect to hazard levels, PGA content in vertical and horizontal dimensions are presented in Figures 6 and 7. In Figures 8 and 9 depict results of hazard analysis probabilistic and deterministic seismic hazard assessment in Amol city center with level design operating base earthquake (OBE), maximum credible earthquake (MCE) presented by probabilistic and deterministic method with 0.5 weight percent.
representing points at which models are specified and branches that represent the different models specified at each node. The sum of the probabilities of all branches connected to a given node must be 1. Figures 3 and 4 show the logic tree that considered the uncertainty in attenuation relationships. Return Period for the Life of the Structure: Results of hazard analysis were used in engineering projects; they should be expressed in applicable form for engineers. Typical probabilistic approach proposes that the structure to be designed for the ground motion that will be exceeded at least once during the life of the structure with a given
262
Iranica J. Energy & Environ., 3 (3): 259-263, 2012 Rt(O B E)=50%, Rt(MCE)=10% HORIZONTAL
(DSHA)
PGA(OBE)=0.389g
(PSHA)
PGA(MCE)=0.473g
PGA(MC E)=0.53g
PGA(O B E)=0.275g
PGA(MCE)=0.50g
PGA(OBE)=0.33g
Fig. 8: Results of calculation methods hazard analysis of Amol city center (Horizontal) Rt(O B E)=50%, Rt(MCE)=10% VERTICAL
(DSHA)
PGA(OBE)=0.354g
(PSHA)
PGA(MCE)=0.533g
PGA(MCE)=0.535g
PGA(OBE)=0.25g
PGA(MCE)=0.53g
PGA(O B E)=0.3g
Fig. 9: Results of calculation methods hazard analysis of Amol city center (Vertical) CONCLUSION
2.
It was concluded that in seismic hazard study, the probabilistic and deterministic seismic hazard assessment, after evaluation of the available information around geological and earthquake; the seismic potential sources for each source the Mmax was obtained. Then, ground motion parameters are estimated. Ten potential sources detected and used by Campbell and Bozorgnia [3], Gibbs et al. [4] and Ghasemi et al. [5] relationship strong motion parameters PGA for design levels MCE and OBE and benefit life structure 50 and 100 years are defined. The PGA quantity design levels OBE, MCE for horizontal and vertical dimensions were equal to sequences of 0.33, 0.5 and 0.3, 0.53 g, respectively.
3.
4.
5.
REFERENCES 1.
Wells, D.L. and K.J. Coppersmith, 1994. New empirical relationships among magnitude, rupture length, rupture width, rupture area and surface displacement, BSSA, 84(4): 974-1002.
6.
263
Nowroozi, A., 1985. Empirical relations between magnitude and fault parameters for earthquakes in Iran, BSSA, 75(5): 1327-1338. Campbell, K.W. and Y. Bozorgnia, 2003. Updated Near-Source Ground-Motion (Attenuation) Relations for the Horizontal and Vertical Components of Peak Ground Acceleration and Acceleration Response Spectra. doi: 10.1785/0120020029 Bulletin of the Seismological Society of America, 93(1): 314-331. Gibbs J.F., D.M. Boore, W.B. Joyner and T.E. Fumal, 1994. The attenuation of seismic shear waves in quaternary alluvium in Santa Clara Valley, California. Bulletin of the Seismological Society of America February, 84(1): 76-90. Ghasemi, H., M. Zare, Y. Fukushima and K. Koketsu, 2009. An empirical spectral ground-motion model for Iran. Journal of Seismology, 13(4): 499-515, DOI: 10.1007/s10950-008-9143-x. Bommer, J.J., 2002. Deterministic vs. probabilistic seismic hazard assessment: an exaggerated and obstructive dichotomy. Journal of Earthquake Engineering, 6(Special Issue 1): 43-73.