36th Annual IEEE Conference on Local Computer Networks
LCN 2011, Bonn
PFS: Probabilistic Filter Scheduling Against Distributed Denial-of-Service Attacks Dongwon Seo and Heejo Lee
Adrian Perrig
Div. of Computer and Communication Engineering Korea University Seoul, Korea Email: {aerosmiz, heejo}@ korea.ac.kr
CyLab/ECE Carnegie Mellon University Pittsburgh, PA, USA Email:
[email protected]
[25] and flow-based detection [7], protects a victim’s server side from DDoS attacks. However, it only covers the victim’s server or a small network area, and cannot counter a link resource attack (e.g., link congestion). Finally, an intermediate network defense scheme utilizes intermediate routers that can be the most effective locations to defend against both victim resource and link resource attacks [2], [3], [18], [29], [31]. It installs filters to intermediate filter routers to block undesired flows. A filter is a rule to drop or forward specific packets, and a filter router is a router that drops or forwards packets according to the filter. However, the challenges are how to propagate filters for the effective defense and how to manage many filters under limited router resources. Of the intermediate network defenses, Active Internet Traffic Filtering (AITF) [2], [3], considered as one of the most complete works on filter-based DDoS defenses [17], addresses the challenges. It adopts two techniques: a record route (RR) to propagate filters and rate limiting to handle the number of filters. Nevertheless, the techniques are insufficient for three reasons: impractical path identification, vulnerable to filter flooding attack, and many required changes to the network infrastructure. We explain AITF in more detail in Section II. Consequently, a viable filter-based approach should provide a solution to the following problems: 1) how to practically identify attack paths, 2) how to propagate filters to the optimal locations (filter routers), and 3) how to manage many filters to retain the most effective ones. Hence, the filter scheduling problem is to find a solution to these three challenges. To address these challenges, we propose a novel filterbased DDoS defense mechanism, termed PFS (Probabilistic Filter Scheduling), leveraging probabilistic packet marking and a filter scheduling policy. Filter routers employ probabilistic packet marking to identify attack paths and to propagate filters. The victim collects the markings and determines which filter router is forwarding the undesired flow. Moreover, we adopt a filter scheduling policy for filter selection, because filter routers can suffer from a flood of filter requests. The filter scheduling policy decides which filter should be installed and which filter should be evicted. Each filter router computes filter scores (priorities) depending on how frequently and recently its filters are used; therefore, the filter router keeps actively used filters, whereas, it evicts useless filters. To the best of our knowledge, no existing work addresses the filter scheduling problem, and we attempt to solve it via probabilistic packet marking and a filter scheduling policy. In our experiments based on Internet-like topologies, PFS shows 44% higher defense effectiveness than existing filter-
Abstract—Distributed denial-of-service (DDoS) attacks continue to pose an important challenge to current networks. DDoS attacks can cause victim resource consumption and link congestion. A filter-based DDoS defense is considered as an effective approach, since it can defend against both attacks: victim resource consumption and link congestion. However, existing filter-based approaches do not address necessary properties for viable DDoS solutions: how to practically identify attack paths, how to propagate filters to the best locations (filter routers), and how to manage many filters to maximize the defense effectiveness. We propose a novel mechanism, termed PFS (Probabilistic Filter Scheduling), to efficiently defeat DDoS attacks and to satisfy the necessary properties. In PFS, filter routers identify attack paths using probabilistic packet marking, and maintain filters using a scheduling policy to maximize the defense effectiveness. Our experiments show that PFS achieves 44% higher effectiveness than other filter-based approaches. Furthermore, we vary PFS parameters in terms of the marking probability and deployment ratio, and find that 30% marking probability and 30% deployment rate maximize the attack blocking rate of PFS. Index Terms—Network security; DDoS attack defense; routerbased filtering; filter scheduling.
I. I NTRODUCTION Distributed denial-of-service (DDoS) attacks have recently again become severe due to the emergence of powerful DDoS attack automation tools and botnets. DDoS attackers have diverse goals, such as racketeering and political motivations. As an example of racketeering or extortion, the Itembay web site for trading game items was paralyzed by DoS attacks in September 2007 [10]. As an example of political motivation, in June 2009, media web sites in Belarus were under DDoS attack [12]. The background of this attack was a suspected political issue between Georgia and Russia. Another political motivated incident occurred on July 7th, 2009, the DDoS attack in South Korea and the U.S., the so called 7.7 DDoS attack [14]. The attacks targeted major portal sites in South Korea and several U.S. government agencies. Similarly, another DDoS attack was launched on March 4th, 2011, which also targeted about 40 major web sites [15] in South Korea. These incidents imply that DDoS attacks are still prevalent in the current Internet. Many approaches have been proposed to defeat DDoS attacks. They can be categorized into three groups depending on the location of their deployment. First, a source-end defense scheme has the most effective benefits, because malicious traffic is blocked before spreading [13], [20]. However, a critical issue of this approach is how to deploy the scheme to the majority of end hosts. Second, a victim-end defense scheme, such as IDS/IPS (Intrusion Detection/Prevention System) [24],
978-1-61284-927-0/10/$26.00 ©2011 IEEE
9
B. AITF Challenges There are several issues in AITF, and these partially motivate the work we present in this paper. Impractical path identification. AITF employs a RR scheme that is a variant of the traditional IP RR technique. As the RR information is placed at the beginning of the IP payload, the size of the payload increases as the IP packet passes several RR-enabled routers, and can cause unexpected packet fragmentation. This leads to a high processing overhead, or packet dropping in the worst case. Vulnerable to filter flooding attack. AITF also considers the filter flooding attack. Both Vgw and Agw limit filter receiving and sending rates. However, attackers can easily attack this technique by sending useless bogus filters using source address spoofing. Many required changes to the network infrastructure. All clients (both senders and recipients) need to understand the AITF protocol to adopt AITF. They need to send appropriate AITF response messages, and this can cause deployment difficulties.
based approaches, such as AITF, that does not adopt the filter scheduling policy. Key contributions of our work are threefold: 1) PFS is able to defend against both victim resource attacks and link resource attacks: the victim can receive up to 45% of legitimate traffic even if attackers attempt to saturate the link with attack traffic. 2) PFS propagates the filters to the best locations among filter routers: the effectiveness can be maximized when the filters are deployed on the filter router close to the attack source. PFS probes the origin of attack traffic and installs the filters close to attackers. 3) PFS adopts the filter scheduling policy to manage many received filters on filter routers that have limited resources: a filter router may receive many filters from victims, and PFS determines the best-k filters to maximize the blocking of undesired flows. The remainder of this paper is organized as follows. In Section II, we briefly explain the AITF architecture that forms the basis for our approach. Section III presents our problem definition and assumptions. Section IV explains how PFS works based on four phases. Section V determines the optimal PFS parameters. In Section VI, we analyze the PFS architecture and discuss potential threats and countermeasures. Our evaluation is presented in Section VII. Section VIII discusses existing DDoS defenses. Finally, Section IX presents our conclusions.
III. P ROBLEM D EFINITION In this section, we address the problems of filter-based approaches and assumptions of our work. A. Problems and Goals As shown in AITF challenges (viz., Sec. II-B), a filterbased approach needs to addresses several challenges to be a viable solution. We want to accomplish the following three properties: P1: Path identification. A victim should identify the path that the attack traffic traversed. For the path identification, intermediate routers are required to give additional information to enable reconstruction of the flow’s path for the victim. iTrace [6] and AITF utilize ICMP messages and a record route scheme to deliver the filter router’s information, respectively. However, since iTrace sends an ICMP traceback packet with low probability (1/20,000), iTrace cannot effectively detect attack paths, when attackers are widely distributed and send relatively small number of attack packets. If iTrace applies high probability to resolve the problem, then iTrace incurs bandwidth inefficiency and high overhead on routers due to generating many traceback packets. And, AITF’s method (record route) is impractical, as we discuss in Sec. II-B. Therefore, a filter-based approach should provide a practical method for path identification. P2: Filter propagation. Multiple routers can install filters, so called filter routers, on the attack path. In this case, the filter should be installed at the optimal location, which is the closest filter router to the attack source. Therefore, a filterbased approach should leverage filter propagation to maximize filtering performance. P3: Filter management. A filter router has limited resources for filters, and its CPU and memory cannot process the numerous filters efficiently. Therefore, a filter-based approach should address an efficient filter management method under its limited resources. Now, we define the filter scheduling problem that a successful filter-based approach has to solve: 1) how to practically identify attack paths, 2) how to propagate filters to the optimal
II. BACKGROUND : F ILTER - BASED DD O S D EFENSE In this section, we briefly overview filter-based DDoS defense. Of the many filter-based approaches [6], [18], [17], [26], Active Internet Traffic Filtering (AITF) [2], [3], which forms the basis for our work, is one of the most recent and complete approaches. We explain the AITF operation and several challenges that need to be addressed to make it viable in practice.
Fig. 1. AITF operation: the victim forwards filters using a record route scheme and requests an attacker to stop sending packets.
A. AITF’s Filter Operation The purpose of AITF is to defend against DDoS attacks that spoof the source IP address. It uses a record route (RR) scheme to identify the attack path and to generate a filter. Fig. 1 illustrates the way to block undesired flows using filter propagation. A victim sends a filter request to the victim’s gateway (Vgw ). Then, Vgw temporarily blocks the undesired flow and finds a border router located close to the attack source (Agw ). Vgw then sends the filter to Agw , termed a counterconnection. Finally, Agw requests the attacker to stop sending attack traffic. If the attacker keeps sending, Agw filters all traffic from the attacker.
10
Fig. 2. Phase 1: Filter routers (FR1, FR2 and FR3) probabilistically mark their addresses (1, 2 and 3). Phase 2: The victim collects the markings of FRs, creates filters by combining the markings, and sends the filters to FRs.
locations (filter routers), and 3) how to manage many filters to retain the most effective ones. Our goal is to devise a filterbased approach that addresses the filter scheduling problem.
Fig. 3. PFS utilizes 25 bits and creates three types of markings, S1, S2 and S3.
B. Assumptions We set several assumptions from the perspective of attackers, routers, and victims.
victim can identify which filter router is in charge of the undesired flow (P1). Second, a filter router receives marked packets from upstream filter routers. That is, a filter router can also identify the attack path and propagate filters to upstream filter routers (P2). Last, PFS performs a filter scheduling policy. Filter scheduling allows the filter router to retain the most effective filters depending on the attack situation. Accordingly, the filter router can efficiently use its limited resources (P3). PFS consists of four phases: 1) probabilistic packet marking, 2) filter invocation, 3) filter scheduling and propagation, and 4) filter revocation. In Phase 1, a filter router probabilistically marks its own IP address into the packet header. Then, in Phase 2, a victim collects and reconstructs the marking values to send a filter request. In Phase 3, the filter router receiving filter requests decides the best-k filters using a filter scheduling policy, and forwards the filters to upstream routers. Finally, when the attack stops, filters’ score corresponding to the attacks decrease and the corresponding filters are eventually evicted from the filter router, which is Phase 4. We now explain each phase in detail.
1) Attacker Ability: Packet spoofing. Attackers may spoof IP source address to make traceback difficult and ruin the defense architecture. In addition, attackers may generate forged filters to neutralize the defense architecture. They can change any values in filters, so that filter routers may block legitimate hosts. Filter flooding. Attackers may generate large numbers of filters to degrade the performance of filter routers. Attackers can flood the table with useless filters, since each filter router has limitations on the filter table size. No global attackers. Attackers cannot be global attackers. They cannot monitor every packet on every path. They only take partial information through many different paths and reassemble the information. 2) Router Ability: Limited resource. Routers have limited memory in which to store filters. Attackers may abuse this feature to fill the filter list with useless filters. Non-compromised routers. Attackers cannot compromise any routers or set up bogus routers. Even though it is possible to establish a bogus router, we assume that a vigilant network administrator can easily recognize who is not cooperating and is pretending to be good.
A. Phase 1: Probabilistic Packet Marking by a Filter Router V should know filter routers’ IP addresses to send a filter request from a victim (V) to filter routers; therefore, PFS applies PPM to identify which router is in charge of which flow. A filter router (FR) marks its unique information into IP headers of outgoing packets with probability p. In Fig. 2, FR1, FR2 and FR3 mark their addresses 1, 2 and 3, respectively. Here, the practical issue is how to obtain the marking space in the IP header. According to Dean et al. [9], an IPv4 packet has 25 unused bits, and PFS utilizes those unused bits for marking. Technically, we need a 32 bit space to mark FR’s address; therefore, we divide FR’s address into two parts: the first 16 bits (S1) and the last 16 bits (S2). Later, V reconstructs the two parts to reconstruct FR’s address. However, incorrect reconstructions can occur. In Fig. 2, for example, V may reconstruct incorrect FR’s IP address by combining S1 from FR1 with S2 from FR2. To prevent this problem, FR provides a checksum (CHK), which is a hash value computed based on the FR’s address and MAC (Message Authentication Code) . FR generates two MACs with a FR’s secret key computed over the destination IP address, and CHK can be changed depending on the MACs. Consequently, FR serves three types
3) Victim Ability: Undesired flow decision. Victims monitor traffic patterns and they can identify attack traffic. This is not a tough assumption, because servers already adopt such traffic monitoring and analyzing systems. Besides, to paralyze those servers, attack flows are supposed to distinctively show higher rates (pps or bps) than legitimate flows. IV. PFS D ESCRIPTION Considering the problems in Sec. III-A, our design principle to achieve the goal is as follows. First, PFS adopts Probabilistic Packet Marking (PPM). PPM is a well-known approach in IP traceback [6], [26]. In our work, we modify PPM by fragmenting an IP address to fit into the unused bits of the current IPv4 packet, such as the IP identification field, and adding checksum bits to achieve integrity. Consequently, a
11
of markings: S1 for the first 16 bits of FR IP address, S2 for the last 16 bits of FR IP address, and S3 for CHK. After collecting S1, S2, and S3, V verifies the reconstruction if H([F R(addr)]0−15 ||[F R(addr)]16−31 ||M AC1||M AC2) is equal to CHK in collected S3 (where H is a cryptographic hash function that outputs 23 bits). Fig. 3 illustrates how PFS marks an IP header. PFS needs the MACs for the following reasons. Assume that an attacker (A) knows the hash function for CHK, so that A can send the correct S3 to V. Additionally, FR is not widely deployed and marks the packet with low probability. In this case, A’s packets can easily reach V without being marked by any FRs, and A causes incorrect reconstruction using spoofed markings (explained in Section VI-B). Thus, PFS adds the MACs computed over a FR’s secret key and the destination IP address. As the MACs are dependent on the destination, A cannot find the MACs by sending packets to itself through the FR. However, it is only 12 bits (6 bits+6 bits). If the attacker sends various MACs using brute force, then V can suffer from incorrect reconstruction. Thus, PFS uses frequency analysis. We discuss the details of the frequency analysis in Phase 2. The flag field (2 bits) indicates the type of the marking. As there are only three types (S1, S2 and S3), we can use the second bit of S3’s flag as an additional checksum bit. Last, the PFS field (1 bit) checks if the packet is marked by FR.
B. Phase 2: Filter Invocation After V collects S1, S2 and S3 related to an undesired flow, V performs the reconstruction, verification, and transmission of the filter request, Req{A, V, CHK}, to the corresponding FR. In Fig. 2, we assume that V collects FR3’s markings first, and then sends a filter to FR3. If there is a single FR between A and V, V can easily reconstruct the markings. Conversely, in case of multiple FRs between A and V, as in Fig. 2, we have to consider a reconstruction failure problem. Reconstruction failure. V may fail to reconstruct due to the incorrect pair of S1 and S2 (e.g., reconstruct using S1 of FR1 and S2 of FR2). Besides, as mentioned in Phase 1, there is the possibility that A floods with fake markings to cause incorrect reconstructions. We adopt frequency analysis that counts the frequency of S1, S2 and S3, to resolve the problem. the number of S1, S2 and S3 fragments should be large for a correct S1, S2 and S3, since PFS uses probabilistic packet marking. Thus, V sorts collected S1, S2 and S3 based on frequency, and attempts to reconstruct by combining fragments S1, S2, and S3 with similar frequency. The number of S1, S2 and S3 from the same FR should be similar, no matter how many FRs exist between A and V, and irrespective of FR’s marking probability p. Even though the MACs are changed periodically, V can sense new MACs because new MACs eventually overwhelm old ones. If the reconstruction with the highest frequent S1, S2 and S3 fails, V resets the count of S1, S2 and S3 to 0. This is to avoid the selection of the same S1, S2 and S3 at the next reconstruction. This frequency analysis is also used for filter propagation in Phase 3.
Fig. 4. Phase 3: FR3 collects markings from FR1 and propagates filters to FR1. In addition, FR3 reorders filters according to their scores. Phase 4: FR3 evicts useless filters (low scored filters) from its filter table.
C. Phase 3: Filter Scheduling and Propagation by Filter Routers After FR receives filters from V, FR attempts to propagate the filters to its upstream routers after verifying filter reconstruction using the checksum CHK as in Phase 1. In practice, FR has limited resources to store filters, while FR may receive many filters from many victims. Therefore, FR should maintain the optimal filters that most effectively block attack traffic. This issue bears similarities to the page replacement problem in OS caches, as the best pages need to remain in the cache. The most popular policies are Least Frequently Used (LFU), Least Recently Used (LRU), and Adaptive Replacement Cache (ARC). According to Megiddo and Modha [19], ARC performs better than the others. However, these policies are for a benign system, such as an OS. Thus, we modify ARC to fit network environments that carry many malicious users, and design a filter scheduling policy, termed PFS-ARC, which considers both frequency and recency. Filter scheduling. Our scheduling policy (PFS-ARC) scores each filter depending on frequency and recency. Each FR maintains two lists for filters: ghost list and filter list. The ghost list stores suspicious filters. When FR receives a filter, it is initially stored in the ghost list. If the score of the ghost filter (the filter in the ghost list) exceeds a threshold, termed promotion threshold, then the ghost filter is promoted to the filter list, unless the filter list is full. If the filter list is full, the ghost filter’s score has to exceed the lowest score of the filter list to be promoted. FR blocks packets based on the filter list, and periodically computes scores for all filters in both the ghost and filter lists. A score (S) can be computed as follows. Let Sn (I) be a moving average for filter I, where n is the current time. Let Pn (I) be a score for I (initially P0 (I) = 0). t is a time window to compute Sn (I). For example, if t = 10, FR computes Sn (I) using the last ten Sn (I). Thus, the calculation of Sn (I) is: Pn−t (I) Pn (I) (1) + − γ, n n where γ denotes the penalty score to decrease the filter score, so the filter should be evicted, if it becomes useless (e.g., no attacks). Note that the eviction is for filter revocation, which is Phase 4. Pn (I) is computed by Eq.(2): Sn (I) = Sn−1 (I) −
Pn (I) = F · m + R · (tc − tp ),
(2)
where F denotes the weight of the frequency, and R is the weight of the recency. Moreover, m denotes how many times
12
Prob for V to receive a marking from a specific FR (%)
Prob for V to receive a marking from a specific FR (%)
7
The number of FRs b/w V and FR = 5 The number of FRs b/w V and FR = 10 The number of FRs b/w V and FR = 20
6
5
4
3
2
1
0 0
20
40
60
80
100
7
The number of FRs b/w V and FR = 5 The number of FR b/w V and FR = 10 The number of FR b/w V and FR = 20
6
5
4
3
2
1
0 0
Marking probability by FR (%)
20
40
60
80
100
Deployment rate (%)
Fig. 5. Optimal marking probability (p) changes as the number of FRs on the path to V (l) changes.
Fig. 6. Optimal deployment rate (d) changes as the number of FRs on the path to V (l) changes.
the filter is used, and tc and tp denote the current packet arrival time and the previous packet arrival time related to the filter. FR does not install a received filter immediately. Initially, FR stores the filter into the ghost list. If Sn (new f ilter) is higher than the lowest Sn (old f ilter) of a filter list, then the new filter is promoted to the filter list. FR can keep the best-k filters via score comparison. Filter propagation. Each FR performs the same procedures as V for the propagation to upstream FRs: collecting and reconstructing the markings. FR also uses frequency analysis to deal with the reconstruction failures. To summarize, FR conducts two procedures in Phase 3: filter scheduling to keep the best-k filters that maximize DDoS defense, and filter propagation to forward the filter to upstream FRs.
receives a marking from a specific FR. We can obtain the probability (δ) by Eq. (3). δ = {p · (1 − p)d·(l−1) } · d, f or 0 ≤ p, d ≤ 1,
(3)
where p denotes the marking probability by FR, and d and l represent the PFS deployment rate and the number of filter routers between V and FR, respectively. p · (1 − p)d·(l−1) denotes the probability that FR marks and the remaining of FRs on the path to V do not mark. Now, through Eq. (3), we analyze and determine the optimal values for p and d. B. Changes of Marking Probability First, we vary the marking probability (p) and fix the deployment rate (d = 30%). Fig. 5 shows that Higher p does not guarantee faster reconstruction. If p is very high, V only receives the markings from the last FR; therefore, the intermediate FR does not have a chance to forward its markings to V. High l also decreases δ, because the other FRs may overwrite the markings. In our analysis, l also implies the network size (the number of network nodes), because a larger network has higher l.
D. Phase 4: Filter Revocation The last phase is filter revocation. FR can remove a filter by two means: explicit revocation and implicit revocation. In explicit revocation, V sends revocation messages to filter routers. However, PFS needs more complex procedures, such as secure channel using key establishment to authenticate the revocation. For our work, therefore, PFS only considers implicit revocation, which is conducted by a filter scheduling policy. When FR periodically performs filter scheduling, Sn (I) is decreased by the penalty score (γ), as in Eq. (1). If the filter score is less than the promotion threshold, the filter is moved to the ghost list, and finally removed.
C. Changes of Deployment Rate Second, we vary the FR deployment rate in the network and fix the marking probability (p = 50%). Fig. 6 depicts that δ is decreasing, if there are too many FRs. This is due to a similar reason, as that in Section V-B; the various markings from various FRs can cause frequent reconstruction failure. From the two analyses, the changes of marking probability and deployment rate, we determine that there are optimal values for p and d, depending on the network size. We evaluate the effects of these values in Section VII.
V. D ETERMINING O PTIMAL PARAMETERS In this section, we determine the optimal parameters for marking probability (p) and deployment rate (d), because PFS effectiveness depends on these parameters. The values from this analysis are going to be used for DDoS simulation in Section VII. A. Probability that V Receives a Marking from a Specific FR
VI. S ECURITY A NALYSIS
The most important factor in PFS is how frequently V reconstructs the filter successfully so that V can quickly escape from attack traffic. This depends on the probability that V
In this section, we look into strategic attacks exploiting PFS architecture and discuss countermeasures.
13
A. Filter Flooding Attack There are two types of filter flooding: filter flash crowds and filter flooding attacks. Filter flash crowds mean that legitimate users send many legitimate requests to a specific filter router, like flash crowds. Conversely, in filter flooding attacks, attackers (A) intentionally send numerous filters to fill specific FRs with useless filters. Many filter-based approaches have not addressed this issue, but AITF (viz., Section II) employs rate limiting for filter generation to prevent it. However, A can easily break down this technique by sending useless filters using source address spoofing. In PFS, FR maintains the best-k filters and evicts useless filters implicitly. That is, the ghost list can fill with useless filters for a while, but the ghost list will not promote the useless filters to the filter list, unless A generates much traffic to promote the useless filters.
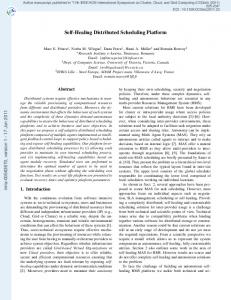
Fig. 7. Routeview topology consists of 1,000 nodes: 200 attackers, 200 legitimate hosts and 600 filter routers.
which provides various options for network settings. The last two simulations require large scale networks to observe the effectiveness of PFS, as PFS parameters are changing. Thus, we use the Portcullis simulator [23] for the last three simulations.
B. Packet Mark Spoofing A can intentionally insert forged marking values to lead to hash collision when V reconstructs. PFS adopts frequency analysis to resolve this problem, as mentioned in Section IV-B. In this, V and FR reconstruct with high frequency S1, S2 and S3. V receives various markings from A, and the number of genuine markings generated by FRs becomes higher than the number of A’s markings, because A should conduct brute force attack to cause hash collision, especially to break second preimage collision resistance1 .
A. Experiment Setup for Filter Scheduling and Filter Flooding We use a Routeview dataset [11] in April 2009 to construct an Internet-like network topology in NS-2. We extract a subgraph by breadth first search, which consists of 1,000 nodes: 200 attackers, 200 legitimate hosts and 600 filter routers. Fig. 7 shows the topology from the Routeview dataset. The legitimate user group sends packets with a lower rate than attackers do. We divide the attackers into two groups, Group A (100 attackers) and Group B (100 attackers). Three scenarios by attack strategies are as follows. Group A and B change the attack strategies using different rates (50 and 100 kbps), whereas the legitimate user group sends packets with the lowest rate (25 kbps). • Scn #1: Group A sends packets for 0.5 seconds at 100 kbps and stops sending. Next, Group B sends packets for 0.5 seconds at 50 kbps, and repeats this procedure. • Scn #2: Group A sends packets at 100 kbps. At the same time, Group B sends packets at 50 kbps. • Scn #3: Group A and B send packets at the same rate, 100 kbps. The experimental assumptions are as follows. • The delay between links is 20 ms, and the queue size of a router is sufficiently large, so that a router does not discard any packet due to the queue size. • Default marking probability is 10% (p = 0.1). • The sizes for the filter and ghost lists are both 100. • γ in Eq. (1) is 1; thus, the score of each filter is decreased by 1 per 20 ms. • The promotion threshold to promote from the ghost list to filter list is 10. • The timeout threshold to evict from the ghost list is 100 (=2 sec).
C. Source Address Spoofing PFS can block attack traffic regardless of source address spoofing. For example, in Fig. 2, A launches a source address spoofed DDoS attack imposing the legitimate user (L)’s address to V. Simultaneously, L also sends packets to V. Then, V can reconstruct three filters: Req{L, V, CHK(FR1)}2 , Req{L, V, CHK(FR2), and Req{L, V, CHK(FR3)}. Initially, FR3 can block the traffic coming from both A and L; however, soon, FR3 propagates the filter to FR1 and FR2. FR2 does not block genuine L’s traffic, because L’s traffic volume is insufficiently large to promote the filter to the filter list; whereas, FR1 blocks spoofed L’s traffic, because A generates attack traffic at a high rate. D. PFS Enhancement In order to effectively detect DDoS attacks, V needs to regularly monitor surrounding networks to identify who seems to be an authentic FR to quickly reconstruct filters. A can forge many packets to incur incorrect reconstructions with high probability. In this case, the ratio of PFS marked packets increases dramatically, and a network administrator or an ISP operator easily recognizes the abnormal situation. VII. E VALUATION We experiment with four simulations: filter scheduling, filter flooding, changes of marking probability, and changes of deployment rate. The first two simulations do not require a large scale network, but instead require adjusting the attacker’s strategy. Thus, we use NS-2 [21] for the first two simulations,
B. Determining the Filter Scheduling Policy First, we determine which filter scheduling policy performs best. As mentioned in Section IV-C, there are three candidates: LFU (a score determined by filter frequency), LRU (a score determined by filter recency), and PFS-ARC (a score determined by filter frequency and recency). The difference between the three policies is how to compute Pn (I) in Eq. (2). We set R to 0 for LFU, and set F to 0 for LRU. For PFS-ARC, we can vary both weights, F and R. We fix F as 1, and vary R to find the balance between F and R
1 It is also known as weak collision resistance: Given x, an attacker cannot find x! != x such that H(x) = H(x! ). 2 Note that Req{L, V, CHK(FR1)} denotes the filter request for FR1 to block the flow from L to V.
14
100
800 PFS-ARC LRU LFU
600
500
Fn (%)
60
400 40
300
200 20
The number of filter replacements
700 80
100
0
Scn#1 Scn#2 Scn#3
Scn#1 Scn#2 Scn#3
0
Fig. 8. PFS-ARC shows the lowest Fn (left), and replaces the filters relatively fewer times than LRU (right) does.
Fig. 9. AITF.
in Eq. (2). PFS-ARC shows the highest attack blocking ratio when F : R = 1 : 50 based on the experiments with three scenarios. This means that 1 score of recency is equivalent to 0.02 score of frequency. In Fig. 8, Fn (False negative) denotes the probability that V receives attack packets from attackers (effectiveness), and the number of replacements describes how frequently the policy replaces filters (overhead). We see that PFS-ARC > LRU > LFU in terms of the effectiveness and LRU > PFSARC > LFU in terms of the overhead. Therefore, PFS-ARC achieves higher performance with lower overhead than the other policies.
round denotes the time that a packet moves one hop in the Portcullis simulator. The experimental assumptions are as follows: • The link delay is 20 ms; thus, 1 round is 20 ms. • Attackers send 10 packets per round, while legitimate hosts send 1 packet per round. • Attackers insert random spoofed markings with 10% marking probability. If attackers generate too many marked packets, the victim can recognize packet mark spoofing. • The router queue size is 100 packets; thus, the queue handles 100 packets per round. • The filter scheduling parameters, such as filter size, F , R, γ, promotion threshold and timeout threshold are the same as the NS-2 simulation parameters.
C. Effectiveness under Filter Flooding Attacks Under the filter flooding attack, the three attack scenarios show similar results to the filter scheduling experiments. In Fig. 9, attackers begin the DDoS attack in 1 second, and transmit many useless filters in 2 seconds to cause the filter flooding attack. Φ is the filtering effectiveness, and is measured as follows. Φ = 1 − {(Fn + Fp )/2}, f or 0 ≤ Fn , Fp ≤ 1,
Filter flooding attack: PFS shows ≈ 44% higher effectiveness than
E. Changes of Marking Probability In Section V-B, we insist that PFS shows different effectiveness and has the optimal marking probability depending on the network size. In this experiment, we find the optimal marking probability based on our simulation topology. We vary the marking probability from 5% to 50%, and measure the attack traffic volume received from the victim. Fig. 10 illustrates that the victim receives the lowest attack traffic and the highest legitimate traffic, when p = 30%. p = 5 and p = 10% delivers too small a number of markings to the victim for filter reconstruction, and p = 50% delivers too many markings for the victim, so that reconstruction failures frequently occur. Interestingly, p = 5% shows similar protection to p = 10%. This means that the network administrator can reduce the marking probability in the normal situation, and temporarily increase the probability to maximize filter reconstruction. The reason that the lines in the figure show the thresholdstyle is due to link congestion. Even though FRs install many filters, link congestion may still occur. If sufficient filters are installed in a certain area to mitigate the link congestion, then the legitimate traffic from the area can reach to the victim.
(4)
where Fp (False positive) denotes the probability that FRs filter the packets from legitimate users. Fn is defined in Sec. VII-B. The result shows that PFS is unaffected by the filter flooding, since it employs a filter scheduling policy. After the PFS filter router selects the best-k filters, Φ increases. In AITF, it adopts the filters faster and seems to block successfully initially. However, after filter flooding occurs, AITF unconditionally drops the traffic irrespective of whether it is malicious or not. Consequently, PFS’s Φ (0.881) outperforms AITF’s one (0.485), because PFS attempts to maintain the best-k filters according to attack situations. D. Experimental Setup for Large Scale Simulations The Portcullis simulator reduces many functions compared to NS-2, but conversely provides large scale network simulations. We adopt a topology map from CAIDA Skitter probe result [8], that stores a router-level topology. The topology consists of 1,000 legitimate hosts, 5,000 attackers and 16,898 routers. It is a scale-up version of the topology in Fig. 7. One
F. Changes of Deployment Rate We experiment PFS with the changes of deployment rate (d) to simulate partial deployment. As shown in Section V-C,
15
100
70
marking probability = 30%, deployment rate = 10% marking probability = 50%, deployment rate = 10% marking probability = 10%, deployment rate = 10% marking probability = 5%, deployment rate = 10%
60
Legitimate traffic ratio (%)
Attack traffic ratio (%)
80
60
40
50
40
30
20
20 10
marking probability = 30%, deployment rate = 10% marking probability = 50%, deployment rate = 10% marking probability = 10%, deployment rate = 10% marking probability = 5%, deployment rate = 10%
0 0
10
20
30
40
50
60
70
80
90
0 100
0
10
20
30
40
Time (Sec.)
50
60
70
80
90
100
Time (Sec)
Fig. 10. As filters are propagated to the network, the victim receives less attack traffic (left), while receiving more legitimate traffic (right). 30% marking probability shows higher effectiveness than 10% and even 50%. That is, 30% is the optimal probability for the victim to reconstruct filters. 100
70
marking probability = 30%, deployment rate = 10% marking probability = 30%, deployment rate = 30% marking probability = 30%, deployment rate = 50%
60
Legitimate traffic ratio (%)
Attack traffic ratio (%)
80
60
40
50
40
30
20
20 10
marking probability = 30%, deployment rate = 10% marking probability = 30%, deployment rate = 30% marking probability = 30%, deployment rate = 50%
0 0
10
20
30
40
50
60
70
80
90
0 100
Time (Sec.)
0
10
20
30
40
50
60
70
80
90
100
Time (Sec)
Fig. 11. As filters are propagated to the network, the victim receives less attack traffic (left), while receiving more legitimate traffic (right). 50% deployment rate achieves lower effectiveness than 10% and 30%. 50% deployment rate causes more reconstruction failures, as there are too many filter routers on the path to the victim.
Fig. 11 describes that too many FRs, such as d = 50%, can cause more confusion for the victim. The victim receives many different markings from various FRs, and thus cannot create filters efficiently. This property comes from probabilistic marking, and it benefits early adopters, despite of the low deployment rate. When d = 10% and d = 30%, the result shows similar protection; however, when d = 30%, the victim creates more filters and faster (viz., Table I to compare the number of filters sent). In addition, we measure the reconstruction effectiveness: how many reconstruction failures or successes occur, how frequently incorrect reconstruction happens, and how many filters are sent by the victim and FRs. Table I shows the statistics based on the experiments regarding the changes of p and d. There are many reconstruction failures due to the diverse markings by FRs. However, using the optimal p and d, 30% for each, PFS can drop 59.5% of attack traffic. That is, the victim receives about 60% of legitimate traffic. Moreover, as shown in the number of filters by FRs, FRs propagate filters in the network, so attack traffic can be blocked earlier. Incorrect reconstructions occur, because attackers generate spoofed markings. However, the probability is very low (0.008%), and the filters created by incorrect reconstructions do not match
16
any FRs’ addresses in the network. Consequently, the incorrect reconstruction does not cause negative effects. VIII. R ELATED W ORK Much research has considered filter-based DoS defense. iTrace [6] utilizes ICMP messages to forward information of filter routers to victims. It generates additional packets to traceback attack paths and incurs message authentication issues. Pushback by Mahajan et al. [18] proposed a scheme combining a rate limiting and a filter-based approach. However, it does not know where the pushback routers are deployed, so partial deployment is not possible. StopIt [17] also adopts the undesired flow filtering idea at routers. StopIt installs dedicated servers to forward the filters to the attacking areas. However, a network should set up a StopIt server that knows who deploys StopIt in other domains. Moreover, the StopIt server could be a target of a single point attack. Another basic mechanism in PFS is packet marking. Since Savage et al. [26] proposed the packet marking for IP traceback, much related research has proceeded [1], [4], [5], [27]. Their common purpose is how to identify the path of a specific packet. Path identification (Pi) [28] defends against DDoS attacks. Pi verifies packets using path information and modifies TTL values. Router-based
TABLE I PFS SHOWS 20.03% RECONSTRUCTION SUCCESS RATE IN THE EXPERIMENT (p IS THE MARKING PROBABILITY AND d IS THE DEPLOYMENT RATE ). Simulation p = 5%, d = 10% p = 10%, d = 10% p = 30%, d = 10% p = 50%, d = 10% p = 30%, d = 30% p = 30%, d = 50% Average(%)
Reconstruction failure 267,573 876,778 401,043 381,217 575,523 120,818 618,387 (79.94%)
Reconstruction success 68,044 97,723 15,557 123,774 231,280 394,130 155,084 (20.05%)
Incorrect reconstruction 12 16 66 37 134 86 59 (0.008%)
distributed packet filtering (DPF) [22] also utilizes routing information to determine whether a packet follows an expected path. DPF focuses on the source spoofing attack, rather than the DoS attack. BASE [16] was proposed as an anti-spoofing mechanism. Each router marks MAC (Message Authentication Code) using hash chaining into IP packets, and a router discards packets marked with incorrect values. Capability-based defense approaches restrict the bandwidth of each sender. A receiver grants the traffic that it desires to receive, before a sender establishes a connection. Abraham Yaar et al. [29] presented SIFF, in which an end-host selectively stops individual flows. It divides network traffic into two classes, privileged and unprivileged, to protect privileged traffic from DDoS attacks. In TVA by Yang et al. [30], it attempts to achieve more completed design and protections for possible attacks, such as flooding the setup channel, and exhausting the router state. IX. C ONCLUSION We presented the Probabilistic Filter Scheduling (PFS) architecture to defeat DDoS attacks. We utilized Probabilistic Packet Marking (PPM) and a filter scheduling policy. PFS propagates the filters to optimal filter routers located closer to the attack source. Our proposed filter scheduling policy (PFSARC), which considers the filter weights between frequency and recency, maintains the best-k filters that maximize the effectiveness. We evaluated PFS with the existing filter-based approach. PFS shows 44% higher effectiveness than AITF, since PFS is resistant to filter flooding attacks. ACKNOWLEDGMENTS This research was supported by the Seoul R&BD Program (WR080951). Additionally, this research was supported by CyLab at Carnegie Mellon under grants DAAD19-02-1-0389, W911NF-09-1-0273, and MURI W 911 NF 0710287 from the Army Research Office. R EFERENCES [1] H. Aljifri, M. Smets, and A. P. Pons, “IP traceback using header compression,” Computers & Security, vol. 22, no. 2, pp. 136–151, 2003. [2] K. J. Argyraki and D. R. Cheriton, “Active internet traffic filtering: Realtime response to denial-of-service attacks,” in USENIX Annual Technical Conference, General Track, 2005, pp. 135–148. [3] ——, “Scalable network-layer defense against internet bandwidthflooding attacks,” IEEE/ACM Trans. Netw., vol. 17, no. 4, pp. 1284– 1297, 2009. [4] C. Bai, G. Feng, and G. Wang, “Algebraic geometric code based IP traceback,” in Performance, Computing, and Communications, 2004 IEEE International Conference on, 2004, pp. 49–56. [5] A. Belenky and N. Ansari, “On deterministic packet marking,” Computer Networks, vol. 51, no. 10, pp. 2677–2700, 2007. [6] S. Bellovin, M. Leech, and T. Taylor, “The ICMP traceback message,” in IETF Internet Draft, Oct. 2001.
17
Filters sent by the victim 309 351 555 647 911 704 580 (0.37%)
Filters sent by filter routers 67,723 97,356 14,936 123,090 230,253 393,340 154,446 (99.55%)
[7] R. Braga, E. Mota, and A. Passito, “Lightweight DDoS flooding attack detection using NOX/OpenFlow,” in The 35th IEEE Conference on Local Computer Networks (LCN), 2010. [8] CAIDA Skitter, http://www.caida.org/tools/measurement/skitter/. [9] D. Dean, M. K. Franklin, and A. Stubblefield, “An algebraic approach to IP traceback,” ACM Trans. Inf. Syst. Secur., vol. 5, no. 2, pp. 119–137, 2002. [10] Digital Chosun, “Hackers threaten cyber money sites,” Oct. 2007, http: //english.chosun.com/w21data/html/news/200710/200710100013.html. [11] D.Meyer, “University of Oregon Route Views archive project,” 2006, http://archive.routeviews.org. [12] Jose Nazario, “DDoS Floods in Belarus: Political Motivations,” Jun. 2009, http://asert.arbornetworks.com/2009/06/ ddos-floods-in-belarus-political-motivations/. [13] J. Kang, Z. Zhang, and J. bin Ju, “Protect e-commerce against DDoS attacks with improved D-WARD detection system,” in IEEE International Conference on e-Technology, e-Commerce, and e-Services (EEE), 2005, pp. 100–105. [14] Korea Times, “Hacking Attacks,” Jul. 2009, http://www.koreatimes.co. kr/www/news/opinon/2009/07/137 48133.html. [15] ——, “Government websites hit by new DDoS attack,” Mar. 2011, http: //www.koreatimes.co.kr/www/news/nation/2011/03/117 82505.html. [16] H. Lee, M. Kwon, G. Hasker, and A. Perrig, “BASE: an incrementally deployable mechanism for viable IP spoofing prevention,” in ASIACCS, 2007, pp. 20–31. [17] X. Liu, X. Yang, and Y. Lu, “To filter or to authorize: network-layer DoS defense against multimillion-node botnets,” in SIGCOMM, 2008, pp. 195–206. [18] R. Mahajan, S. M. Bellovin, S. Floyd, J. Ioannidis, V. Paxson, and S. Shenker, “Controlling high bandwidth aggregates in the network,” Computer Communication Review, vol. 32, no. 3, pp. 62–73, 2002. [19] N. Megiddo and D. S. Modha, “ARC: A self-tuning, low overhead replacement cache,” in FAST, 2003. [20] J. Mirkovic, G. Prier, and P. L. Reiher, “Attacking DDoS at the source,” in ICNP, 2002, pp. 312–321. [21] NS-2, “The Network Simulator - ns-2,” 2008, http://www.isi.edu/nsnam/ ns. [22] K. Park and H. Lee, “On the effectiveness of route-based packet filtering for distributed DoS attack prevention in power-law internets,” in SIGCOMM, 2001, pp. 15–26. [23] B. Parno, D. Wendlandt, E. Shi, A. Perrig, B. M. Maggs, and Y.-C. Hu, “Portcullis: protecting connection setup from denial-of-capability attacks,” in SIGCOMM, 2007, pp. 289–300. [24] V. Paxson, “Bro: a system for detecting network intruders in real-time,” Computer Networks, vol. 31, no. 23-24, pp. 2435–2463, 1999. [25] M. Roesch, “Snort: Lightweight intrusion detection for networks,” in LISA, 1999, pp. 229–238. [26] S. Savage, D. Wetherall, A. Karlin, and T. Anderson, “Practical Network Support for IP Traceback,” in Proc. of ACM SIGCOMM, Aug. 2000, pp. 295–396. [27] M. Sung and J. Xu, “IP traceback-based intelligent packet filtering: A novel technique for defending against internet DDoS attacks,” IEEE Trans. Parallel Distrib. Syst., vol. 14, no. 9, pp. 861–872, 2003. [28] A. Yaar, A. Perrig, and D. X. Song, “Pi: A path identification mechanism to defend against DDoS attack,” in IEEE Symposium on Security and Privacy, 2003, pp. 93–. [29] ——, “SIFF: A stateless internet flow filter to mitigate DDoS flooding attacks,” in IEEE Symposium on Security and Privacy, 2004. [30] X. Yang, D. Wetherall, and T. E. Anderson, “TVA: a DoS-limiting network architecture,” IEEE/ACM Trans. Netw., vol. 16, no. 6, pp. 1267– 1280, 2008. [31] D. K. Y. Yau, J. C. S. Lui, F. Liang, and Y. Yam, “Defending against distributed denial-of-service attacks with max-min fair server-centric router throttles,” IEEE/ACM Trans. Netw., vol. 13, no. 1, pp. 29–42, 2005.