International Institute for Aerospace Survey and Earth Sciences (ITC),. Department ... Land-cover classi cation from multispectral imagery is essentially a matter of .... The rather disappointing results of the latter classi cation (tables 3 and 4) can.
int. j. remote sensing, 2000, vol. 21, no. 12, 2389–2402
Probabilistic image classi cation using geological map units applied to land-cover change detection S. DE BRUIN Wageningen Agricultural University, Department of Environmental Sciences, P.O. Box 339, 6700 AH Wageningen, The Netherlands; e-mail: sytze.debruin@staŒ.girs.wau.nl
and B. G. H. GORTE International Institute for Aerospace Survey and Earth Sciences (ITC), Department of Geoinformatics, PO Box 6, 7500 AA Enschede, The Netherlands (Received 28 September 1998; in nal form 1 March 1999) Abstract. This paper describes how probabilistic methods provide a means to integrate analysis of remotely sensed imagery and geo-information processing. In a case study from southern Spain, geological map units were used to improve land-cover classi cation from Landsat TM imagery. Overall classi cation accurracy improved from 76% to 90% (1984) and from 64% to 69% (1995) when using strati cation according to geology combined with iterative estimation of prior probabilities. DiŒerences between the two years were mainly due to extremely dry conditions during the 1995 growing season. Per-pixel probabilities of class successions and entropy values calculated from the classi cation’s posterior probability vectors served to quantify uncertainty in a post-classi cation comparison. It is concluded that iterative estimation of prior probabilities provides a practical approach to improve classi cation accuracy. Posterior probabilities of class membership provide useful information about the magnitude and spatial distribution of classi cation uncertainty.
1.
Introduction Land-cover classi cation from multispectral imagery is essentially a matter of deciding about a pixel’s cover class on the basis of a limited amount of spectral information. The popular Maximum Likelihood (ML) decision rule requires that evidential support for each class be expressed in probabilistic terms. It assigns a pixel to the class having the largest probability of membership, thus minimizing the risk of misclassi cation (Duda and Hart 1973). Strahler (1980) showed how additional information can be eŒectively incorporated into ML classi cation through the use of modi ed prior probabilities. This is particularly attractive when there is spectral overlap among classes, i.e. when classi cation based on spectral data alone is ambiguous. In an experiment involving classi cation of natural vegetation, the use of prior probabilities related to elevation and aspect classes resulted in a considerably improved classi cation accuracy over that obtained with spectral data alone (Strahler 1980). Janssen and Middelkoop (1992) used a similar approach to incorporate historical land-cover data stored in a International Journal of Remote Sensing ISSN 0143-1161 print/ISSN 1366-5901 online © 2000 Taylor & Francis Ltd http://www.tandf.co.uk/journals
2390
S. de Bruin and B. G. H. Gorte
Geographical Information system (GIS) and knowledge on crop rotation schemes in the classi cation procedure. They also reported improved classi cation accuracy when prior probabilities were used. Gorte and Stein (1998) developed an extension to ML classi cation that uses classi cation results to iteratively adjust prior probabilities related to spatial strata. Their procedure does not require the priors to be known at the outset, but estimates them from the image to be classi ed. In this study we used the procedure to incorporate geological map units into land-cover classi cation from Landsat TM imagery. In spite of its dependence upon incomplete knowledge, standard output of ML classi cation disregards the uncertainty involved in class assignment, as it usually comprises only the most likely class of membership (Foody et al. 1992). Measures of accuracy of a classi ed image are conventionally derived from an error matrix that compares classi ed cover types with sampled ground data (e.g. Rosen eld and Fitzpatrick-Lins 1986, Congalton 1991). These measures give insight into the overall classi cation accuracy or the performance on a per-class basis but fail to represent spatial distribution of classi cation uncertainty (Klinkenberg and Joy 1994). This also applies if the accuracy measures are used to simulate errors for dynamic display in a classi ed image (see Fisher 1994). Conversely, the posterior probabilities used in ML classi cation provide information on the uncertainty in assigning individual pixels to a class (Foody et al. 1992, Van der Wel et al. 1998). Storage of these probabilities is particularly valuable if classi ed images are to be used for further analysis in a GIS. Uncertainties present in the inputs to an analysis will accumulate and aŒect the end-result (Heuvelink et al. 1989, Heuvelink 1998, Burrough and McDonnell 1998). For example, a common method to detect land-cover change is to compare independently classi ed images by so-called post-classi cation comparison (Singh 1989, Jensen et al. 1997, Miller et al. 1998). Obviously, every error in the individual classi cations will also be present in the change map. The posterior probability vectors of compared classi cations can be used to answer GIS queries about the degree of uncertainty attached to mapped land-cover changes, as we will show in this paper. The objective of this study is to demonstrate: 1. The use of strati cation combined with iterative estimation of prior probabilities to improve classi cation accuracy. 2. The use of posterior probability vectors to represent uncertainty in image classi cations and in the results of subsequent analysis. We present a case study from Alora, southern Spain in which a GIS-stored geological map was used to improve classi cation of Landsat TM imagery acquired in 1984 and 1995. Posterior probabilities of class membership were fed back to the GIS to visualize uncertainty in a post-classi cation comparison. 2. Alora case study 2.1. Study area The study area covers approximately 110 km2, centred on the village of Alora in Malaga province, southern Spain ( gure 1). It is within the Betic Cordillera, the westernmost of the European Alpine mountain ranges, and includes part of the drainage basin of the river Guadalhorce. Elevation varies between 80 and 735 m above sea level. The climate is dry Mediterranean with an average annual precipitation of 531 mm and a dry period of 4.5 months (De Leon et al. 1989).
Probabilistic classi cation applied to change detection
2391
Figure 1. Geological map (generalized from Instituto Geolo´gico y Minero de Espan˜a (IGME) (1978) and Instituto Tecnolo´gico GeoMinero de Espan˜a (ITGE) (1991)) superimposed on a recti ed Landsat TM 4-5-3 colour composite (13 May 1995) of the study area. Coordinates (m) correspond to UTM zone 30.
2392
S. de Bruin and B. G. H. Gorte
Agricultural land use in the study area is closely related to geology and topography, as can be observed in gure 1. Below is a general description of this relationship; the colours in parentheses refer to the Landsat TM 4-5-3 colour composite shown in gure 1. Cultivation of surface-irrigated citrus (red) is concentrated on the level oodplain and terraces of the river Guadalhorce. The increased use of drip irrigation in recent years, however, has promoted citrus cultivation on sloping landforms (Siderius and Elbersen 1986). Rainfed arable cropping ( light shades) is the principal land use on gentle slopes and rolling hills in the ysch deposits of Cretaceous and Tertiary age. High parts and steeper slopes in this landscape are often covered by olive (greyish green). The mountains in Miocene conglomerates and Palaeozoic metamorphic rocks are partly used to grow olive, almond and other tree crops (greyish green and brownish purple). Other parts have herbaceous vegetation with shrubs and scattered trees (green), and are used for extensive grazing. On the peridotites and serpentinites a reforestation project is being carried out. The apparent relation between land cover and geology in the study area suggests that the use of geological map data may improve the accuracy of land-cover classi cation from remotely sensed imagery. 2.2. Imagery We used Landsat TM images acquired on 3 September 1984 and 13 May 1995. The 1984 image was registered to the 1995 image using a rst order polynomial transformation with nearest neighbour resampling. The root mean square error (RMSE) of the 10 used control points was below 0.35 pixels in x and y direction. Additionally we digitized 20 ground control points (GCP) to model the relation between 1995 image coordinates and UTM zone 30 coordinates with a rst order polynomial. The GCPs had an east–west RMSE of 13 m and a north–south RMSE of 10 m. Image processing was restricted to TM bands 3, 4 and 5, as the software implementing the k-nearest neighbour algorithm (Gorte 1998, Gorte and Stein 1998) handled a maximum of three spectral bands. This band subset is widely accepted as standard in vegetation studies (Conese and Maselli 1993). However, the use of more spectral bands would probably have resulted in better classi cation accuracy. 2.3. Geological map units We used a generalized geological map derived from the digitized Alora (Instituto Geolo´gico y Minero de Espan˜a (IGME) 1978) and Ardales (Instituto Tecnolo´gico GeoMinero de Espan˜a (ITGE) 1991) map sheets as an additional information source for land-cover classi cation. Generalization of the original map information served to reduce the number of units, to increase their minimum size and to harmonize the level of detail of the two adjoining map sheets. The generalization process comprised ve subsequent steps: 1. Sandstone ridges smaller than 25 ha were merged with adjacent units belonging to the tecto-sedimentary complex. 2. Thematic description was generalized to the nine classes listed in the legend of gure 1; boundaries between similar units were removed. 3. The narrow oodplains of two minor tributaries and the upstream part of the river Guadalhorce were eliminated.
Probabilistic classi cation applied to change detection
2393
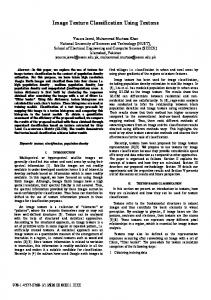
4. Piedmont units smaller than 25 ha were merged with adjacent upslope units. 5. Remaining units smaller than 25 ha were merged with the adjacent unit having the largest shared border. The resulting coverage, consisting of 31 units (see gure 1), was rasterized and registered to the 1995 Landsat TM image. 2.4. L and-cover classi cation and change analysis The 1984 and 1995 images were classi ed independently using iteratively estimated prior probabilities per geological unit as described in the appendix. We used 1995 digital land-cover data provided by the ConsejerÌ´a de Medio Ambiente of the Junta de AndalucÌ´a (Sevilla) and eldwork executed in March 1998 to collect 87 reference sites with known land cover. These constituted the reference data for classi cation of the 1995 image. Reference data for the 1984 classi cation were derived from this set by retaining only those sites being consistent with land-cover maps of 1977 (Ministerio de Agricultura 1978) and 1987 (Junta de AndalucÌ´a 1995, supplied in digital format by the Centro Nacional de Informacio´n Geogra´ ca, Madrid ). Some boundaries were modi ed to t eld geometry as apparent from the 1984 image. Both sets of reference data were split up into a training set and an evaluation set. Table 1 details the numbers of pixels used for training and evaluation. Note that the 1984 classi cation scheme did not include forest clearings and replants. That is because according to the 1977 and 1987 surveys this class was previously not present within the study area. The classi ed images were submitted to change analysis by means of postclassi cation comparison. We used equations (3) to (6) (appendix) to calculate per-pixel probabilities of class successions and to assess the uncertainty in the postclassi cation comparison as expressed by Shannon’s entropy measure (Shannon and Weaver 1949, Applebaum 1996). 3. Results 3.1. L and-cover classi cations Figure 2 shows the land-cover classi cations from the 1984 and 1995 imagery obtained by the iterative procedure. The error matrices corresponding to these
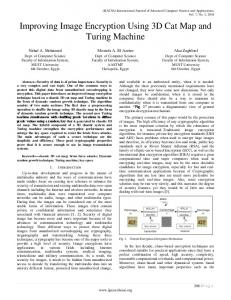
Table 1. Numbers of pixels used for training and evaluation. 1984 Land-cover class Citrus Arable land Built-up area Olive Almond mixed with other woody species Herbs with shrubs and scattered trees Open coniferous woodland Dense woodland Clearings and replants Gravel and sand without vegetation
1995
Training
Evaluation
Training
Evaluation
715 1190 251 695 621 865 259 95 — 72
346 476 70 400 128 220 119 — — —
709 1190 179 761 433 1007 216 128 174 86
461 476 173 460 320 739 220 — 102 21
Figure 2.
Land-cover classi cations from the 1984 and 1995 Landsat TM imagery.
2394 S. de Bruin and B. G. H. Gorte
Probabilistic classi cation applied to change detection
2395
classi cations are given in table 2 and table 3. Overall accuracy of the 1984 classi cation improved from 76%, with equal priors, to 90% when using strati cation according to generalized geology combined with iterative estimation of prior probabilities (table 4). Overall accuracy of the 1995 classi cation improved from 64% to 69% (table 4). The rather disappointing results of the latter classi cation (tables 3 and 4) can be largely attributed to extremely dry conditions during the 1995 growing season. Most rainfed arable crops failed early in the season, leaving the soil for the greater part without vegetative cover. Also the sparse undergrowth in olive plantations gave Table 2. Error matrix, user’s accuracy (UA) and producer’s accuracy (PA) of the 1984 classi cation. Reference data (evaluation set) Classif. Data
Cit
Cit Ara Bld Oli Alm Her Opn Den Gra
346
Total PA (%)
346 100
Ara
Bld
Oli
412 17 26
17 37 4 1 2
9
19 2
9
476 87
70 53
Alm
Her
Den
Gra
Total 346 440 54 409 157 215 127 0 11
2
366
12 21 185
128 9 16
400 92
Opn
1 7 111
128 100
220 84
119 93
0
0
UA (%) 100 94 69 89 82 86 87
1759
Cit, citrus; Ara, arable crops; Bld, built-up area; Oli, olive; Alm, almond mixed with other woody species; Her, herbs with shrubs and scattered trees; Opn, open coniferous woodland; Den, dense woodland; Gra, gravel and sand without vegetation. Overall accuracy 5 90%. Table 3. Error matrix, user’s accuracy (UA) and producer’s accuracy (PA) of the 1995 classi cation. Reference data (evaluation set) Classif. Data
Cit
Cit Ara Bld Oli Alm Her Opn Den Clr Gra
458
Total PA (%)
461 99
Ara
Bld
465 2 9
56 49 59 3 5
3
Oli
Alm
5 209 163 16 54 13
Her
Opn Den
Clr
173 28
Total 463 840 53 266 560 426 236 6 111 11
110 292 12 15
12 242 348 24
1
3
6
12
5 183 6 20
2 14
2 5 4
74
1 476 98
Gra
10 460 35
320 91
739 47
220 83
0
102 73
21 48
2972
Clr, clearings and replants; other codes as in table 2. Overall accuracy 5 69%.
UA (%) 99 55 92 61 52 82 78 67 91
2396
S. de Bruin and B. G. H. Gorte
Table 4. Overall accuracy of the 1984 and 1995 classi cations with and without using iteratively estimated prior probabilities per geological delineation. Overall accuracy (%) Land-cover classi cation 1984 1995
Equal priors
Iteratively estimated priors
76 64
90 69
rise to much re ection from bare soil. This resulted in spectral overlap and thus confusion among the classes of arable crops, olive and built-up areas (see table 3). 3.2. Post-classi cation comparison Comparison of the classi cations shown in gure 2 suggests that in the period 1984–1995 large areas with olive and open coniferous woodland changed into other land-cover types. Such inference must however be interpreted with great care, since it is based on uncertain classi cations. Figure 3 shows the uncertainty in the postclassi cation comparison as expressed by Shannon’s entropy measure (equation (4) in the appendix). It appears that, in particular, the areas that seem to have lost olive cover are characterized by high entropy values, i.e. much uncertainty regarding the class succession. In contrast, sites that according to both classi cations were covered by citrus mostly have entropy values close to zero. Users of land-cover information may be interested in the level of con dence they can put on particular mapped land-cover changes. As an example, gure 4 shows maps of sites that have lost olive cover (a) and dense woodland or open coniferous woodland (b), with probabilities exceeding 0.85. The per-pixel probability of woodland in the 1984 and 1995 classi cations was calculated as P(Woodland| x) 5 P(Dense woodland | x) 1 P(Open coniferous woodland | x), according to equation (5) in the appendix. Note that apart from a somewhat larger cluster near the north-west corner of the study area, highly probable loss of olive cover is mapped as a dispersed pattern of small patches and isolated pixels. This challenges the hypothesis that large areas with olive changed into other land-cover types in the period 1984–1995. Conversely, sites with highly probable loss of woodland are more clustered in an area approximately 4 km north-west of the village of Alora. 4.
Concluding remarks The case study reported here exempli es how probabilistic methods provide a means of integrating geo-information processing and analysis of remotely sensed imagery. GIS-stored map units were used to improve probabilistic classi cation of remotely sensed images. Feedback of posterior probabilities to the GIS served to analyse uncertainty in the classi cation results. The classi cation accuracies we obtained using iterative estimation of prior probabilities con rm the usefulness of the method as reported in other studies (Gorte and Stein 1998, Gorte 1998). The latter studies were carried out in the Netherlands and involved strati cation on the basis of postcode areas and automatically extracted image segments. Our use of post-classi cation comparison was intended solely as a straightforward example of further use of image classi cation results. It is certainly not promoted as the most appropriate method of change detection (cf. Singh 1989, Bruzzone and
Probabilistic classi cation applied to change detection
2397
Figure 3. Uncertainty in the post-classi cation comparison as expressed by Shannon’s entropy measure.
Serpico 1997, Jenssen et al. 1997). Other types of analysis can also bene t from uncertainty information regarding classi ed remotely sensed images. For example, Monte Carlo simulation (e.g. Fisher 1991, Heuvelink 1998) allows one to model propagation of uncertainty through virtually any kind of analysis. In summary we conclude that: E
Iterative estimation of prior probabilities after strati cation according to map units carrying information relevant to the classi cation theme provides a practical approach to improve classi cation accuracy.
2398
S. de Bruin and B. G. H. Gorte
Figure 4. Sites having a probability exceeding 0.85 to have lost olive (a) and woodland (b) in the period 1984–1995.
E
Posterior probabilities of class membership provide useful estimates of the magnitude and spatial distribution of local uncertainty in classi cation results. Such estimates are particularly valuable if classi ed images are to be used for further analysis in a GIS (cf. Foody et al. 1992).
Acknowledgments The digital 1995 land-cover data were kindly provided by the ConsejerÌ´a de Medio Ambiente of the Junta de AndalucÌ´a, Sevilla. We thank Dr W.G. Wielemaker (Wageningen Agricultural University) for his contribution to the 1998 eldwork. Appendix Probabilistic image classi cation using map units Consider an image classi cation problem in which each pixel is to be assigned to one of a set of n mutually exclusive and exhaustive classes. The ML decision rule
Probabilistic classi cation applied to change detection
2399
assigns each pixel to the class C , i ×{1, ..., n}, having the largest posterior probability i of membership given the spectral values contained in its feature vector x. Calculation of the posterior probabilities, P(C | x), is based on Bayes’ Rule: i P(C | x) 5 i
P(x | C )P(C ) i i , P(x)
(1)
where P(x | C ) is the conditional probability that occurs, given class C , P(C ) is the i i i prior probability of C , irrespective of x, and P(x) 5 Sn P(x | C )P(C ) (Duda and i i= 1 i i Hart 1973). In a supervised classi cation the conditional probabilities, P(x | C ), are estimated i from training data for the n classes. Usually sample means and (co-)variances are used as the parameters of normal class probability densities. In this study we used the non-parametric k-nearest neighbour method to derive P(x | C ) (Fukunaga and i Hummels 1987, Therrien 1989, Gorte and Stein 1998). In the absence of prior knowledge about the terrain, all classes are initially assumed to be equally probable, i.e. P(C ) 5 1/n Yi ×{1, ..., n}. However, classi cation i accuracy is improved if estimates of the area covered by each class C are incorporated i into the classi cation process (Strahler 1980). Such strategy can be combined eŒectively with strati cation of the image on the basis of suitable map units. A prerequisite is that correct class area estimates for each stratum are available. Therefore, we employed a procedure developed by Gorte and Stein (1998) that allows the assessment of relative class areas directly from the image being classi ed. Starting from equal prior probabilities for all classes, equation (1) is repeatedly evaluated, each time substituting the set of prior probabilities by the normalized sums of posterior probabilities from the previous iteration step. Iteration stops when none of the priors changes by more than some pre-established tolerance threshold. Gorte and Stein (1998) proved that the procedure converges to statistically correct area estimates. Post-classi cation comparison and uncertainty Post-classi cation comparison is the most commonly used method of land-cover change detection (Jensen et al. 1997). It deals with independently classi ed images (Singh 1989, Bruzzone and Serpico 1997). In other words, the posterior probability vector of a pixel at time t2 is calculated irrespective of the class or feature vector at the previous time, t1: P(C
j,t2
| C , x , x ) 5 P(C | x ). i,t1 t1 t2 j,t2 t2
(2)
Hence, given the feature vectors x and x , the probability of a succession of classes t1 t2 at the level of the individual pixel is given by P(C
i,t1
,C
| x , x ) 5 P(C | x )P(C | x ). j,t2 t1 t2 i,t1 t1 j,t2 t2
(3)
Shannon’s information-theoretic entropy (Shannon and Weaver 1949, Applebaum 1996) provides a suitable measure of the per-pixel uncertainty in a post-classi cation comparison (cf. Maselli et al. 1994, Foody 1996, Van der Wel et al. 1998). With m and n representing the number of classes at t1 and t2, Shannon’s entropy (expressed
S. de Bruin and B. G. H. Gorte
2400 in bits) is calculated as H5 Õ
n
m
P log (P ) ij 2 ij
j= 1 i= 1 m n 5 Õ P(C | x ) log (P(C | x )) Õ P(C | x ) log (P(C | x )), (4) i,t1 t1 2 i,t1 t1 j,t2 t2 2 j,t2 t2 i= 1 j= 1 where P 5 P(C , C | x , x ), and P log (P) 5 0 for P 5 0. Equation (4) shows ij i,t1 j,t2 t1 t2 2 that the entropy of a post-classi cation comparison equals the sum of the entropies of the individual classi cations. The value of H ranges from 0, in the case of total certainty about a class succession, to log (mn) in the case where all class successions 2 have equal probability, 1/mn, i.e. complete uncertainty. It renders the amount of additional information (in bits) that is required to change ambiguity regarding the class succession into de nite assignment. Note that entropy expresses uncertainty according to the vectors of posterior probabilities. It does not involve uncertainty concerning the probabilities; these are assumed to be correct (Gorte 1998). Rather than being confronted with the overall classi cation uncertainty on a pixel basis, users of land-cover information may be interested in the per-pixel probability of a particular land-cover transition. If such transition concerns a succession of single classes from the classi cation scheme, its probability is readily calculated using equation (3). If, on the other hand, the transition involves composite classes, the pixel’s probabilities of membership to these composites have to be calculated prior to multiplication. For example, a monitoring agency may require per-pixel estimates of the probability of deforestation over the past 10 years. Yet, the classi cation scheme it employs has separate classes for coniferous forest (C ) and deciduous forest 1 (C ). A class for both types of forest would correspond to the union of C and C , 2 1 2 i.e. C nC . If C and C are mutually exclusive classes, the probability of membership 1 2 1 2 to their union is calculated as (5) P(C nC | x) 5 P(C | x) 1 P(C | x). 1 2 1 2 The probability of absence of a class C equals the probability of membership to the ± i complement of that class, C : i ± (6) P(C | x) 5 1 Õ P(C | x). i i References Applebaum, D., 1996, Probability and Information: An Integrated Approach (Cambridge: Cambridge University Press). Bruzzone, L., and Serpico, S. B., 1997, An iterative technique for the detection of land-cover transitions in multitemporal remote sensing images. IEEE T ransactions on Geoscience and Remote Sensing, 35, 858–867. Burrough, P. A., and McDonnell, R. A., 1998, Principles of Geographic Information Systems (Oxford: Oxford University Press). Conese, C., and Maselli, F., 1993, Selection of optimum bands from TM scenes through mutual information analysis. ISPRS Journal of Photogrammetry and Remote Sensing, 48, 2–11. Congalton, R. G., 1991, A review of assessing the accuracy of classi cations of remotely sensed data. Remote Sensing of Environment, 37, 35–46. De Leon, A., Arriba, A., and De La Plaza, M., 1989, Caracterizacio´n Agroclima´tica de la Provincia de Ma´laga (Madrid: Ministerio de Agricultura, Pesca y Alimentacio´n). Duda, R. O., and Hart, P. E., 1973, Pattern Classi cation and Scene Analysis (New York: John Wiley & Sons).
Probabilistic classi cation applied to change detection
2401
Fisher, P. F., 1991, Modelling soil map-unit inclusions by Monte Carlo simulation. International Journal of Geographical Information Systems, 5, 193–208. Fisher, P. F., 1994, Visualization of the reliability in classi ed remotely sensed images. Photogrammetric Engineering and Remote Sensing, 60, 905–910. Foody, G. M., 1996, Approaches for the production and evaluation of fuzzy land cover classi cations from remotely-sensed data. International Journal of Remote Sensing, 17, 1317–1340. Foody, G. M., Campbell, N. A., Trodd, N. M., and Wood, T. F., 1992, Derivation and applications of probabilistic measures of class membership from the maximumlikelihood classi cation. Photogrammetric Engineering and Remote Sensing, 58, 1335–1341. Fukunaga, K., and Hummels, D. M., 1987, Bayes error estimation using Parzen and k-NN procedures. IEEE T ransactions on Pattern Analysis and Machine Intelligence, 9, 634–643. Gorte, B. G. H., 1998, Probabilistic Segmentation of Remotely Sensed Images, ITC Publication Series No. 63 (Enschede: International Institute for Aerospace Survey and Earth Sciences). Gorte, B. G. H., and Stein, A., 1998, Bayesian classi cation and class area estimation of satellite images using strati cation. IEEE T ransactions on Geoscience and Remote Sensing, 36, 803–812. Heuvelink, G. B. M., 1998, Error Propagation in Environmental Modelling with GIS (London: Taylor & Francis). Heuvelink, G. B. M., Burrough, P.A., and Stein, A., 1989, Propagation of errors in spatial modelling with GIS. International Journal of Geographical Information Systems, 3, 303–322. ~ a (IGME), 1978, Mapa Geolo´gico de Espan˜a 1: Instituto GeoloÁ gico y Minero de Espan 50.000, No. 1052 (Alora) (Madrid: Servicio de Publicaciones Ministerio de Industria). ~ a (ITGE), 1991, Mapa Geolo´gico de Espan˜a 1: Instituto TecnoloÁ gico GeoMinero de Espan 50.000, No. 1038 (Ardales) (Madrid: ITGE). Janssen, L. L. F., and Middelkoop, H., 1992, Knowledge-based crop classi cation of a Landsat Thematic Mapper image. International Journal of Remote Sensing, 13, 2827–2837. Jensen, J. R., Cowen, D., Narumalani, S., and Halls, J., 1997, Principles of change detection using digital remote sensor data. In Integration of Geographic Information Systems and Remote Sensing, edited by J. L. Star, J. E. Estes and K. C. McGwire (Cambridge: Cambridge University Press), pp. 37–54. Junta de AndaluciÁ a, 1995, Usos y Coberturas Vegetales del Suelo en AndalucÌ´a. Seguimiento a trave´s de Ima´genes de Sate´lite (Sevilla: Junta de AndalucÌ´a, ConsejerÌ´a de Medio Ambiente). Klinkenberg, B., and Joy, M., 1994, Visualizing uncertainty: succession or misclassi cation? GIS/L IS Proceedings 25–27 October 1994, Phoenix, Arizona (Bethesda: American Society for Photogrammetry and Remote Sensing), pp. 494–503. Maselli, F., Conese, C., and Petkov, L., 1994, Use of probability entropy for the estimation and graphical representation of the accuracy of maximum likelihood classi cations. ISPRS Journal of Photogrammetry and Remote Sensing, 49, 13–20. Miller, A. B., Bryant, E. S., and Birnie, R. W., 1998, An analysis of land cover changes in the Northern Forest of New England using multitemporal Landsat MSS data. International Journal of Remote Sensing, 19, 245–265. Ministerio de Agricultura, 1978, Evaluacio´n de Recursos Agra´rios – Mapa de Cultivos y Aprovechamiento, Map sheets 1038 (Ardales) and 1052 (Alora) (Madrid: Ministerio de Agricultura). Rosenfield, G. H., and Fitzpatrick-Lins, K., 1986, A coe cient of agreement as a measure of thematic classi cation accuracy. Photogrammetric Engineering and Remote Sensing, 52, 223–227. Shannon, C. E., and Weaver, W., 1949, T he Mathematical T heory of Communications (Urbana: University of Illinois Press). Siderius, W., and Elbersen, G. W. W., 1986, Drip irrigation as a method for soil and water conservation in sloping areas: A case study from Malaga province, Spain. In L and
2402
Probabilistic classi cation applied to change detection
Evaluation for L and Use Planning and Conservation in Sloping Areas—International Workshop, Enschede, T he Netherlands, 17–21 December 1984, edited by W. Siderius (Wageningen: International Institute for Land Reclamation and Improvement), pp. 263–289. Singh, A., 1989, Digital change detection techniques using remotely-sensed data. International Journal of Remote Sensing, 10, 989–1003. Strahler, A. H., 1980, The use of prior probabilities in maximum likelihood classi cation of remotely sensed data. Remote Sensing of Environment, 10, 1135–1163. Therrien, C. W., 1989, Decision, Estimation and Classi cation (New York: John Wiley & Sons). Van der Wel, F. J. M., Van der Gaag, L. C., and Gorte, B. G. H., 1998, Visual exploration of uncertainty in remote sensing classi cation. Computers and Geosciences, 24, 335–343.