Probabilistic Lossy Counting: An efficient algorithm for finding heavy hitters Xenofontas Dimitropoulos IBM Zurich Research Lab
[email protected]
Paul Hurley IBM Zurich Research Lab
[email protected]
ABSTRACT Knowledge of the largest traffic flows in a network is important for many network management applications. The problem of finding these flows is known as the heavy-hitter problem and has been the subject of many studies in the past years. One of the most efficient and well-known algorithms for finding heavy hitters is lossy counting [29]. In this work we introduce probabilistic lossy counting (PLC), which enhances lossy counting in computing network traffic heavy hitters. PLC uses on a tighter error bound on the estimated sizes of traffic flows and provides probabilistic rather than deterministic guarantees on its accuracy. The probabilistic-based error bound substantially improves the memory consumption of the algorithm. In addition, PLC reduces the rate of false positives of lossy counting and achieves a low estimation error, although slightly higher than that of lossy counting. We compare PLC with state-of-the-art algorithms for finding heavy hitters. Our experiments using real traffic traces find that PLC has 1) between 34.4% and 74% lower memory consumption, 2) between 37.9% and 40.5% fewer false positives than lossy counting, and 3) a small estimation error.
1.
INTRODUCTION
Network operators are interested in the heavy hitters of a network, i.e., the traffic flows responsible for most bytes or packets. This information is useful for a number of common applications such as identifying denial of service (DoS) attacks, monitoring traffic growth trends, provisioning network resources and link capacities, and warning heavy network users. In addition, computing heavy hitters has applications in other disciplines. Search engines compute heavyhitter queries, namely frequent user queries, in order to optimize caching for these queries, whereas dynamic content providers keep track of the most frequently-clicked advertisements and prefer posting these advertisements to increase their revenues. Thus, in the past years significant research efforts have been spent on developing efficient heavy-hitter algorithms. An efficient and well-known heavy-hitter algorithm is lossy counting. In this work we introduce probabilistic lossy counting (PLC), which improves lossy counting for finding network traffic heavy hitters. PLC changes the error bound on the estimated size of an arbitrary traffic flow, relaxing the deterministic guarantees of the bound from lossy counting. In effect, the probabilistic error bound makes PLC less conservative in removing state for flows of small size. Given that flows of small size account for the majority of
Andreas Kind IBM Zurich Research Lab
[email protected]
network traffic flows, this modification reduces drastically the required memory for computing heavy hitters. In addition, PLC finds fewer false-positive heavy hitters than lossy counting and achieves a low estimation error on the size of heavy-hitters (although slightly higher than that of lossy counting). We evaluate PLC using two sets of traffic traces collected from different networks. We compare its performance with two state-of-the-art algorithms, namely lossy counting and multistage filters [14], and find that PLC exhibits substantially better performance in important evaluated metrics. In particular, the memory consumption of PLC is between 37.3% and 74% lower than that of lossy counting and between 34.4% and 48.8% lower than that of multistage filters. In addition, PLC reduces the number of false positives of lossy counting by 37.9% and 40.5%. The estimation error of PLC would be expected to be higher than that of lossy counting. In practice, we find that the estimation error is only slightly higher and remains below 0.09% and below 0.0008% for 70% of the heavy hitters in our experiments. Finally, we find that PLC and multistage filters exhibit similar performance in terms of estimation error and numbers of false positives. We structure the remaining of this paper as follows. In the next section, we discuss background information. Then in Section 3 we review the related work. In Section 4 we introduce and describe PLC. We evaluate the performance of the algorithm and compare to lossy counting and multistage filters in Section 5. Finally, in Section 6 we conclude and describe future directions.
2.
BACKGROUND
The problem of finding heavy hitters can be defined as given a stream of elements, find those with a frequency above a user-selected threshold. Each distinct element represents a different flow and a sequence of identical elements represent bytes or packets of a flow. A flow is typically defined as the set of packets that have common values in one or more packet-header fields. The most common flow definition is a five-tuple of the following packet-header fields: source and destination IP addresses, source and destination port numbers, and protocol number. A straightforward approach to solving the heavy-hitter problem is to store each element identifier with a corresponding counter monitoring the number of occurrences of the element. Then, sorting the elements according to their counters trivially gives the most frequent elements. In many practical scenarios this simple solution is not
useful. Data streams have often a very large number of distinct elements, which results in overwhelming and unpredictable memory requirements for storing element identifiers and counters. Consider the case of a NetFlow collector that computes the traffic flows that generated the most traffic over a period of a month. In a small enterprise network, the number of unique five-tuple flows over a period of a month is close to 100 million, which corresponds to 2.5 GBytes of memory for storing 136-bit flow identifiers and 64-bit counters. The large memory requirements prohibit the use of the simple solution in NetFlow collectors and in general in systems computing heavy hitters over data streams with many distinct elements. Also, note that using disk to store (a subset of) the flow identifiers and counters severely impacts performance and is unsuitable when fast processing is important. For these reasons techniques to computing heavy hitters using fixed or bounded memory resources have been investigated. A characteristic of these is that they, in principle, cannot find the exact heavy hitters. As it has been shown [3] that one cannot find the exact frequency of heavy hitters using memory resources sublinear to the number of distinct elements. Instead, memory-efficient techniques approximate the heavy hitters of a data stream. The approximation typically lies in that the frequency of an element is estimated and the computed heavy hitters may include false positives. Lossy counting [29] is an efficient and well-known algorithm for finding heavy hitters. The algorithm has the following high-level operation. It splits an input stream of elements into fixed-size windows and processes each window sequentially. For each element in a window, it inserts an entry into a table, which monitors the number of occurrences of the elements, or, if the element is already in the table, it updates its frequency. At the end of each window, the algorithm removes elements of small frequency from the table. The table maintains a small number of entries and can, at any given point in time, determine the heavy hitters of the input data stream. In lossy counting, an important parameter for each distinct element identifier in the table is its error bound. The error bound (stored in the table) reflects the potential error on the estimated frequency of an element due to possible prior removal(s) of the element from the table. Its importance lies in its use in removing elements from the table – an element with a small error bound is more likely to be removed from the table than an equal-frequency element having a large error bound is. In Section 4, we exploit this property together with the characteristics of network traffic flow sizes to drastically improve on the performance of lossy counting.
3.
RELATED WORK
The work by Estan et al. [14] introduced novel algorithms for computing network traffic heavy hitters using limited memory resources. These provide an alternative to NetFlow sampling. The authors proposed to focus flow accounting on heavy-hitter flows in order to deal with the scalability problems of accounting for all flows. Keys et al. [22] described algorithms that compute, at streaming rates, sources or destinations of many flows. These source and destination-based heavy-hitter algorithms were implemented in the CoralReef [23] traffic monitoring system that passively inspects packets on high-speed links. A set of stud-
ies by Duffield et al. [10, 11, 12, 13] introduced techniques for sampling flow records generated by NetFlow or other flow accounting technologies. The techniques assign a higher sampling probability to heavy-hitter flows and create a sample of flow records from which it is then possible to estimate the size of arbitrary subsets of the original unsampled data. Heavy-hitter algorithms are available in generic data stream management systems (DSMS), namely Gigascope [8], which enable custom processing of traffic data streams, typically at the cost of worse performance than specialized traffic monitoring systems. The described papers highlight that the problem of computing heavy hitters appears in different network elements, e.g., routers, passive sniffers, NetFlow collectors, and DSMSs, and in different time scales. Devices like routers or sniffers, which are directly attached to a link, compute heavy hitters over short time scales of seconds or minutes, whereas NetFlow collectors and DSMSs typically compute heavy hitters over longer time scales of days, weeks, or even months. Despite the differences in the time scales, the formulation of the heavy-hitter problem and the qualitative requirements in the different settings remain the same. Current heavy-hitter algorithms rely on counting, hashing, or sampling techniques. Manku and Motwani [29] introduced lossy counting, which is a counting-based algorithm for identifying heavy hitters. Karp et al. [21] and independently Demaine et al. [9] introduced the Frequent algorithm, which uses a fixed set of counters for finding heavy hitters and requires two passes over a data stream. The first pass identifies candidate heavy hitters, while the second finds the exact frequency of the candidates. In addition, the Probabilistic-InPlace [9] and Space-Saving [30] algorithms employ counting techniques to find heavy hitters. In general, counting-based algorithms use 1) a fixed or bounded number of counters for tracking the size of frequent elements and 2) a condition for periodically deleting or reallocating counters of infrequent elements. Counting algorithms have low per-element processing overhead, as they only require incrementing a counter in a hash table, and a potentially high periodic housekeeping that may involve sorting and deleting counters. Hashing-based heavy-hitter algorithms have been proposed in a number of studies [2, 18, 19, 16, 7, 24, 6]. These works all use variants of the same underlying data structure called a sketch1 , which is an one or two-dimensional array of hashbuckets. Sketches bear similarities to the well-known Bloom filters. They use fixed memory resources to estimate the frequency of an arbitrary element of a data stream and provide probabilistic guarantees on the estimation error. Sketches have a number of applications in networking problems, namely, in estimating the flow-size distribution of traffic streams [25, 34], in identifying anomalies [24, 32, 27], and in traffic accounting [14]. Sophisticated sampling techniques have also been explored by Gibbons and Matias [17], Demaine et al. [9], Manku and Motwani [29], and Kamiyama and Mori [20]. Sampling techniques reduce the necessary memory resources and the processing overhead for identifying heavy hitters. On the other hand, they typically exhibit a lower estimation accuracy. A number of works have studied related problems. Zhao et 1
A number of different names for describing (variations of) the same data structure exist in the literature, with sketch being most common.
4. 4.1
PROBABILISTIC LOSSY COUNTING Observations leading to PLC
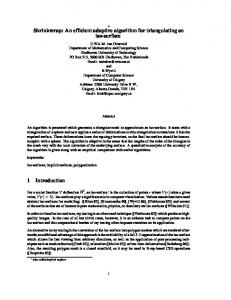
The error bound associated with each element inserted in the table in lossy counting is used in determining which elements to remove from the table. An element is removed if the sum of its frequency and error bound is less than or equal to a given threshold. This condition results in elements with a large error bound remaining in the table over many windows. The number of entries in the table is analogous to the queue occupancy problem. When elements stay in the table for more (fewer) windows, then according to Little’s law [28], the average size of the table increases (decreases). Thus, the value of the error bound has a direct impact on the memory consumption of the algorithm. The main improvement of PLC over lossy counting is to make the error bound substantially smaller than the deterministic error bound of lossy counting, providing probabilistic guarantees. As a result, elements stay in the table for fewer windows and PLC has a lower memory consumption. The probabilistic error bound guarantees that with a desired probability 1 − δ, where δ ¿ 1, the error on the frequency of an element is smaller than the bound. We used lossy counting to compute the heavy-hitter flows in a stream of NetFlow records captured in an enterprise network. Each unique five-tuple flow is represented by a distinct data-stream element. Figure 1 illustrates the cumulative error distribution of elements inserted in the table in the 400-th and 1000-th windows. Note that potential error on the frequency of an element is the result of possible prior removal(s) of the element from the table. The deterministic bound and the 95-percentile of the two error distributions are marked. The 95-percentile indicates a possible value for the probabilistic error bound corresponding to δ = 0.05. The error of approximately 70% of the elements is equal to zero, whereas the error of more than 90% of the elements is significantly smaller than the deterministic error bound. In addition, in both distributions the 95-percentile is smaller than half of the error bound. The shape and 95-percentile of the error distributions denote that a probabilistic error bound can be substantially smaller than a deterministic error bound. Network traffic data contain many short-lived flows of small size. The NetFlow trace2 used for the experiment shown in Figure 1, had 98.9% of flows that were smaller 2 We describe the NetFlow traces we use for our experiments in Section 5.
0.35 window 400 window 1000 deterministic bound 95-percentile
0.3 0.25 CCDF
al. [35] and Venkataraman et al. [33] introduced data streaming algorithms for finding sources or destinations that communicate with many other distinct destinations or sources. Papagiannaki et al. [31] examined the dynamics of large traffic flows and evaluated the viability of exploiting such flows for traffic engineering. Chadi et al. [5] examined the problem of ranking flows from collected traffic samples and found that high sampling rates are necessary to guarantee correct rankings. Finally, Babcock and Olson [4] introduced algorithms for the distributed version of the top-k problem, in which multiple data streams are observed at different vantage points and the purpose is to minimize communication overhead between vantage points for finding the globally k most frequent elements.
0.2 0.15 0.1 0.05 0 0
200
400
600 error
800
1000
Figure 1: Error distribution of elements entering the table at windows 400 and 1,000, 95-percentile of error distribution, and deterministic error bound of lossy counting. Note, that the deterministic bound is significantly larger than the 95-percentile. The data stream is a NetFlow trace, which we describe in the evaluation section. than 100 packets. Small flows occupy entries in the table of lossy counting. Consider, for example, a small flow of 100 packets that enters the table at some window. Lossy counting assigns a large error bound to the flow and keeps it in the table for 100 consecutive windows. In general, lossy counting keeps any flow of m packets in the table for m windows. Assigning a smaller error bound to the flow results in keeping the flow in the table for fewer windows. Since there is a large number of small flows in network traffic traces, a decrease in the error bound can drastically reduce the number of table entries. Thus using a probabilistic instead of a deterministic error bound has the potential to substantially reduce the memory consumption of the algorithm.
4.2
PLC Description
Formally, a data stream is a sequence of elements e1 , e2 , . . . coming from a set E. A traffic data stream can be mapped into a stream of elements by 1) associating a unique element with each different flow and 2) repeating multiple copies of the appropriate element to denote the packets or bytes of a flow. If N is the length of the input stream at some given point and s a value in (0, 1), then a heavy-hitter algorithm seeks to find the elements with frequency larger than sN . PLC splits an input stream into fixed-size windows of w = d1/²e elements, where ² is an error parameter (² ¿ 1). Each window is indexed with an integer i such that 1 ≤ i ≤ dN/we. The table of counters is initially empty. The windows are processed sequentially, and each element e is checked whether it is already in the table. If it is not, the estimated frequency cˆ of the element is initialized to one, and a new table entry (e, cˆ, ∆), where ∆ is the error bound on cˆ, is inserted. If e is already in the table, its estimated frequency cˆ is incremented by one. At the end of each window, PLC deletes entries from the table for which cˆ + ∆ ≤ i. Given a heavy-hitter query with a threshold s, the algorithm returns all elements with cˆ + ∆ ≥ sN . We summarize PLC in Algorithm 1. Discussion. Removing an element from the table can
introduce a subsequent error in its estimated frequency. If a removed element later re-enters the table, then its new frequency does not reflect the amount removed earlier. Obviously, this error can only underestimate the true frequency of an element, as a counter is only incremented when a corresponding element is observed. We prove in Appendix A that the true frequency c of an element in the table is bounded by cˆ ≤ c ≤ cˆ + i with probability 1 − δ. In other words, i = N/w = ²N is a probabilistic bound on the estimation error associated with any element. The algorithm has an overall error bound ²N , whereas each element in the table has an individual error bound ∆. In Lemma 3 we prove that ∆ ≤ i = ²N . Accordingly, given a heavy-hitter query, the algorithm returns elements in the table with cˆ ≥ (s − ²)N . The returned elements include 1) true heavy hitters with frequency larger than sN and 2) possible false positives with a true frequency between (s − ²)N and sN . In theory PLC has a small probability of returning a false negative, i.e., the algorithm may omit a heavy hitter. A false negative occurs if the error of an element exceeds the probabilistic error bound. The probability of false negatives can be made arbitrarily small by controlling the δ parameter. In practice false negatives are unlikely, which is consistent with our experiments in the evaluation section that did not reveal any false negative. As we prove in Appendix A, PLC has the same memory bounds as lossy counting. The memory bound is 1/² log(²N ) for arbitrary data streams and 7/² for data streams in which the low-frequency elements appear uniformly at random, which is a property known to characterize real-world data streams [29]. In addition, the bound is close to 2/² [26] for data streams that exhibit Zipfian distributions.
We formulate the problem of finding the probabilistic error bound ∆ on the estimated frequency cˆ of an element as follows. An element inserted in the table can have an error due to prior removal(s) of the element from the table. The error of the element is equal to its number of occurrences before it was last inserted in the table. Let X be a random variable denoting the error of an element that is inserted at some point in the table. Formally,we want to find an error bound ∆ that satisfies P r(X > ∆) ≤ δ, where δ is some small probability, say 0.05. To find ∆, we exploit the empirical observation that the size of network traffic flows follows a Zipfian distribution3 [14]. As such, given its simplicity, and relation to the Zipfian distribution, we use the power-law cumulative distribution [1]. If Y is a random variable that denotes the true frequency of an element, then P r(Y > y) = αy β , where α (α ≤ 1) and β are parameters of the power-law distribution. The error associated with elements inserted in the table is equal to the frequency of these elements. In addition, all elements inserted in the table at window i have true frequency smaller or equal to i − 1 with probability 1 − δ (cf. Lemma 2 in Appendix A). From these ˛ two observations, it follows that P r(X > x) = P r(Y > x˛Y ≤ i − 1). The last expression relates the error of elements entering the table with the true frequency of these elements. The true frequency of an element is now assumed to be described by a power-law distribution. Using the expression of the powerlaw distribution and that α, P r(Y > y) ≤ 1 we get: ˛ P r(X > x) = P r(Y > x˛Y ≤ i − 1) P r(i − 1 ≥ Y > x) P r(Y ≤ i − 1) P r(Y > x) − P r(Y > i − 1) = 1 − P r(Y > i − 1) =
Algorithm 1: Pseudo-code of PLC Input: Stream of elements e Input: Error parameter ² w = d1/²e; D = {}; j = 0; i = 0; ∆ = 0; forall e do if e has an entry in D then D ← (e, cˆ + 1, ∆); else D ← (e, 1, ∆); end j++; if j == w then ∆ = ComputeDelta ; forall (e, cˆ, ∆) in D do if cˆ + ∆ ≤ i then delete (e, cˆ, ∆) from D; end end j = 0; i++; end end
4.3
Probabilistic Error Bound
=α
xβ − (i − 1)β xβ − (i − 1)β ≤ . β 1 − α(i − 1) 1 − (i − 1)β
(1)
Setting the right side of Equation (1) to a small probability δ and solving for x = ∆ yields: ∆=
p β
δ(1 − (i − 1)β ) + (i − 1)β
(2)
Equation (2) gives a closed form for computing the probabilistic error bound ∆ for data streams with power-law frequency distributions. The next problem necessary to address is the computation of the power-law parameter β used in Equation (2) for calculating the probabilistic error bound ∆. With probability 1 − δ, the table contains all the elements with true frequency larger than i − 1. The frequency distribution of these elements is: ˛ P r(Y > y ˛Y > i−1) = P r(Y > y)/P r(Y > i−1) = y β /(i−1)β Observe that this frequency distribution follows a powerlaw with the same parameter β as the overall frequency distribution of a data stream. Consequently, we can estimate β on-line by fitting a power-law on the frequency distribution 3 In Appendix B we discuss how deviations from the Zipfian distribution affect the performance of PLC.
of elements in the table with cˆ > i − 1. This approach has the limitation of using the estimated frequencies cˆ instead of the true frequencies c for computing β. In practice, our evaluation in Section 5 shows that the estimated frequencies are almost identical to the true frequencies with the error being very small. For this reason, using the estimated instead of the true frequencies for computing β introduces a negligible error. In summary, PLC 1) processes a data stream as described in Algorithm 1; 2) at the beginning of each window uses Equation (2) to compute the probabilistic error bound ∆ of each new element that will be inserted in the table during the window; and 3) periodically estimates the parameter β by fitting a power-law on the estimated frequencies of elements with cˆ ≥ i − 1.
4.4
Dimensioning
The only user-selected parameter of the algorithm is the window length w or equivalently the error parameter ², as w = d1/²e. The choice of w affects the memory consumption and the estimation accuracy of the algorithm. The error bound of PLC is a function of w, whereas the empirical memory consumption of the algorithm is linearly dependent on w. This is because a larger window results in observing a larger number of distinct elements within a window and thus the number of table entries and the memory consumption increase. In addition, the error parameter ² determines the overall error bound of the algorithm ²N . We describe three approaches that can be used to select a value of w. One option is to use the available memory resources for computing heavy hitters and the memory bound of the algorithm to derive a value for w. Setting the memory bound to the available memory resources and solving for w gives a parameter choice that guarantees the algorithm will not exceed the available memory resources. This approach is simple and provides strong guarantees on memory consumption. On the other hand, there is the limitation that the empirical memory consumption of PLC is significantly lower than the memory bound. As a result, PLC will not fully use the available memory resources for computing heavy hitters and the system will be over-provisioned. A second option is to empirically evaluate the memory consumption of the algorithm in the target environment using training data. In the evaluation section we show that, and explain why, the memory consumption of PLC achieves its maximum in the first few windows and then decreases with time. Using training data, one can thus measure the maximum memory consumption of the algorithm for different values of w. Selecting the value of w that results in maximum memory usage close to the available memory resources addresses the over-provisioning problem of the first option. One limitation is that it relies on training data for the target environment and requires conducting experiments to determine w. A third option is to select the error parameter ² based on a desired bound on estimation accuracy. For example, a practitioner seeking to find heavy hitters with frequency larger than sN can select an appropriate value of ² so that the bound on the estimation error ²N is small compared with the threshold for heavy hitters sN . The choice of one of the three methods for dimensioning PLC depends on the priorities and requirements of a system designer. The first and third choice provide strong guaran-
Table 1: Statistics of Enterprise and Datacenter datasets.
Dataset Date Duration NetFlow packets Flow records Unique flows Unique source IPs Unique destination IPs
Enterprise 2006-05-22 one hour 7,628 234,931 113,281 7,801 9,578
Datacenter 2006-11-01 two hours 75,162 2,158,637 1,468,221 108,511 110,741
tees on the memory consumption and estimation accuracy of the algorithm, whereas the second choice utilizes better available memory resources and tailors the operation of the algorithm to the specifics of the target environment.
5.
EVALUATION
In this section, we evaluate the performance of PLC and compare it with that of lossy counting and of multistage filters. Datasets. Our experiments used two NetFlow traces. The first, which we call Enterprise, was collected from the network of the IBM Zurich Research Laboratory. It hosts approximately 400 employees and at least as many networked workstations. NetFlow data are collected at the two border routers of the network and sent to a NetFlow collector. The second trace, which we call Datacenter, comes from a data center that hosts a large number of high-volume websites. The data center serves between 300 and 1,600 flows per second and approximately 30 thousand distinct client IP addresses are observed within five minutes of normal business hours. We summarize the statistics of the Enterprise and Datacenter traces in Table 1. Metrics. We evaluate the memory consumption of the three algorithms. We monitor 1) the number of table entries of PLC and lossy counting at the beginning and end of each window, i.e., after and before removing small flows, and 2) the total memory usage of a multistage filter and report the memory usage in terms of equivalent number of PLC table entries. The second set of experiments evaluates the estimation accuracy of the algorithms. We periodically issue a heavyhitter query, compute the relative estimation error (i.e., the difference between the true and estimated size of a flow normalized by the true size of the flow) of each flow returned, and find the average error over all returned flows. The third metric evaluates the prevalence of false positives. We periodically issue a heavy-hitter query and compute the false positives ratio (FPR), which is the ratio of false-positive heavy hitters to the total number of returned heavy hitters.
5.1 Comparison with lossy counting Figure 2 compares the memory consumption of PLC and of lossy counting (LC). Subfigures 2(a) and 2(b) correspond to the Enterprise trace, whereas Subfigures 2(c) and 2(d) correspond to the Datacenter trace. In all the experiments, the window length parameter w was set to 100, 000. As expected, PLC exhibits a lower memory consumption than
10000 max mean LC
5000 0 0
Number of table entries
max mean LC 0
100 200 300 Window index
(c) LC algorithm and Datacenter trace.
max mean PLC
20000 15000 10000 5000 0
20 40 60 80 100 Window index
(a) LC algorithm and Enterprise trace. 80000 70000 60000 50000 40000 30000 20000 10000 0
Number of table entries
15000
0
20 40 60 80 100 Window index
(b) PLC algorithm and Enterprise trace.
Number of table entries
Number of table entries
20000
80000 70000 60000 50000 40000 30000 20000 10000 0
max mean PLC
0
100 200 300 Window index
(d) PLC algorithm and Datacenter trace.
Figure 2: Memory consumption comparison of PLC and lossy counting (LC) algorithms. The plots depict the number of table entries versus the window index for the Enterprise and Datacenter datasets. lossy counting. In particular, using the Enterprise trace, the average and maximum number of table entries of PLC were 37.3% and 21.7% lower than the corresponding numbers of lossy counting. Using the Datacenter trace, the memory savings of PLC in terms of average and maximum number of table entries were 74% and 38.1%, respectively. The difference in the number of table entries of the two algorithms occurs because the algorithms use a different error bound ∆. Assume a flow of 100 packets that enters the table at window 1,000. This flow is small and does not belong to the heavy hitters. Lossy counting assigns a large deterministic ∆ = 999 and the flow remains in the table for 100 windows, i.e., until window i = 1, 099, at which time the removal condition cˆ + ∆ ≤ i is satisfied. On the other hand, PLC assigns a smaller ∆ that is equal to 136.5 (assuming β = −0.9 and δ = 0.01). The flow-removing condition is then satisfied at the end of the window when the flow enters the table. Consequently, the flow remains in the table only for a single window. Consider a short flow to be one that enters the table at some point in time but is not in the table at the end of an experiment. These account for 90% and 98% of the flows in the Enterprise and Datacenter traces, respectively. Significant is the average number of windows a short flow is in the table. In the Enterprise trace, short flows occupy a table entry for an average of 3.72 windows with PLC and of 7.49 windows with lossy counting. Similarly, in the Datacenter trace they are in the table for an average of 1.98 windows with PLC and of 10.51 windows with lossy counting. The reduction in the number of windows short flows remain in the table explains the memory improvements of PLC over
lossy counting. In addition, note that in the Subfigures 2(b) and 2(d) the PLC algorithm reaches its maximum memory utilization during the first few windows and that then the number of table entries gradually decreases. This behavior is because of the flow-removing condition cˆ + ∆ ≤ i. The index i increases linearly and has a small value in the first few windows. Therefore, in the first windows only a few flows are removed and the number of table entries becomes relatively high. The probabilistic ∆ parameter exhibits a sublinear increase and with time it becomes substantially smaller than the window index i. To illustrate this, we plot in Figure 3 the probabilistic and deterministic ∆ in the experiments with the Datacenter trace versus i. The probabilistic ∆ becomes increasingly smaller than i and thus the removal condition is satisfied for more flows and the number of table entries decreases. On the other hand, the deterministic ∆ of lossy counting is equal to ∆ = i − 1 and increases linearly with the number of windows. Thus, the number of table entries of lossy counting remains high. The behavior of the probabilistic ∆ in Figure 3 highlights the following important property of PLC: with time the number of small flows that occupy a table entry decreases. Thus, the memory gains of PLC over lossy counting are larger for longer data streams. This is why the average number of windows for which small flows remain in the table decreases from 10.51 to 1.98 in the longer Datacenter trace, while it decreases from 7.49 to 3.72 in the shorter Enterprise trace. Next, we evaluate the accuracy of PLC in estimating the sizes of heavy hitters and compare to the accuracy of lossy counting. It is expected that PLC has a lower estimation
350 deterministic ∆ probabilistic ∆
300 250 200
1
150
0.9
100
0.8 0.7
0 0
50
100
150
200
250
300
350
CDF
50
0.6 0.5 0.4
Window index
0.3
Figure 3: Values of the deterministic and probabilistic parameter ∆ using the Datacenter trace.
5.2
Comparison with multistage filters
A multistage filter (MF) [14] is an efficient and well-known data structure for finding network traffic heavy hitters. It uses a two-dimensional array of hash buckets to identify flows with size above a threshold and inserts those into a
0.1 10-6
10-5 10-4 mean error
10-3
Figure 4: CDF of average error of PLC and lossy counting algorithms. The average error on the estimated sizes of heavy hitters corresponds to the experiment using the Datacenter trace and parameter s = 0.0005. This experiment resulted in the worst performance of PLC of all the experiments made.
100
LC, s = 0.001 PLC, s = 0.001 LC, s = 0.0005 PLC, s = 0.0005
10-1 CCDF
accuracy than lossy counting, as it is more aggressive in removing flows. From the different experiments performed using the two datasets and parameters s = 0.01, 0.001, and 0.0005, we illustrate in Figure 4 the experiment in which PLC had the worst estimation accuracy compared with lossy counting. The figure plots the Commutative Distribution Function (CDF) of the average error of heavy hitters larger than 0.05% (s = 0.0005) of the Datacenter trace. First, observe that lossy counting has a very low average error that is always lower than 0.005%. Secondly, the distribution of PLC is shifted to the right, which means that the average error of PLC is larger than that of lossy counting. For most of the time, however, the average error of PLC is only slightly larger than that of lossy counting: 70% of the average error samples are lower than 0.0008% for PLC and lower than 0.0006% for LC. In addition, the average error of PLC is always lower than 0.09%, which is acceptable for most applications. Figure 4 highlights that 1) as expected lossy counting has a very low estimation error, 2) PLC exhibits a higher estimation error than lossy counting does, and 3) the estimation error of PLC is also very low and acceptable for most applications. Finally, we compare the ratio of false positives of the two algorithms. In Figure 5 we illustrate the Complimentary CDF (CCDF) of the FPR of PLC and of lossy counting for s = 0.001 and s = 0.0005 using the Datacenter trace. We observe that PLC exhibits a lower FPR than lossy counting does. For s = 0.001 and 0.0005, PLC has 40.5% and 37.9%, respectively, fewer false positives than lossy counting. The decrease in the number of false positives is because PLC uses a less conservative ∆ parameter than lossy counting. Recall that false positives are flows with true size between (s − ²)N and sN that are returned in a heavy-hitter query. A heavyhitter query returns all flows for which cˆ + ∆ ≥ sN . As the deterministic ∆ of lossy counting is larger than the probabilistic ∆ of PLC, the last condition is satisfied for more flows with lossy counting than with PLC. For this reason, PLC has fewer false positives.
LC PLC
0.2
10-2
10-3
0
0.01 0.02 0.03 0.04 false-positives ratio (FPR)
0.05
Figure 5: CCDF of FPR metric measuring prevalence of false positive heavy hitters. The distributions compare the number of false positives of PLC and lossy counting for s = 0.001 and s = 0.0005.
MF with shielding MF w/o shielding PLC
(Equivalent) number of PLC table entries
20000
In summary, our evaluation of PLC and comparison with lossy counting and MFs resulted in the following main findings: 1. PLC uses substantially fewer memory resources than lossy counting and MFs. In the experiments, the memory savings in terms of average memory consumption ranged between 37.3% and 74% over lossy counting and between 34.4% and 48.8% over MFs.
15000
10000
2. The memory savings of PLC increase as the data streams get longer.
5000
3. PLC returns fewer false-positive heavy hitters than lossy counting does.
0 0
20 40 60 80 100 (Equivalent) window index
4. PLC and MFs exhibit similar performance in terms of estimation error and number of false positives.
Figure 6: Memory consumption of PLC and MF.
5. The accuracy of PLC in estimating the sizes of heavy hitters is worse than that of lossy counting. Nevertheless, the estimation error is low enough, i.e., lower than 0.09% in our experiments, to be acceptable for most applications.
Table 2: Estimation error, false positive ratio, and average number of returned heavy hitters of PLC and MF. Heavy hitter query > 1% > 0.1% > 0.01%
average error / FPR / heavy hitters MF with MF w/o shielding shielding 0%/0%/10 0%/0%/10 0%/0%/10 0%/0.2%/75 0%/0%/78 0%/0%/78 0%/3.1%/577 0.6%/2.1%/530 0.6%/2.3%/531 PLC
flow memory. We implement a multistage filter along with the conservativeupdate and shielding optimizations discussed in [14]. To compare the performance of MF and PLC, we use the dimensioning heuristics in [15] and set the number of stages and stage counters of MF to 4 and 16,011, respectively. We set the threshold parameter of MF for inserting large flows into the flow memory equal to the corresponding threshold of PLC for removing small flows from its table. We report results using the shorter Enterprise trace, as MFs are designed for finding heavy hitters mainly on short data streams of few minutes up to an hour [14]. Figure 2 illustrates the memory consumption of PLC, of MF without shielding, and of MF with shielding. The average memory consumption of PLC is 34.4% and 48.8% lower than that of MF with and without shielding, respectively. In addition, the memory consumption of PLC reaches its maximum in the first few windows and then decreases with time. On other other hand, the memory consumption of MF strictly increases with time and reaches its maximum at the end of the data stream. As a result, systems dynamically managing the provisioned memory for a heavy hitter algorithm can benefit substantially from using PLC over MF. In Table 2 we compare the average error, the FPR, and the average number of returned heavy hitters of the two algorithms for different heavy hitter queries. PLC has a slightly lower estimation error than MF, whereas MF has a slightly lower number of false positives than PLC. Overall, though, the differences are small and both algorithms exhibit an equally good performance in finding (the size of) heavy hitters.
5.3
Summary of evaluation results
6.
CONCLUSIONS
This work introduces PLC, a heavy-hitter algorithm for finding large flows in streams of network traffic data. The algorithm is tailored for data streams exhibiting power-law size distributions, which is a property known to characterize flow sizes. In addition, PLC is based on and improves upon the lossy counting algorithm. Compared with lossy counting, PLC uses a probabilistic error bound instead of a deterministic one. This change drastically reduces the memory resources needed for computing heavy hitters as well as the number of false positives. Our evaluation experiments show that PLC improves certain important aspects of state-of-the-art heavy hitter algorithms. In particular, PLC exhibits substantially better memory consumption than lossy counting and multistage filters, which was between 34.4% and 74% lower. In addition, PLC exhibits better, similar, or only slightly worse performance than lossy counting and multistage filters in terms of estimation error and false positives.
7.
REFERENCES
[1] L. A. Adamic. Zipf, Power-laws, and Pareto - a ranking tutorial. http://www.hpl.hp.com/research/ idl/papers/ranking/ranking.html. [2] N. Alon, P. Gibbons, Y. Matias, and M. Szegedy. Tracking join and self-join sizes in limited storage. In Proceedings of the Eighteenth ACM Symposium on Principles of Database Systems, 1999. [3] N. Alon, T. Matias, and M. Szegedy. The space complexity of appriximating the frequency moments. In Proceedings of the Twenty-Eighth Annual ACM Sympsuim on the Theory of Computing, 1999. [4] B. Babcock and C. Olston. Distributed top-k monitoring. In Proceedings of the 2003 ACM SIGMOD International Conference on Management of Data, pages 28–39, New York, NY, USA, 2003. ACM Press. [5] C. Barakat, G. Iannaccone, and C. Diot. Ranking flows from sampled traffic. In Proceedings of CoNext, 2005.
[6] M. Charikar, K. Chen, and M. Farach-Colton. Finding frequent items in data streams. In Proceedings of International Colloquium on Automata, Languages and Programming (ICALP), 2002. [7] G. Cormode and S. Muthukrishnan. An improved data stream summary: the count-min sketch and its applications. J. Algorithms, 55(1):58–75, 2005. [8] C. Cranor, T. Johnson, O. Spatscheck, and V. Shkapenyuk. The gigascope stream database. IEEE Data Engineering Bulletin, 26(1):27–32, 2003. [9] E. Demaine, A. Lopez-Ortiz, and J. Munro. Frequency estimation of Internet packet streams with limited space. In In Proceedings of the 10th ESA Annual European Symposium on Algorithms, pages 348–360, 2002. [10] N. Duffield, C. Lund, and M. Thorup. Charging from sampled network usage. In SIGCOMM Internet Measurement Workshop, Nov 2001. [11] N. Duffield, C. Lund, and M. Thorup. Flow sampling under hard resource constraints. In SIGMETRICS ’04/Performance ’04: Proceedings of the joint international conference on Measurement and Modeling of Computer Systems, pages 85–96, New York, NY, USA, 2004. ACM Press. [12] N. Duffield, C. Lund, and M. Thorup. Learn more, sample less: Control of volume and variance in network measurement. IEEE Transactions of Information Theory, 51:1756– 1775, 2005. [13] N. Duffield, C. Lund, and M. Thorup. Sampling to estimate arbitrary subset sums, 2005. [14] C. Estan and G. Varghese. New directions in traffic measurement and accounting. In Proceedings of ACM SIGCOMM, 2002. [15] C. Estan and G. Varghese. New directions in traffic measurement and accounting. Technical Report 699, UCSD CSE, 2002. [16] M. Fang, N. Shivakumar, H. Garcia-Molina, R. Motwani, and K. Ullman. Computing iceberg queries efficiently. In Proceedings of the 24th International Conference on Very Large Databases, 1998. [17] P. B. Gibbons and Y. Matias. New sampling-based summary statistics for improving approximate query answers. pages 331–342, 1998. [18] A. Gilbert, Y. Kotidis, S. Muthukrishnan, and M. Strauss. Surfing wavelets on streams: One-pass summaries for approximate aggregate queries. In Proceedings of the 27th International Conference on Very Large Databases, 2001. [19] A. Gilbert, Y. Kotidis, S. Muthukrishnan, and M. Strauss. How to summarize the universe: Dynamic maintenance of quantiles. In Proceedings of the 28th International Conference on Very Large Data Bases, 2002. [20] N. Kamiyama and T. Mori. Simple and accurate identification of high-rate flows by packet sampling. In Proceedings of IEEE INFOCOM, 2006. [21] R. M. Karp, S. Shenker, and C. H. Papadimitriou. A simple algorithm for finding frequent elements in streams and bags. ACM Transactions on Database Systems, 28(1):51–55, 2003.
[22] K. Keys, D. Moore, and C. Estan. A robust system for accurate real time summaries of Internet traffic. ACM SIGMETRICS Performance Evaluation Review, 33(1), 2005. [23] K. Keys, D. Moore, R. Koga, E. Lagache, M. Tesch, and k. claffy. The architecture of CoralReef: an Internet traffic monitoring software suite. In Proceedings of 2nd Passive and Active Measurement Workshop (PAM’ 01), 2001. [24] B. Krishnamurthy, S. Sen, Y. Zhang, and Y. Chen. Sketch-based change detection: Methods, evaluation, and applications. In Proceedings of the 3rd ACM SIGCOMM Internet Measurement Conference, 2003. [25] A. Kumar, M. Sung, J. Xu, and J. Wang. Data streaming algorithms for efficient and accurate estimation of flow size distributions. In Proceedings of ACM SIGMETRICS, 2004. [26] F. Li, C. Chang, G. Kollios, and A. Bestavros. Characterizing and exploiting reference locality in data stream applications. In Proceedings of the 22nd IEEE International Conference on Data Engineering (ICDE), 2006. [27] X. Li, F. Bian, M. Crovella, C. Diot, R. Govindan, G. Iannaccone, and A. Lakhina. Detection and identification of network anomalies using sketch subspaces. In Proceedings of the 6th ACM SIGCOMM Internet Measurement Conference, pages 147–152, New York, NY, USA, 2006. ACM Press. [28] J. D. C. Little. A proof for the queueing formula: l = λw. Operations Research, 9(3):383–387, 1961. [29] G. S. Manku and R. Motwani. Approximate frequency counts over data streams. In In Proceedings of the 28th International Conference on Very Large Data Bases (VLDB), 2002. [30] A. Metwally, D. Agrawal, and A. E. Abbadi. Efficient computation of frequent and top-k elements in data streams. In Proceedings of the 10th International Conference on Database Theory (ICDT), pages 398–412, 2005. [31] K. Papagiannaki, N. Taft, and C. Diot. Impact of flow dynamics on traffic engineering design principles. In In Proceedings of IEEE INFOCOM, 2004. [32] R. Schweller, A. Gupta, E. Parsons, and Y. Chen. Reversible sketches for efficient and accurate change detection over network data streams. In Proceedings of ACM SIGCOMM Internet Measurement Conference, 2004. [33] S. Venkataraman, D. Song, P. Gibbons, and A. Blum. New streaming algorithms for fast detection of superspeaders. In Proceedings of Internet Society Network and Distributed System Security (NDSS) Symposium, February 2006. [34] Y. Zhang, S. Singh, S. Sen, N. Duffield, and C. Lund. Online identification of hierarchical heavy hitters: Algorithms, evaluation, and applications. In Proceedings of the 4th ACM SIGCOMM Internet Measurement Conference, pages 101–114, New York, NY, USA, 2004. ACM Press. [35] Q. Zhao, A. Kumar, and J. Xu. Joint data streaming and sampling techniques for detection of super sources and destinations. In Proceedings of ACM SIGCOMM Internet Measurement Conference, October 2005.
Appendix A The following lemma and theorems apply to PLC. Lemma 1. When an element is removed from the table, then c ≤ i with probability greater than or equal to 1 − δ. Proof: With probability at least 1−δ the true frequency c of an element is smaller than cˆ + ∆. The condition for removing elements from the table is cˆ + ∆ ≤ i. It follows that when an element is removed from the table c ≤ i with probability at least 1 − δ. Lemma 2. If an element is not in the table, then c ≤ i with probability greater than or equal to 1 − δ. Proof: If the element never entered the table, then c = 0 ≤ i. If the element was removed from the table at window j ≤ i, then from Lemma 1 follows that c ≤ j ≤ i with probability at least 1 − δ. Lemma 3. ∆ ≤ i with probability at least 1 − δ. Proof: According to Lemma 2 the true frequency an element that is not in the table has a bounded true frequency c ≤ i with probability 1 − δ. Consequently, ∆ ≤ ti with probability at least 1 − δ. Theorem 1. If an element is in the table, then cˆ ≤ c ≤ cˆ + i with probability greater than or equal to 1 − δ. Proof: The algorithm can only underestimate the frequency of an element, which yields the left part of the inequality. Now, c ≤ cˆ + ∆ with probability ≥ 1 − δ, as ∆ is the probabilistic error bound on the frequency of an element. From Lemma 3 and the last relation follows that c ≤ cˆ + i with probability ≥ 1 − δ. Theorem 2 PLC and lossy counting share the same memory bounds. Proof: A probabilistic error bound is equal to or smaller than a deterministic error bound. PLC uses a probabilistic error bound instead of a deterministic error bound in the condition for removing elements from the table. This condition is cˆ + ∆ ≤ i. It follows that an element that is removed from the table with lossy counting is also removed from the table with PLC. Both algorithms use the same procedure for inserting elements in the table. Consequently, PLC cannot have more table entries than lossy counting and the two algorithms share the same memory bounds.
Appendix B A natural question to ask is how the performance of PLC changes when the distribution of flow sizes is not exactly Zipfian. If the distribution of flow sizes is substantially different from Zipfian, then the error bound of PLC does not hold. This means that the error on the estimated sizes of heavy hitters can in theory be large. In practice, heavy hitters are substantially larger in size than the threshold of the algorithm and, thus, have to be removed multiple times from the table in order to accumulate significant error. In other words, heavy hitters need to flip between being small flows and large flows over time. This scenario is unlikely in practice and thus the empirical error of PLC can be acceptable even for non-Zipfian distributions. PLC exhibits a lower memory usage than lossy counting because the probabilistic error bound computed with Equation 2 is smaller than the deterministic error bound of lossy counting. If the distribution of flow sizes deviates from the Zipfian model, then the memory improvements of PLC over lossy counting will be affected. Recall that the memory im-
Table 3: Memory usage and error of PLC and lossy counting for synthetically altered traces that exhibit different flow-size distributions. p PLC av. memory usage lossy counting av. memory usage reduction in av. memory usage PLC av. error
0
0.2
0.4
7,009
10,126
12,475
11,182
17,483
21,944
37.3%
42.1%
43.2%
0.012 %
0.019 %
0.027 %
provements are the result of PLC being more aggressive in removing small flows from the table. It follows that if the size distribution has a larger proportion of small flows, then the memory improvements of PLC will be higher, and otherwise lower. To evaluate the performance of PLC for different size distributions, we implemented a simple technique to change the size distribution of our traffic traces. We selected p percent of the elements in a window, taking an equal share from each flow, and uniformly reallocated the selected elements to the flows in the window. In effect, the technique reduces the size of large flows and increases the size of small flows making the size distribution less skewed. Then, we used the technique to change the size distribution in the Enterprise trace and repeated our experiments with synthetically modified versions of the trace. Table 3 illustrates the average memory usage of PLC and of lossy counting, the memory reduction of PLC over lossy counting, and the average error on the computed heavy hitters with PLC. As with the experiments in Section 5, we periodically issued a heavy hitter query with s = 0.0005 and computed the average error on the sizes of the returned heavy hitters. In the table we report the worst average error value encountered in each experiment. We first observe that the average memory usage of PLC and lossy counting increases as the size distribution becomes less skewed. This happens because less skewed distributions have a higher proportion of medium size flows that enter and stay in the table of the algorithms and, thus, contribute to the memory utilization. In addition, we observe that the memory improvements of PLC over lossy counting are higher for less skewed distributions. As explained above, this is the result of PLC being more aggressive in removing flows of small size, which are more prevalent in distributions with higher values of p. Finally, the average error increases with p but remains substantially low, which confirms that in practical scenarios heavy hitters do not accumulate significant error. In summary, we explain and show that PLC exhibits a good performance when the size distribution is not exactly Zipfian. The most important negative implication on the operation of the algorithm is that the error bound does not hold for distributions that are not suitable approximated by the Zipfian model. Nevertheless, in realistic scenarios that involve heavy hitters of substantially large size, the error on the heavy hitters remains low. Thus, with appropriate care, e.g., empirical verification, the algorithm could also be used with distributions that cannot be approximated by the Zipfian model.