Probabilistic Modelling of Chloride Diffusion Coefficient in Concrete with Supplementary Cementitious Materials Kumar Neelotpal Shukla1 and Radhakrishna G. Pillai2 Email :
[email protected] 1Graduate 2Assistant
student, Dept. of Civil Engineering, Indian Institute of Technology Madras, Chennai, India professor, Dept. of Civil Engineering, Indian Institute of Technology Madras, Chennai, India
Abstract: Chloride ingress through diffusion is a major deterioration mechanism, making it absolutely necessary to account for it in the service life prediction (SLP) framework. However, in most SLP frameworks, there are limited provisions for the estimation of the chloride diffusion coefficient (Dchloride), a parameter that has a direct strong influence on the chloride induced corrosion initiation. Developing a probabilistic model for Dchloride based on raw material characteristics and mixture proportions can help in making decisions on the selection of cementitious materials during the planning and design phases of projects. This thesis presents the development of probabilistic models for the estimation of Dchloride based on 42 data sets collected from literature. First, the predictor variables such w/b, specific surface area of binder, and SiO2 and CaO contents in the binder were identified. Then, a diagnostic study was conducted to investigate the nature and degree of influence of each independent variable on Dchloride. Then, probabilistic models that relates Dchloride to the significant independent variables were developed. These models have mean absolute percentage error (MAPE) equal to 3.77% and weighted absolute percentage error (WAPE) equal to 1.59%, indicating reasonably good predictions of Dchloride using raw material characteristics of binder and mixture proportions of concrete. Keywords: concrete, probabilistic modelling, service life prediction, chloride diffusion coefficient, specific surface area, silica content.
1
Introduction
The durability of a reinforced concrete (RC) structure depends upon its interaction with numerous environmental degradation factors (ISO 15686-1:2000). The ingress of ions, liquids or gases present in the service environment into the structure can have highly deleterious effects on the durability of concrete structures. For instance, the presence of chlorides or carbon dioxide at the steel-cementitious interface would depassivate the steel in concrete, and in the presence of oxygen and water, steel can corrode (Mehta and Monteiro). Service Life Prediction (SLP) models are an alternative to the existing prescriptive approach to design. In general, these models take into account the exposure conditions and the material characteristics while assessing the comparative performances of various material systems in the structure. Suitable assumption/estimation of the complex input parameters is a huge concern in service life prediction. One such complex parameter is chloride diffusion coefficient (Dchloride). Dchloride can be estimated based on the raw material characteristics and mixture proportions. This study aims at developing a probabilistic model for Dchloride such that it will ‘complete’ the SLP framework, thereby allowing service life prediction during the actual planning stage. Remainder of this paper presents a quick review on the Dchloride models used in various SLP frameworks. Then, the significance of this research and model development is presented. Following this, discussions on various factors influencing Dchloride are presented. Then, discussions on the data base generated and model development are provided. The statistics of the developed model are also presented.
2
Service Life Prediction Models
This section presents, in brief, five existing service life prediction models (i.e. CHLODIF, ClinConc, STADIUM®, LIFE-365™ and DuraCrete) and the equations for Dchloride. Following is the discussion on the basis of evaluation, advantages and the disadvantages of these models.
2.1
CHLODIF
CHLODIF has been developed for new structures, for which the data on Dchloride is not available (Oslakovic et al. 2012). In this model, Dchloride at any time t is modelled as follows.
𝐷(𝑡) = 𝐷𝑤/𝑐 × 𝑓𝑖𝑛𝑖𝑡 × [1 + 256 (1 −
−1 𝑅𝐻 4 100
) ]
× 𝑡 −𝑚
(1)
𝑤
where, 𝐷𝑤/𝑐 = 5 × 10⁻¹³ × 𝑒 4.8708( 𝑐 ) is Dchloride based on w/c ratio, 𝑓𝑖𝑛𝑖𝑡 is the coefficient accounting for chemical and mineral admixtures, 𝑡 is the age of the structure and 𝑚 is the age factor. CHLODIF takes into account the effects of several parameters such as water-to-cement ratio, the concentration of mineral and/or chemical admixtures and superplasticizers, relative humidity, temperature, age of the structure, and the details of curing as well as cracking in predicting the service life of a structure. Hence, it can be concluded that CHLODIF has quite a comprehensive set of input variables. However, the Dw/c component, which is the initial prediction of Dchloride, relies only on w/c. This simplistic assumption, unless carefully made, might lead to inaccuracies in prediction.
2.2
ClinConc
ClinConc is an advanced SLP model which takes into account convection, multi-ionic characteristics etc. in addition to the diffusion mechanism in modelling the ingress of chlorides (Tang 2008). It is based on a finite difference approach and uses directly measurable data as input. ClinConc considers only the diffusion of free chlorides into the concrete and therefore, to model the ingress it follows a two-step procedure. The ingress of free chlorides is modelled through Fick’s second law and the distribution of total chlorides (into ‘free’ and ‘bound’ parts) is calculated on the basis of mass balance equations in combination with non-linear chloride binding models. In this model, Dchloride is defined as follows: 𝐷0 =
(0.8𝛼𝑡2 −2𝛼𝑡 +2.5)(1+0.59𝐾𝑏 )×𝑘𝑇𝐷
𝑐𝑠 𝛽𝑏 −1 ) 35.45
1+𝑘𝑂𝐻 ×𝐾𝑏 ×𝑘𝑇𝑏 ×𝑓𝑏 ×𝛽𝑏 (
×𝐷
(2)
where, 𝐷0 is the initial apparent diffusion coefficient, 𝛼𝑡 is the time dependent factor for chloride binding, 𝐾𝑏 is the binding factor, 𝑘 𝑇𝐷 and 𝑘 𝑇𝑏 are the temperature factors for diffusion coefficient and chloride binding, 𝑘𝑂𝐻 is the factor describing the effects of alkalinity, 𝑓𝑏 and 𝛽𝑏 are chloride binding coefficients, 𝑐𝑠 is the free chloride concentration in the surrounding environment and 𝐷 is the diffusion coefficient from laboratory tests 6 months after the start of exposure. In addition to a very detailed and elaborate prediction methodology, ClinConc also offers separate treatment of material properties and exposure environment as an advantage. However, it has its own limitations. It was initially developed for submerged structures, which remain in continuous contact with seawater and therefore, has to be modified for application in the air borne chloride scenario.
2.3
STADIUM®
STADIUM® (Software for Transport And Degradation In Unsaturated Materials) is a concrete SLP model which uses time step finite element analysis to simulate the ingress of deleterious ions (including chlorides) in conjunction with certified lab testing to determine the service life of exposed reinforced concrete structures. STADIUM® considers the chemical and physical properties of the concrete and the effect of chloride binding in determining the transport properties of the 20+ concrete mixtures that it was developed for. STADIUM® is a commercial software package developed by SIMCO Technologies and is extensively used by the United States Navy in its port expansion projects. Being a commercial project is one of the biggest limitations of STADIUM® since its source code, governing equations and framework are not available (i.e. not an open-source software) for review and evaluation.
2.4
LIFE-365™
LIFE-365™ was developed by the Strategic Development Council of the American Concrete Institute through LIFE-365 consortiums I and II; and is one of the most widely used SLP models (Life-365 2012). It is freely available on the Internet as a software package. It predicts the time to initiation of corrosion using a finite difference approach to Fick’s 2nd law. Dchloride is considered to be time and temperature dependent and is modelled in the following manner. 𝐷(𝑡, 𝑇) = 𝐷𝑟𝑒𝑓 × (
𝑈
𝑡𝑟𝑒𝑓 𝑚 𝑡
) × 𝑒𝑅
1 1 − ) 𝑇𝑟𝑒𝑓 𝑇
(
(3)
where, 𝐷(𝑡, 𝑇) is the diffusion coefficient at time 𝑡 and temperature 𝑇, 𝑚 is the age factor (also known as the diffusion decay, as defined in equation 4), 𝐷𝑟𝑒𝑓 is the diffusion coefficient at reference time 𝑡𝑟𝑒𝑓 = 28 𝑑𝑎𝑦𝑠 and reference temperature 𝑇𝑟𝑒𝑓 = 293𝐾, 𝑈 is the activation energy of the chloride diffusion process (35000 Jmol-1) and 𝑅 is the universal gas constant (Life-365 2012). 𝑚 = 0.2 + 0.4 (
%𝐹𝐴 50
+
%𝑆𝐺 70
)
(4)
where %FA and %SG are the percentages of fly-ash and slag in the concrete, respectively. LIFE-365™ has become widely used because of its user friendly interface, free availability and comprehensiveness. In addition to predicting service life based on user input, LIFE-365™ also generates several reports, and suggests maintenance and repair plans. LIFE-365™ is limited by the simplifications and assumptions it makes to deal with complex phenomena. Additionally, it is developed specifically for use in North America based on a database collected primarily from North America. This limits its reliable use in other locations in the world.
2.5
DuraCrete
DuraCrete is complete performance based design tool, in addition to being a probabilistic SLP framework. It uses the concepts of reliability index and explicit performance requirements to overcome several limitations of the conventional prescriptive design frameworks. Unlike the other models discussed so far, which try to predict a single value of the time to initiation of corrosion, DuraCrete defines a serviceability limit state and calculates the probability of that limit state being reached. All of this can be done at user selected levels of reliability (DuraCrete 1999a). DuraCrete proposes to use Dchloride directly measured using compliance laboratory tests or models a time dependent variation through simple power functions to arrive at an apparent diffusion coefficient, Da(t) as follows: 𝐷𝑎 (𝑡) = 𝐷𝑎 (𝑡𝑒𝑥 ) × (
𝑡𝑒𝑥 𝑛 𝑡
)
(5)
where, 𝐷𝑎 (𝑡) is the function describing the observed time dependent variation of the apparent Dchloride, 𝑡𝑒𝑥 and 𝑡 are, the times at first exposure and the inspection time, respectively, and 𝑛 is the age factor. The DuraCrete framework, like many others, accepts Dchloride as an input value that has to be derived from one of the compliance tests mentioned in the project report titled ‘Compliance Testing for Probabilistic Design Purposes’ (DuraCrete 1999b).
3
Research Significance
The existing service life prediction frameworks suffer from insufficiencies that hinder their purpose of enabling careful selection of materials during the planning and design phase. For example, one of the major inadequacies of the LIFE-365™ framework is its incapability to accurately estimate Dchloride based on mixture proportions and/or field tests. While others like DuraCrete accept Dchloride as an input value obtained from a laboratory test. Despite being carefully selected on the basis of short testing time and high accuracy of results, compliance tests are time taking and do not allow complete freedom of quickly trying a number of combinations. This problem is further accentuated by the shortage of laboratories capable of conducting compliance tests in developing nations where construction is booming. The fact that codes do not mandate compliance tests coupled with the problems faced in conducting them has resulted in tests not being carried out altogether. This issue can be addressed through the development of a probabilistic model for preliminary assessment of concrete systems that relates Dchloride with the mixture proportions and raw material characteristics. The model should be capable of accommodating the developments in raw materials. A way of doing this is to incorporate the physical properties and chemical composition of the raw materials into the model. The beauty of this approach is that these data can be obtained from the material manufacturers. The developed model will thereby allow for the selection of durable concrete systems from the various material options available during the planning stage of projects itself.
4
Database and Statistical Modelling
As a first step in modelling Dchloride, diagnostic plots are developed to explore the effect of each variable. Then using an engineering understanding of the diffusion process and mathematical principles, the variables are classified as “critical” and “non-critical” variables. Then a probabilistic model is formulated using the critical variables.
4.1
Database Generation
One of the most challenging aspects of developing a probabilistic model for Dchloride was collecting data for modelling. An attempt was made to generate a fairly large and comprehensive database containing Dchloride and all variables that might possibly affect it. About 40 literature articles on Dchloride were extensively reviewed. Most other articles were incomplete due to the lack of data on raw materials characteristics. Only three articles were found to have complete data on raw material characteristics, mixture proportions and Dchloride, which are required for the modeling purposes defined in this article.
These are Audenaert et al. 2010, Leng et al. 2000, and Ramezanianpour et al. 2014 from Belgium, China, and Iran, respectively. The developed database contains 48 cases each with 17 fields. These include both normal and special types of concretes. The database has also been designed to accommodate concrete mixes containing fillers, pozzolans and superplasticizers. Several cases of this type have also been identified and recorded.
4.2
Critical Variables
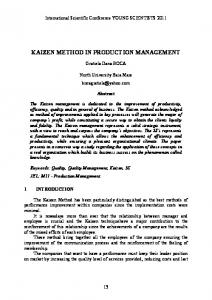
Cement hydration mechanisms and diagnostic plots indicate that the w/b, specific surface area of binder, SiO2 and CaO contents in the binder are important variables affecting the chloride diffusion coefficient. The possible relationships between these variables and the chloride diffusion coefficient are as follows. Water-to-binder ratio (w/b): This is defined as the ratio of the water content per unit volume of concrete to the total binder content per unit volume of concrete. It is also responsible for hydration of cement and the formation of C-S-H gel. The available reaction front and its movement define the properties of the C-S-H matrix through which chlorides diffuse later. w/b has the strongest correlation with diffusion coefficient among all variables considered. This is illustrated in its main effect diagnostic plot (Figure 1).
Figure 1 Diagnostic plot on the main effect of w/b on DChloride - a possible exponential trend
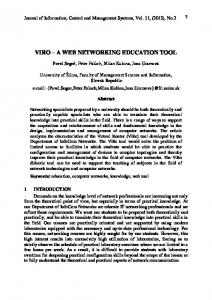
Specific surface area (SSA): Specific surface area of the binder was taken as the weighted mean of the specific surface area of each of the binder components (say, Portland cement, fly ash, etc.). Only Portland cement, fly ash and slag were considered while developing this model but the concept is applicable to other materials as well. Materials with high specific surface such as silica fume, metakaolin etc. generate fairly impervious binder matrices. An inverse relationship is expected between specific surface area and Dchloride. SiO2 content: SiO2 content in binder was taken as the weighted mean of the SiO 2 contents of each of the binder components (say, Portland cement, slag, etc.). SiO 2 is the S component of the C-S-H gel reaction front, the importance of which has been discussed previously. The main effect plot of the SiO2 is presented in Figure 2 . The main effect shows a strong trend such that it can potentially become exponential through interactions with other variables (Section 5.2). CaO content: CaO content in binder was taken as the weighted mean of the CaO contents of each of the binder components. CaO is the C component of the C-S-H gel reaction front. On a close analysis of the data, it was found that SiO2 and CaO in combination make up a large percentage of the chemical composition of the binder and this percentage remains fairly constant – for the modelling purposes. For the collected data, the mean of SiO2 + CaO content is 81.71% with a standard deviation of 2.73%. Because of this reason, CaO has not been included in the model as a separate term once SiO 2 has already been considered. SiO2 was preferred over CaO because of a stronger visible trend between Dchloride and SiO2.
Figure 2 Diagnostic plot on the main effect of SiO2 content in binder on Dchloride
4.3
Variable Properties
It was observed that two distinct groups of cases existed in the database. The first group was comprised of data from Ramezanianpour (2014), and was characterized by Dchloride greater than 10 X 10-12 m2/s. The second group consisted of data from Audenaert (2010) and Leng (2000), and all but one values of Dchloride were less than 10 X 10-12 m2/s. Table 1 shows the ranges of each of the critical predictor variables. It can be seen that the SiO 2 content is more or less similar for each data source and therefore, ranges overlap. However, the existence of two distinct groups can be explained on the basis of w/b and specific surface area values. Both high w/b and low specific surface area values result in high values of Dchloride. This is because in both these situations, the cement paste is quite porous and therefore, offers less resistance to the ingress of chloride ions. For this reason, two different models were developed for two different SSA groups (< and ≥ 345 m2/kg). Group Low Specific Surface Area (LSSA) consists of cases with SSA less than 345 m2/kg (least of all high specific surface area cases) and group High Specific Surface Area (HSSA) consists of cases with SSA greater than or equal to 345 m 2/kg. Table 1 Ranges of critical predictor variables, sorted according to database groups Group LSSA HSSA HSSA
4.4
Data Source Ramezanianpour (2014) Audenaert (2010) Leng (2000)
w/b 0.35 – 0.45 0.37 – 0.60 0.26 – 0.35
SiO2 content (%) 21.0 – 36.5 19.5 – 26.0 21.0 – 39.0
SSA (m2/kg) 280 – 290 345 – 465 360 – 460
Non-critical variables
Initially, two groups of variables were formed based on the fields present in the database. The first group on ‘mix proportions’ included w/b, water, %cement, %fly ash, %slag, % filler, % fine aggregate, % coarse aggregate and binder-to-aggregate ratio. The second group on ‘raw materials characteristics’ included chemical composition, specific surface area and density of the binder. Following this, the critical variables were identified based on the C-S-H matrix theory. Diagnostic plots were prepared for all variables to explore any potential relations. Most variables were rejected because of their poor correlations with Dchloride, Chemical constituents other than SiO2 and CaO were present in small amounts and are not known to have prominent effect on Dchloride. The percentage content of individual binder components (say, Portland cement, slag, etc.) would have been important had weighted mean not been considered for determining the effective chemical composition of the binder mixture. But, since weighted mean has been considered, inclusion of these is not necessary. If more information about the aggregates had been available, the aggregate percentages could have been utilized. For this study, with the C-S-H reaction front approach, these have been left out.
5 Probabilistic Modelling 5.1 Assumptions and limitations The following assumptions have been made while developing the probabilistic model for estimating Dchloride.
Specific surface area, SiO2 content and CaO content of the binder are the same as the weighted mean of the raw material characteristics of each of the binder components. 𝑥𝑏𝑖𝑛𝑑𝑒𝑟 = 𝑝𝐶1 𝑥𝐶1 + 𝑝𝐶2 𝑥𝐶2 + ⋯ + 𝑝𝐶𝑛 𝑥𝐶𝑛 where, x is specific surface area, SiO2 content or CaO content; n is the total number of ingredients of binder; p is percentage; and Ci is binder ingredient (say, Portland cement, fly ash, etc.)
5.2
The model is based on data collected from concrete mixtures and therefore, is not valid for mortars. The model is based on binders that contain either only Portland cement, Portland cement and fly ash or Portland cement and slag. Therefore, the model is not applicable for concrete mixes containing other supplementary cementitious materials (SCMs).
Model Form
A model form was developed based on the main effects and 2-way as well as 3-way interactions of the predictor variables. As a first step, specific surface area and %SiO 2 content in the binder were normalized to bring each predictor variable in the [0,1] range. This was done to properly capture the effect of each individual variable on Dchloride. Without normalizing, predictor variables with high absolute values (such as specific surface area) tend to bias the model and decrease its effectiveness and scope. A maximum specific surface area (SSAmax) of 500 m2/kg was assumed for normalization process. The upper limit has been selected based on the consideration that the model is being developed for concretes mixes containing only Portland cement, fly ash and slag, for which typical values of specific surface area are ≤ 500 m 2/kg. Another variable, SiO2 content was expressed as percentage and therefore, has been normalized through division by 100. Diagnostic plots were prepared for the 2- and 3-way interactions between the predictor variables. Only HSSA data were used for this purpose, mainly because the number of data sets in LSSA were too few to observe any trends. However, it should be noted that the model form remains the same for both HSSA and LSSA models; only the coefficients change based on the data used for calibration, for which both HSSA and LSSA data were sufficient. Diagnostic plots were prepared to understand the existing trend and transform variables such that the trend resembles an exponential curve. The interactions were of the form 𝑋: 𝑌~𝛼𝑋𝛽 × 𝛾𝑌 𝛿 . The MATLAB™ code used for model calibration executes faster if the values provided initially are close to the final value. For this purpose, starting values of β and δ were obtained through an approximate best exponential fit (Figure 3). It should be noted that the values of β and δ so obtained only serve as starting reference points for the MATLAB™ calibration code and do not affect the final outcome in any way. The values of α and γ were kept constant and equal to 1. Final values for α and γ can be obtained through the calibration code. After obtaining a reasonable estimate of the power terms in a 2-way interaction between SiO2 𝜃
content and specific surface area, a 3-way interaction term of the form 𝑤/𝑏𝜃1 × (𝑆𝑆𝐴𝑏𝑖𝑛𝑑𝑒𝑟 ⁄𝑆𝑆𝐴𝑚𝑎𝑥 ) 2 × 𝑝𝑆𝑖𝑂 𝜃3 was developed. A procedure similar to the 2-way interaction optimization was followed to obtain 2
the value of each θ for a good fit. The interaction effect of 𝑤/𝑏 × (𝑆𝑆𝐴𝑏𝑖𝑛𝑑𝑒𝑟 ⁄𝑆𝑆𝐴𝑚𝑎𝑥 )−0.4 × 𝑝𝑆𝑖𝑂2 −1 for Group HSSA cases resulted in a coefficient of determination (R-squared) value of 0.86 when an exponential trendline was fitted to it (Figure 4). This was the highest R-squared value among all manually tried combinations of θi. These values were taken as the initial reference values for the MATLAB™ calibration code. It was also noticed that for all interaction products, the value of θ1 remained constant and equal to 1. As a result, the following model form has been developed. 𝑤
𝑆𝑆𝐴𝑏𝑖𝑛𝑑𝑒𝑟
𝑏
𝑆𝑆𝐴𝑚𝑎𝑥
𝐷28,𝑝𝑟𝑒𝑑𝑖𝑐𝑡𝑒𝑑 = 𝜃0 𝑒𝑥𝑝 {( ) × [(
𝜃1
) 𝑝𝑆𝑖𝑂2 ] } + 𝜎𝜀
(6)
Figure 3 HSSA Group - Interaction effect of (𝑺𝑺𝑨𝒃𝒊𝒏𝒅𝒆𝒓⁄𝑺𝑺𝑨𝒎𝒂𝒙 )−𝟏 𝒑𝑺𝒊𝑶𝟐 −𝟏 obtained by varying values of β and δ, and visually analyzing goodness of fit.
Figure 4 HSSA Group - Interaction effect of w/b, specific surface area and SiO2 content in binder.
5.3
Model Calibration and Assessment
The database of 48 cases was screened for outliers and 6 cases were removed. The model was calibrated using the remaining 42 cases. Calibration was done through a MATLAB™ code (Gardoni 2009). This code provides the maximum likelihood estimates for each θ i along with the standard deviation and coefficients of variation for each (Table 2). The code estimates these values based on an algorithm designed to minimize the residual sum of squares. It should be noted that the coefficient of variation (COV) is only a statistical quantity obtained for this particular dataset and can be altered. For example, COV can be greatly reduced by the inclusion of a large number of closely spaced high leverage points in the low Dchloride range (as encased in the ellipse in Figure 4). The removal of these cases during calibration results in higher COV (0.16 and 0.03, respectively for θ0 and θ1, in group HSSA) but the model coefficients remain similar in magnitude. In summary, large COV values (> 0.3) might indicate problems with the model coefficients, but otherwise, instead of COV, quantities such as model error and MAPE/WAPE, as discussed later, should be used to evaluate the model. The final probabilistic models developed for estimating chloride diffusion coefficient is given in Eq. (7). 𝑤
𝐷28,𝑝𝑟𝑒𝑑𝑖𝑐𝑡𝑒𝑑 = {
−0.60 𝑆𝑆𝐴𝑏𝑖𝑛𝑑𝑒𝑟 ) 𝑝 ] } + 𝜎𝜀, 𝑖𝑓 𝑆𝑆𝐴𝑏𝑖𝑛𝑑𝑒𝑟 𝑆𝑖𝑂 2 𝑆𝑆𝐴𝑚𝑎𝑥 −0.95 𝑆𝑆𝐴 [( 𝑆𝑆𝐴𝑏𝑖𝑛𝑑𝑒𝑟 ) 𝑝𝑆𝑖𝑂2 ] } + 𝜎𝜀, 𝑖𝑓 𝑆𝑆𝐴𝑏𝑖𝑛𝑑𝑒𝑟
4.95 exp {( 𝑏 ) × [( 𝑤
0.24 exp {( 𝑏 ) ×
𝑚𝑎𝑥
< 345 𝑚2 /𝑘𝑔 ≥ 345 𝑚2 /𝑘𝑔
(7)
Figure 5 illustrates the goodness of fit of the model. It can clearly be seen that most data points fall inside one standard deviation. The high leveraging effect of data cases with Dchloride < 2 (low range) can also be seen. Table 2 Maximum likelihood estimates (MLE) model parameters Group LSSA
Statistical Quantity Maximum likelihood estimate Standard deviation Coefficient of variation Maximum likelihood estimate Standard deviation Coefficient of variation
HSSA
θ0 4.95 0.26 0.05 0.24 0.04 0.15
θ1 - 0.60 0.02 0.03 - 0.95 0.02 0.02
Figure 5 Correlation between the observed and predicted data on chloride diffusion coefficient.
The posterior mean of the standard deviation, σ, of the model error can be used to evaluate the accuracy of the developed model. The values of σ for the developed LSSA and HSSA models are 0.8741 and 0.7813, respectively. To provide a more intuitive measure of the model accuracy, the mean absolute percentage error (MAPE) is also calculated for the LSSA model. The MAPE can be seen as the average error in the model expressed as a percent of the measured value and can be mathematically expressed as follows. 1
|𝐷𝑖,𝑝𝑟𝑒𝑑𝑖𝑐𝑡𝑒𝑑 −𝐷𝑖,28 |
𝑛
𝐷𝑖,28
𝑀𝐴𝑃𝐸 = [∑𝑛𝑖=1 (
)]
(8)
where, Di,predicted is the value of Di,chloride predicted using the model developed and D28 is the value obtained from literature. The ‘i’ represents the individual data. The MAPE for the LSSA model is 0.0377. The MAPE has not been calculated for the HSSA model, because of the presence of a large number of Dchloride < 1 m2/s cases in the HSSA database. The presence of small denominators can create a singularity problem. For such series, weighted absolute percentage error (WAPE) is a better estimate than MAPE. The WAPE can be mathematically expressed in Eq. (9). 1
|𝐷𝑖,𝑝𝑟𝑒𝑑𝑖𝑐𝑡𝑒𝑑 −𝐷𝑖,28 |
𝑛
∑ 𝐷𝑖,28
𝑊𝐴𝑃𝐸 = [∑𝑛𝑖=1 (
)]
(9)
where, the terms are as defined in Eq. (8). In summary, the MAPE of 0.0377 for LSSA model and WAPE of 0.0159 for HSSA model indicate that these models can make reasonably good predictions of Dchloride.
6
Conclusions
Based on 42 data sets, collected from literature, on chloride diffusion coefficient, raw material characteristics of binders, and mixture proportions, a probabilistic model (Eq. 10) was developed. 𝑤
𝑆𝑆𝐴𝑏𝑖𝑛𝑑𝑒𝑟
𝑏
𝑆𝑆𝐴𝑚𝑎𝑥
𝐷28,𝑝𝑟𝑒𝑑𝑖𝑐𝑡𝑒𝑑 = 𝜃0 𝑒𝑥𝑝 {( ) × [(
𝜃1
) 𝑝𝑆𝑖𝑂2 ] } + 𝜎𝜀
(10)
where, if 𝑆𝑆𝐴𝑏𝑖𝑛𝑑𝑒𝑟 < 345 𝑚2 ⁄𝑘𝑔 , 𝑡ℎ𝑒𝑛 𝜃0 = 4.95, 𝜃1 = −0.60 and if 𝑆𝑆𝐴𝑏𝑖𝑛𝑑𝑒𝑟 ≥ 345 𝑚2 ⁄𝑘𝑔 , 𝑡ℎ𝑒𝑛 𝜃0 = 0.24, 𝜃1 = −0.95 A comprehensive and larger database for Dchloride needs to be developed and the model should then be recalibrated and made more robust using the newly acquired data. Although significant amount of literature exist on durability performance of various concrete systems, most of the available data sets are incomplete (i.e., data on raw material characteristics and mixture proportions are not available). This emphasizes the need to include data on raw material characteristics, mixture proportions, mixing procedures, porosity, etc. in the scientific publications on strength and durability of concrete systems. Such data sets would help developing more useful models for service life prediction.
7
Acknowledgement
This research was carried out at the Building Technology and Construction Management (BTCM) Division, Department of Civil Engineering, Indian Institute of Technology Madras, Chennai, India. The support from BTCM colleagues and faculty in IIT Madras is highly appreciated.
8
References
Audenaert, K., Yuan, Q., & De Schutter, G. (2010), On the time dependency of the chloride migration coefficient in concrete, Construction and Building Materials, 24 (2010) 396–402 DuraCrete (1999a), Design Framework, Document BE95- 1347/R0, The European Union – BriteEuRam III, Contract BRPR-CT95-0132, Project BE95-1347, 7-13 DuraCrete (1999b), Compliance Testing for Probabilistic Design Purposes, Document BE95- 1347/R0, The European Union – BriteEuRam III, Contract BRPR-CT95-0132, Project BE95-1347, 22-35 ISO 15686-1:2000, (2000), Buildings and constructed assets -- Service life planning -- Part 1: General Principles Leng Faguang, Feng Naiqian, & Lu Xinying (2000), An experimental study on the properties of resistance to diffusion of chloride ions of fly ash and blast furnace slag concrete, Cement and Concrete Research, 30 (2000) 989-992 Life-365 (2012), Service life prediction model and computer program for predicting the service life and life-cycle cost of reinforced concrete exposed to chlorides. URL: http://www.life-365.org/; most recently accessed on: 16 Apr 2015 Mehta, P. K., & Monteiro, P. J. M. (2013), Concrete: Microstructure, Properties, and Materials Muigai, R., Moyo, P., & Alexander, M. (2012), Durability design of reinforced concrete structures: a comparison of the use of durability indexes in the deemed-to-satisfy approach and the fullprobabilistic approach, Materials and Structures DOI 10.1617/s11527-012-9829-y Oslakovic, I. S., Bjegovic, D., Mikulic, D., & Krstic, V. (2012), Development of service life model CHLODIF++, Computational modelling of concrete structures, EURO-C, 573-578 Ramezanianpour, A. A., Mahmoud Motahari Karein, S., Vosoughi, P., Pilvar, A., Isapour, S., & Moodi, F. (2014), Effects of calcined perlite powder as a SCM on the strength and permeability of concrete, Construction and Building Materials, 66 (2014) 222–228 Tang, L. (2008), Engineering expression of the ClinConc model for prediction of free and total chloride ingress in submerged marine concrete. Cement and Concrete Research, 38(8), 1092-1097