6th World Congresses of Structural and Multidisciplinary Optimization Rio de Janeiro, 30 May - 03 June 2005, Brazil
Optimization Under Stochastic Linear Programming Artur Barreiros Instituto Superior Técnico, Mechanical Engineering Department Av. Rovisco Pais, 1049-001 Lisbon, Portugal e-mail:
[email protected] Abstract A great number of stochastic linear programming problems are modeled considering two stages and future recourse. To unsure feasibility, these models usually consider, implicitly or explicitly, all possible realizations of the random variables simultaneously. Generally, these formulations assume perfect correlated or independent random variables and lead to non-linear formulations, which are more complex, and more difficult to solve, than simple Linear Programming Problems. This article presents an alternative approach to address the two-stage formulation with recourse for stochastic linear programming. Using a simple test case, it is shown that the two-stage formulation with recourse can be solved considering wisely realizations of the random variables, leading each one to a standard LP problem. This alternative requires the characterization and discretization of the distributions of the random parameters, which is achieved using stochastic trinomial trees. The results obtained show that the numerical characterization of the statistical data plays an important role in the optimal solution. Keywords: stochastic linear programming / recourse models 1. Introduction Linear Programming (LP) is a fundamental planning tool that is used in several disciplines such as almost areas of engineering, management and economy. In standard LP problems, all of the data are generally treated as certain even if some of the parameters are random. One way to deal with this uncertainty is to apply sensitivity analysis, and find how the variation of parameters influences the optimal solution. Even so, in many situations the uncertainty of the data should be incorporated in the model. If the random parameters are incorporated in the LP model as stochastic variables, a stochastic linear programming (SLP) problem is defined. These models are appropriate when the data change over time and the decisions need to be made prior to the data observation. Stochastic programming models have also become an important planning tool, which has been used in a variety of applications, such as electric power generation, where utilities must plan power generation before the demand for electricity is realized (e.g. [1]) and financial planning, where investments decisions in portfolio management must be implemented before the actual rates of return and can be observed (e.g. [2]). Applications in chain management, and telecommunications are also very frequent (e.g. [3] and [4]) as well as many others (e.g. [5] and [6]). A great number of stochastic programming problems are modeled considering two stages and future recourse. In this case, the decision variables are classified according to the instant were they are realized or implemented. If they are implemented before the occurrence of the stochastic events they are classified as first stage variables while if they are implemented after, they are classified as second stage variables. The second stage variables are used to model the response to the realization of the random variables. However this response will depend also of the decisions adopted at the first level. For example, in production systems the first level decisions may be the quantities produced of each item and the demand may be modeled using stochastic variables. When the demand exceeds the quantities produced a policy may dictate a penalty, introducing an additional cost. This policy is a recourse response and its level depends both of the quantities produced and the demand observed. SLP models are developed in a way that decisions are evaluated against a variety of future scenarios that represent alternative realizations of the random parameters. The simple averaging of results is not regarded as appropriated to deal with uncertainty, because the average of the scenario’s solutions is not, in general, a satisfactory solution. Although its increasing utilization, stochastic programming models still difficult to solve, essentially, due to the size of the problems originated by the random data, which grows exponentially with the number of periods and the number of outcomes at each period. There are also difficulties in handling the general probability distributions. In fact, it is generally necessary to construct finite distributions, close enough to the original ones, which leads to the replacement of the initial problem by a computational tractable approximation. The main objective of this article is to address the two-stage formulation with recourse for stochastic linear programming, using an alternative approach, which seeks to take advantage of the original LP problem. The alternative formulations available consider, usually, implicitly or explicitly, all possible realizations of the random variables simultaneously. Generally, these formulations assume perfect correlated or independent random variables and lead to non-linear formulations, which are more complex, and more difficult to solve, than simple Linear Problems. Using a simple test case, it is shown that the two-stage formulation with recourse can be solved considering wisely realizations of the random variables, leading each one to a standard LP problem. This alternative requires the characterization and discretization of the distributions of the random parameters, which may be lead to additional difficulties, because some of them may be physically bonded, both inferiorly and superiorly. Though, alternatives to minimize these obstacles, based in the characterization of the distributions of the random variables using stochastic trinomial trees, are also analyzed in this article. This article is organized as follows. This section highlights the importance of SLP problems and gives an overview of the main difficulties in dealing with these problems. Section 2 present the general mathematical formulation of two-stage SLP problems, highlighting the complexities and the main simplifications usually adopted. Section 3 presents the deterministic equivalent problem, which is used later to obtain the exact solution of the test case analyzed. Section 4 describes the numerical approach suggested in this
article to solve Two-Stage SLP Problems. Section 5 describes a procedure to characterize the probability distributions. Section 6 describes and presents solutions for a test case. Section 7 summarizes the main conclusions of this work. 2. Complexity of Two-Stage SLP Problems The mathematical formulation of the two-stage stochastic linear programming (SLP) problem is stated, generally, as (e.g [5], [6], [7]):
{
min c x + Q (x ) | Ax ≤ b, x ∈ R+n1 with
}
Q (x ) = Eε [ Q(x, ε )]
{
Q(x, ε ) = min q y | Wy ≥ h − T x,
y ∈ R+n2
(1a) (1b)
}
(1c)
where x is an n1 dimension vector, representing the first-stage decisions, and y is an n2 dimension vector, representing the secondstage, or recourse, decisions. The vectors c(n1) and q(n2) represent the specific costs associated to first-stage and second-stage decisions, respectively. The matrix A(m1×n1) and the vector b(m1) are related with m1 constraints associated to first-stage variables, while the recourse matrix W(m2×n2), the technology matrix T(m2×n1) and the vector h(m2) are related with m2 recourse constraints. The function Q(x, ε) is known as the second-stage value function and Q (x ) as the expected value function. What makes this problem difficult to solve is the uncertainty of the data in the second-stage constraints. In the general case, the components of the recourse matrix, the technology matrix, the vector h and the cost vector q are random variables with known probability distributions. The objective of the problem is to determine the optimal values of x that minimizes the expected total cost considering all-possible actions y, which will be taken after full information is received. Thus, Q (x ) represents the expected optimal recourse cost associated with a first-stage decision x. In the general case, the random parameters involved in the problem are dependent of a random vector ε with an arbitrary number of components, which may be correlated or not. Nevertheless, cases with all this flexibility are rare (e.g. [5]). In the most frequent applications the components of W, h and q are considered deterministic and often ε is a scalar, meaning that all components of T are perfectly correlated. This last simplification follows because, in the general case, if the random parameters are continuously distributed, the definition of the expected value function involves an n-fold integral, where n is the dimension of the random vector. Depending on its properties, the evaluation of the joint distribution may be confronted with severe difficulties, even for small values of n (i.e. n ≤ 3 ). Models with a deterministic recourse matrix are said to have fixed recourse. In these models it is desirable that a recourse action exists for all realizations of the random parameters. This is achieved if the feasible region of the recourse model is defined by K = K1 ∩ K 2 , where:
{
K1 = x ∈ R+n1 : Ax ≤ b K2 =
{
x ∈ R+n1
}
: Q(x ) < +∞
(2a)
}
(2b)
Under these circumstances, the following classes of recourse problems are generally considered: – fixed recourse: if W (arbitrary) deterministic; – complete recourse: if posW, where posW = { t : ∃ y ≥ 0, t = W y} ;
– simple recourse: if W = (I ,− I ) , where I is the m2×m2 identity matrix. Complete recourse implies that there is always a recourse action, independently of the first-stage decision x and the realization of the random vector ε. Thus, the feasible region is determined by the deterministic constraints only (i.e. K = K1 ).
Simple recourse is a special case of complete recourse. In this case, Q(x, ε) is separable, in the sense that it can be represented as the sum of m2 terms, being each one the value function of an optimization problem with two variables and one constraint. For this purpose, q and y are usually partitioned as q = ( q + ,−q − ) and y = ( y + ,− y − ) , to match the partition of W. After that the second-stage value function becomes:
{
Q(x, ε ) = ∑i =21 min qi+ yi+ − qi− yi− | yi+ − yi− = h i − Ti x, yi+ , yi− ∈ R+n2 m
}
(3)
and the optimal solution of this problem becomes (e.g. [7]):
{ } = max{ 0, T x − h }
yi+ = max 0, h i − Ti x
(4a)
yi−
(4b)
i
i
Nevertheless, in the general case of complete recourse, this formulation implies that a distribution problem for each x as to be solved using directly the expression (1:b,c).
3. The Deterministic Equivalent Problem The two-stage SLP problem can be seen as originating from the following linear programming model, with uncertain parameter values:
{
min g = c x | Ax ≤ b, T (ε ) x ≥ h(ε ), x ∈ R+n1
}
(5)
However, if a decision has to be made before the realization of ε becomes known this model is not well defined. At least in the long run, the optimal value of x would be the one that minimizes the total cost against all possible realizations of ε. However, to achieve this objective additional specifications are needed. One approach to recoup its consistency is to assume that possible infeasibilities due to a choice of x together with realizations of T and h are compensated by second-stage decisions y, with additional costs q. In this way, the recourse costs are taken in the objective function, weighted with their probability of occurrence. Thus, an alternative mathematical formulation of the two-stage SLP problem is given by:
{
}
min g = c x + Eε [q y ] | A x ≤ b, T x + W y ≥ h, x ∈ R+n1 , y ∈ R+n2 , ∀ε
(6)
Since in the general case this problem has to be solved numerically, discrete distributions have to be defined. Then the formulation of the problem may also be represented as (e.g. [5]): nk
min g = c x + ∑ pk q yk k =1
s.t.
Ax ≤ b
(7)
Tk x + W y k ≥ h, k = 1,⋅ ⋅ ⋅, nk x ∈ R+n1 , yk ∈ R+n2 where nk is the number of points used to discretize ε and pk is the probability of realization of point k. Without loss of generality, this formulation shows that, if q is deterministic, the optimal value of x also satisfies the relations: min g = c x + q y rel
s.t.
Ax ≤ b
(8)
T x +W y ≥ h x ∈ R+n1 , y ∈ R+n2
where the relative minimum indicates that the optimal value of g is not the absolute minimum of this problem. In fact, it corresponds to the optimal value of x that leads to the minimum expected cost evaluated against all possible realizations of x, which is not reflected here. Although the apparent similarity with the standard LP formulation, the optimal solution of x and y is not a basic solution of this problem. Although the apparent simplicity, the utilization of formulation (7) is restricted to problems with few decision variables and restrictions, and small values of nk. As nk increases, the number of terms in the objective function and the number of restrictions increase. Nevertheless, an equivalent formulation of this problem, which has some computational advantages, may be constructed introducing the expected values of the second-stage variables:
min g = c x + q y s.t.
Ax ≤ b
(9)
Tk x + W yk ≥ h, k = 1,⋅ ⋅ ⋅, nk nk
∑ pk k =1
yk − y = 0
x ∈ R+n1 , y k , y ∈ R+n 2
This approach maintains the number of terms in the objective function constant, as nk increases, and determines simultaneously the expected values of the second stage variables. The drawback is a few more restrictions. 4. The Numerical Approach The numerical techniques used, most frequently, to solve the two-stage SLP problem seek to approximate numerically the expected value function, using scenarios for the realizations of ε, and solving then a nonlinear optimization problem (e.g. [8], [9] and [10]). The complexity of these approaches has restricted them to the consideration of few alternatives of realization of ε, or to the utilization of the Monte Carlo method.
The numerical approach implemented in this work seeks to take advantage of the original LP structure, avoiding the evaluation of the expected value function. For this purpose a solution xk ′′ of x for each realization εk ′′ ( k ′′ = 1,⋅ ⋅ ⋅, nk ) of ε is determined first, using the following deterministic LP problem:
min g k ′′ = c xk ′′ + q yk ′′ s.t.
A xk ′′ ≤ b
(10)
Tk ′′ xk ′′ + W y k ′′ ≥ h xk ′′ ∈ R+n1 , yk ′′ ∈ R+n2 where g k ′′ and yk ′′ represent the minimum cost and the recourse action if the realization of ε is εk ′′ , respectively. These values would correspond to the optimum solution if the decision maker would be able to know in advance the realization of ε. Then, to evaluate the expected cost and the expected recourse action ( g k ′′ and yk ′′ ) associated to xk ′′ , expressions similar to equations (4:a,b) can be used to evaluate the values of yk ( k = 1,⋅ ⋅ ⋅, nk ) correspondent to all realization of ε. Alternatively, in the general case of complete recourse, the values of gk and yk can be determined from the following deterministic LP problem:
min g k = c xk + q yk s.t.
xk = xk ′′
(11)
Tk xk + W y k ≥ h xk ∈ R+n1 , yk ∈ R+n2 After this process the values of g k ′′ and yk ′′ associated to xk ′′ are evaluated from: nk
yk ′′ = ∑ pk yk
(12a)
g k ′′ = c xk ′′ + q yk ′′
(12b)
k =1
The best decision xk ′′ , among those analyzed, is then the one that has the lower expected cost g k ′′ . Although, for many practical purposes, this may be a satisfactory solution, in general, it is not the optimal one. To improve the solution obtained with the procedure described above, we might think in considering small changes around the best xk ′′ in order to identify a direction of improvement. However, in the general case, this is impractical because any new solution of x has to satisfy the constraints A x ≤ b , and arbitrary small changes do not. To overcome this obstacle, the procedure adopted in this work consists in inducing the desirable changes in xk ′′ by using an artificial technological matrix, which is obtained modifying the components of the technological matrix correspondent to the best xk ′′ . This matrix is used only to generate the new estimation of x, which is then evaluated using again equations (4:a,b), or solving problem (11), to determine all the recourse actions and then the correspondent expected value and the expected cost. In this way the improvement of the solution can be achieved using standard optimization searching techniques. 5. The Probability Distributions The probability distributions of the random parameters involved in the SLP problem are defined considering the possibility that some of them may be physically restricted to a given limited domain. Since a transformation can be used to convert a limited domain in the interval [0, 1], the procedure adopted illustrates essentially this case. The assumptions of independent, or perfectly correlated, continues random parameters are also adopted. Nevertheless, these restrictions are not absolutely necessary (e.g. [11]). Without loss of generality, it can be assumed that each component εi of ε is a stochastic variable with a normalized Gaussian distribution. We presume also that the decision maker knows the expected values and the variance of the uncertain parameters for time T, where the recourse actions have to be taken, and that the shape of the distribution of each parameter is of the Gaussian type (although other shapes can also be assumed). Under this framework, it can be postulated, as well, that each normalized random parameter f depends only on one component of ε and that it is a stochastic time dependent variable following the generalized Wiener process: d f = µ dt + σd z
(13)
where µ is the expected rate of change of f, σ2 is its variance per unit of time and dzi is the Wiener process: d zi = ε i dt
(14)
To determine the discrete distribution, the temporal evolution of f can be simulated using trinomial trees (e.g [12] and [13]), considering one or more time steps. In this approach, three possibilities of evolution, fu, fm, and fd, are considered, in each elemental movement, as represented in the next figure. fu ∆ fu f t + µ ∆t η fm ∆ fd
ft
(t )
fd (t + ∆t )
Figure 1. Elemental trinomial evolution of a stochastic parameter Requiring that the expected value and the variance of the discrete distribution coincide with those of the continues distribution, the expressions that define the probabilities associated to these evolutions are obtained: Pu = Pm = 1 −
σ 2 ∆t + η2 + η ∆ f d ∆ f u (∆ f d + ∆ f u )
(15a)
σ 2 ∆t + η2 − η (∆ f u − ∆ f d ) ∆ fd ∆ fu
Pd =
(15b)
σ 2 ∆t + η2 − η ∆ f u ∆ f d (∆ f d + ∆ f u )
(15c)
where ∆ f d = f m − f d , ∆ f u = f u − f m and η = µ ∆t + ( f t − f m ) . If only a time step is considered, time t is the time for first-stage decisions and t + ∆t the time for second-stage decisions, where the expected value of f is f = ft + µ ∆t and its variance is υ = σ 2 ∆ t . Since ft may be choose arbitrarily, making f t = f leads to µ = 0 .
Then, considering f m = f ( η = 0 ), Pm = 1 / 3 and, in a first iteration, also Pd = Pu = 1 / 3 , the following relations are obtained: ∆ f d = ∆ f u = 1.5 υ
(16)
Subsequently, if from using the restrictions f d ≥ 0 and fu ≤ 1 it is found, for example, that ∆ f d was modified then ∆ f u is recalculated also as ∆ f u = 1.5 υ / (∆ f d ) . Afterwards, if this procedure activates the restriction f u ≤ 1 , ∆ fu is also recalculated as
∆ f u = 1 − f m and the maximum allowed variance for this evolution is reset as υ = ∆ f d ∆ f u / 1.5 . The probabilities of fd and fu are then recalculated using expressions (15:a,c). If more time steps are considered the evolution can be simulated considering a uniform grid, with ∆ f d = ∆ f u = ∆ f , as shown in the next figure. ∆f
ft
t
t + ∆t t + 2 ∆t T = t + 3∆t
h h f Figure 2. Trinomial evolution of the stochastic variable, considering three time steps In this case, considering that (T − t ) σ 2 = υ , each elemental trinomial evolution will have a variance of σ 2 ∆t = υ / nt , where nt is the number of time steps considered. As before, in a first iteration it is also assumed that η = 0 ( ft = f ) and that Pd = Pm = Pu = 1 / 3 , which lead to ∆ f = 1.5 υ / nt . In the case of f < 0.5 (the opposite situation is similar) it can be concluded that nt ∆ f (represented as h in figure 2) should be lower then f (since 0 ≤ f ≤ 1 ). When this condition is not fulfilled, to avoid the
(
)
consideration of negative values of f, it is assumed that ft = h , which leads to µ ( T − t ) = f − h and η = f − h / n . Under these conditions equations (15:a,b,c) can be rewritten as:
α β − 2 2 Pm = 2β − α Pu =
Pd =
(17a) (17b)
α 3β +1− 2 2
(17c)
where: α=
nt υ + f 2
β=
(18a)
h2
f h
(18b)
To guarantee that the three elemental probabilities are positive, the following relation is used: h=
3 nt υ + f 2 4 f
(19)
After the evaluation of the elemental probabilities, the probabilities associated to the values of the random parameter at time T are evaluated using the following recurrence relation: Pi t = Pu Pi −t −11 + Pm Pi t −1 + Pd Pi +t −11
(20)
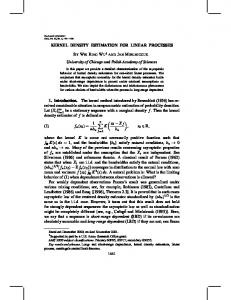
The next two figures are presented to illustrate the shape of the probability distributions implied by these procedures. The values of the probability density function associated to the discrete distribution are obtained dividing the probabilities by ∆ f . Figure 2 compares the trinomial tree distribution, obtained considering 12 time steps, with the standard Gaussian distribution, for a mean value and a variance of 0.5 and 0.01, respectively.
5 4
p( f
)
3 2 1 0 0
0.1 0.2 0.3 0.4 0.5 0.6 0.7 0.8 0.9 f
1
Figure 2: The trinomial tree distribution (symbols) and the standard Gaussian distribution for f = 0.5 , and variance υ = 0.01 The next figure illustrates the behavior of the trinomial distributions when the mean value is close to the boundaries and the variance is high. In this case, the values of p in f = 0 were obtained dividing the correspondent probability by ∆ f / 2 .
10 υ = 0.0050
8
p( f
)
υ = 0.0025
6 4 2 0 0
0.1
0.2
0.3
0.4
0.5
f
Figure 3: Two trinomial tree distributions for f = 0.1 and variances υ = 0.0025 and υ = 0.0050
This figure shows that the Gaussian shape is modified near the boundary closest to the mean value, where the discrete distributions exhibit non-negligible values. However, like the Gaussian distribution, these distributions attribute considerable importance to the information around the mean value. 6. Results and Discussion To illustrate the application of the methodologies presented in the previous sections and to highlight some conclusions, a simple test case adapted from a farming example, presented in [x], is used. With minor modifications, this problem reads as follows. The farmer has 500 acres of land, which he uses to raise wheat, corn, and sugar beets. During the winter, he must decide how much land to devote to each crop. The planting costs are €150, €230 and €260 per acre of land devoted to wheat, corn and sugar beets, respectively. He knows that at least 200 ton of wheat and 240 ton of corn are needed for cattle feed. These amounts can be raised on the farm or bought from a wholesaler. Any production in excess of the feeding requirement will be sold. Selling prices are €170, and €150 per ton of wheat and corn, respectively, and purchase prices are 40% higher. Sugar beets are sold at €36/ton but, due to quota limitations, he is not allowed to sell more than 6000 ton. Based on historical data, the farmer knows that the mean yields on his land are 2.5, 3, and 20 ton/acre, and the variances are 1/6, 6/25 and 32/3, for wheat, corn and sugar beets, respectively. It is assumed here that the yields are Gaussian distributed and perfectly correlated, and that the farmer wants to minimize his expected long run costs. The optimal allocation of land can be determined by solving an SLP problem. Since the random variables of the problem are perfectly correlated, only one random parameter ε1 is needed to describe all random variables. Using the procedure illustrated in the previous section, four distributions were obtained for each random parameter. If the temporal evolution occurs in a time step three possibilities of realization (or scenarios) are considered, while if it occurs in 2, 3 or 4 the possibilities of realization (nk) are 5, 7, and 9, respectively. The probabilities and the values of realization of the random parameters of the model (yields 1, 2 and 3), for each case, are represented in tables 1 and 2, respectively.
nk 3 5 7 9
nk 3 5 7 9 3 5 7 9 3 5 7 9
Table 1. Probabilities of realization for evolutions in 1, 2, 3 and 4 time steps pk ( k = 1,⋅ ⋅ ⋅, nk )
0.0123
0.3333 0.2222 0.2222 0.1975
0.1111 0.1111 0.1235
0.0370 0.0494
0.3333 0.3333 0.2593 0.2346
0.3333 0.2222 0.2222 0.1975
0.1111 0.1111 0.1235
0.0370 0.0494
0.0123
Table 2. Realization values of random parameters (yields 1, 2 and 3) t1k ( k = 1,⋅ ⋅ ⋅, nk )
1.5
1.8
12
1.634 1.75
1.793 1.923 2
2 2.146 2.211 2.25
2.5 2.5 2.5 2.5 t2k ( k = 1,⋅ ⋅ ⋅, nk )
3 2.854 2.789 2.75
3.207 3.077 3
3.366 3.25
3.5
1.961 2.1
2.151 2.307 2.4
2.4 2.576 2.654 2.7
3 3 3 3 t3k ( k = 1,⋅ ⋅ ⋅, nk )
3.6 3.424 3.346 3.3
3.849 3.693 3.6
4.039 3.9
4.2
13.072 14
14.343 15.381 16
16 17.172 17.691 18
20 20 20 20
24 22.828 22.309 22
25.657 24.619 24
26.928 26
28
Considering the k = 1,⋅ ⋅ ⋅, nk possibilities of realization (or scenarios), each with probability pk, the following deterministic equivalent LP problem can be formulated:
min g = 150 x1 + 230 x2 + 260 x3 + 238 y1+ + 210 y2+ − 170 y1− − 150 y2− − 36 y3− s.t.
x1 + x2 + x3 ≤ 500
t1k x1 +
y1+k
t 2 k x2 +
y2+k
−
t3k x3 y3−k
y1−k
(21)
≥ 200
−
y2−k
≥ 240
−
y3−k
≥0
≤ 6000
∑ pk ∑ pk ∑ pk
y1+k − y1+ = 0 y2+k − y2+ = 0 y1−k − y1− = 0
k = 1,⋅ ⋅ ⋅, nk
∑ pk ∑ pk
y2−k − y 2− = 0 y3−k − y3− = 0
xi , y i+ , y i− , y ik+ , y ik− ≥ 0, i = 1, 2, 3, k = 1,⋅ ⋅ ⋅, n k
where the first-stage variable xi is the number of acres devoted to crop i (1 specifies wheat, 2 corn and 3 sugar beats), and the second-stage variables yik+ and yik− represent the number on tons of crop i that will be purchased and sold, respectively, in the case of realization of scenario k. The variables yi+ and yi− are used to represent the expected values of the second-stage variables. The solutions obtained with this formulation are presented in the next table. The results show that the optimal solution is very sensitive to the refinement of the statistical data. Although the relative chances of the expected cost are small (less then 0.52%), there are variables such as y 2+ and y 2− that present high relative changes (up to 146.2%). In the first-stage decisions x1, for example, decreased 18.6 %.
nk
g
3 5 7 9
-108390.0 -107845.2 -107791.7 -107559.9
Table 3. Exact solutions obtained with the deterministic equivalent LP problem x1 x2 x3 y1+ y2+ y1− 170.00 157.16 140.61 138.38
80.00 80.00 90.44 88.89
250.00 262.84 268.94 272.73
0 0 0 0
16.00 15.08 5.80 6.91
225.00 192.91 151.53 145.96
y2−
y3−
16.00 15.08 37.13 33.58
5000.00 5174.08 5263.88 5313.13
Another conclusion that can be drawn from this example is that the number of variables and restrictions necessary to obtain the solution increase with the number of time steps. Since the parameters are perfectly correlated, this increase corresponds to 10 additional variables and two restrictions per time step. Thus, even in this simple case the difficulties of using the deterministic equivalent will come up as the number of time steps used to refine the statistical data increase. The solution based in the evaluation of the first-stage decisions assuming that the decision maker knows what will happen can be used to avoid the obstacles faced by the deterministic approach. In this case, the first stage decisions are evaluated first solving (nk times), for each temporal evolution, the following LP problem:
min g k ′′ = 150 x1k ′′ + 230 x2 k ′′ + 260 x3k ′′ + 238 y1+k ′′ + 210 y2+k ′′ − 170 y1−k ′′ − 150 y2−k ′′ − 36 y3−k ′′ s.t.
x1k ′′ + x2 k ′′ + x3k ′′ ≤ 500
t1k ′′ x1k ′′ +
y1+k ′′
t2 k ′′ x2 k ′′ +
y2+k ′′
−
t3k ′′ x3k ′′ y3−k ′′
y1−k ′′
(22)
≥ 200
−
y2−k ′′
≥ 240
−
y3−k ′′
≥0
≤ 6000
xik ′′ , yi+k ′′ , yi−k ′′ ≥ 0, i = 1,2,3
In the case of nk = 3 , for example, the following values of x were obtained: Table 4. Tentative values for the first-stage decisions ( nk = 3 ) k ′′ x 1k ′′
1
2
3
100.00
120.00
183.33
x 2 k ′′
25.00
80.00
66.67
x 3k ′′
375.00
300.00
250.00
To confront these solutions with all possibilities of realization of the random variables problem (11) can be used. After applying it to the three solutions it was concluded that the one correspondent to k ′′ = 3 is better. The LP problem used to evaluate the solution for this case, can be formulated as follows:
min g k = 150 x1k + 230 x2 k + 260 x3k + 238 y1+k + 210 y2+k − 170 y1−k − 150 y2−k − 36 y3−k s.t.
t1k x1k + y1+k − y1−k ≥ 200 t 2 k x2 k +
y2+k
t3k x3k y3−k
≤ 6000
−
y2−k
≥ 240
−
y3−k
≥0
(23) k = 1,⋅ ⋅ ⋅, nk
x1k = 183.33 x2k = 66.67 x3k = 250.0 xik , yik+ , yik− ≥ 0, i = 1,2,3
Table 5. Approximate solution for the case of nk = 3 k
g
1 2 3 Average
-47700.00 -107683.30 -167666.70 -107683.33
x1
x2
x3
183.33
66.67
250.0
y1+k
y2+k
y1−k
y2−k
y3−k
0 0 0 0
80 40 0 40
166.67 258.33 350.00 258.33
0 0 0 0
4000 5000 6000 5000
Applying this procedure to the other cases (nk equal to 5, 7 and 9) leads to the results presented in the following table:
nk
g
x1
x2
3 5 7 9
-107683.33 -107313.34 -107402.76 -107215.15
183.33 167.07 159.34 154.55
66.67 70.09 71.72 72.73
Table 6. Approximate solutions x3 y1+ 250.00 262.83 268.94 272.73
0.00 0.00 0.00 0.00
y2+
y1−
y2−
y3−
40.00 33.03 29.44 27.47
258.33 217.68 198.35 186.36
0.00 3.31 4.60 5.66
5000.00 5174.08 5263.80 5313.13
Comparing these results with those presented in table 3 leads to the conclusion that, in this example, the two methods lead to similar results, which become closer as the number of time steps used to simulate the temporal evolution of the stochastic variables increase. In general, the differences registered due to the method are lower than the differences due to an increase of one time step. Nevertheless, the approximate results can be improved. For example, in the case of nk = 3 the best solution was obtained considering t = ( 3.0, 3.6, 24.0 ) . Since changing these coefficients individually is not consistent with the reality being modeled, individual changes will be considered artificially only to induce different values of x. It was concluded that if t1 or t3 are modified, in any direction, considering changes of ∆t1 and ∆t3, respectively, the values of x obtained lead to a lower profit (negative cost). However, decreasing t1 from 3.6 to 3.0 lead to the exact solution. 7. Conclusions This article presents the general formulation of two-stage stochastic linear programming problems, giving an overview of the main difficulties in dealing with these problems. The complexities of the models, and the main simplifications usually adopted, are highlighted. The deterministic equivalent formulation of the problem is also presented and it is used to obtain the exact solution of the test case analyzed in this study. An alternative numerical approach to solve Two-Stage SLP Problems is also described here. This approach requires the characterization and discretization of the probability distributions, which is achieved simulating the temporal evolution through generalized Wiener processes and trinomial trees. A test case adapted from an example presented in the literature, is used to evaluate the procedures described in this article. It was concluded that the exact solutions, obtained with the deterministic equivalent formulation are very sensitive to the numerical characterization of the random parameters. The alternative approach suggested is based in the evaluation of the first-stage decisions assuming that the decision maker knows what will happen. These alternative decisions are then confronted with all possibilities of realization of the random parameters. The solutions obtained with this methodology are similar to those obtained with the exact formulation. Thought, the dimensions of the problems solved are very smaller. It was also illustrated that that the results obtained with this approach can be improved if necessary. The methodology adopted in this case is based in the utilization of an artificial technology matrix to induce small changes of the vector of first-stage decisions consistent with the first-stage constraints. References 1. F.H. Murphy, S. Sen and A.L. Soyster. Electric Utility Capacity Expansion Planning with Uncertain Load Forecasts. AIII Transaction, 1982, 14, 52-59. 2. D.R. Carino, T. Kent, D.H. Meyers, C. Stacy, M. Sylvanus, A.L. Turner, K. Watanabe and W.T. Ziemba. The Russell-Yasuda Kasai Model: An Asset/Liability Model for a Japanese Insurance Company Using Multistage Programming. Interfaces, 1994, 24, 29-49. 3. M. Fisher, J. Hammond, W. Obermeyer and A. Raman. Configuring a Supply Chain to Reduce the Cost of Demand Uncertainty. Production and Operations Management, 1997, 6, 211-225. 4. S. Sen, R.D. Doverspike and S. Cosares. Network Planning with Random Demand. Telecommunications Systems, 1994, 3, 1130. 5. J. R. Birge and F. Louveaux. Introduction to Stochastic Programming. Springer-Verlag, 1997. 6. A. Prekopa, Stochastic Programming - Mathematics and Its Applications. Kluwer Academic Publishers, 1995. 7. M.H. Vlerk. Stochastic Programming with Integer Recourse. PhD thesis, Department of Econometrics of the University of Groningen, The Netherlands, 1995. 8. S. Sen and J.L. Higle. An Introduction Tutorial on Stochastic Linear Programming Models. Interfaces, 1999, 29(2): 33-61.
9. A. Shapiro and T. Homem-de-Mello. On the Rate of Convergence of Optimal Solutions of Monte Carlo Approximations of Stochastic Programs. SIAM Journal on Optimization, 2001, 11, 70-86. 10. J.L. Higle and S. Sen. Stochastic decomposition: An algorithm for two-stage linear programs with recourse. Mathematics of Operation Research, 1991, 16(3), 650-669. 11. A. Barreiros. Probability Density Functions for Stochastic Linear Programming. Proc. of CCCT'04, 2004, Austin, USA. 12. J. Hull. Options Futures and Other Derivative Securities. Printice-Hall, 1993. 13. J. Hull and A. White. Valuing Derivative Securities Using the Explicit Finite Difference Method. Journal of Finance and Quantitative Analysis, 1990, 87-100.