2248
IEEE JOURNAL ON SELECTED AREAS IN COMMUNICATIONS, VOL. 23, NO. 12, DECEMBER 2005
Probability Routing Algorithm for Mobile Ad Hoc Networks’ Resources Management Osama H. Hussein, Member, IEEE, Tarek N. Saadawi, and Myung Jong Lee, Senior Member, IEEE
Abstract—This paper introduces a resource management application of a probabilistic-based ant routing algorithm for mobile ad hoc networks (ARAMA) that is inspired from the ant’s life [1]–[5]. Mobile ad hoc networks (MANETs) are highly dynamic, self-configured and self-built networks. The goal of this paper is to present ARAMA ability to manage MANET’s resources by achieving fair network resources distribution, while considering the dynamic characteristics of MANETs and the need for low control overheads. This paper provides a description for the algorithm. In this algorithm, the nodes’ (node’s energy, processing power, . . .) and links’ (bandwidth, . . .) parameters are measured and collected in the nodes’ indices. A path index is used to measure the path total resources and serves to minimize the forward control packet (ant) size. The concepts of negative backward ant destination trail are introduced to enhance the performance of the algorithm. The simulation results show the potential of ARAMA to achieve fair energy usage across the network nodes as an example of the network resource management. More, the results show the general ability of the algorithm to solve MANET’s routing problem.
is used to solve the routing problem and in managing the network resources from the point of view of achieving fair resources usage across the network node. In this paper, we will concentrate at the local energy in the nodes as an example of network resources. In this paper, the algorithm will work only in the network layer and it is not working to conserve physical-layer energy. Section II briefly demonstrates the special characteristic of the MANETs’ routing problem. Section III describes ant colony optimization (ACO) methods. In Section IV, the potential of using ant algorithms in the ad hoc environment and how a real ant colony solves its shortest-path problem is presented. Section V shows a number of ad hoc routing algorithms inspired from the real ant life. In Section VI, the structure of the proposed algorithm is described showing the concepts of negative backward ant and destination trail ant. Section VII has the performance evaluation of the algorithm.
Index Terms—Ad hoc, ant colony algorithm, computer network management, computer system routing, mobile ad hoc network (MANET).
II. ROUTING PROBLEM IN MANETS
I. INTRODUCTION
T
HE NEED FOR infrastructureless networks [known as mobile ad hoc networks (MANETs)] is growing. The nodes in MANETs can be mobile or fixed routers and can be connected by wired or wireless links using one or more different technologies. These nodes function as wireless routers by discovering and maintaining routes to other nodes in the network. In contrast with infrastructured networks, MANETs do not need centralized infrastructures, such as base stations. MANETs should be self-built, self-configured, and adaptive to dynamic changes. In this paper, the application of ant routing algorithm for mobile ad hoc networks (ARAMA) is introduced [1]–[5]. ARAMA Manuscript received September 30, 2004; revised April 16, 2005. Prepared through collaborative participation in the Communications and Networks Consortium supported in part by the U.S. Army Research Laboratory under the Collaborative Technology Alliance Program, Cooperative Agreement DAAD19-01-2-0011. The U.S. Government is authorized to reproduce and distribute reprints for Government purposes notwithstanding any copyright notation thereon. The views and conclusions contained in this document are those of the authors and should not be interpreted as representing the official policies, either expressed or implied, of the Army Research Laboratory or the U.S. Government. O. H. Hussein is with the Department of Computer Engineering Technology, New York City College of Technology, Brooklyn, NY 11201 USA (e-mail:
[email protected]). T. N. Saadawi and M. J. Lee are with the Department of Electrical Engineering, The City College of New York, City University of New York, New York, NY 10031 USA (e-mail:
[email protected];
[email protected]). Digital Object Identifier 10.1109/JSAC.2005.857205
To solve the routing problem in MANETs, the best route should be found while taking into consideration the special network characteristics (i.e., mobility, limited energy, limited bandwidth, limited processing power, and high bit-error rate). In addition, As every node may forward other nodes’ data, the network resources usage (limited energy, limited bandwidth, limited processing power, ) should be fairly distributed across the networks nodes to avoid the high consumption of the resources in some network nodes and low consumption in other nodes. The routing algorithm should deal with the rapid changes in the network and it should have the ability to optimize more than one network parameters in the network. Many routing algorithms have been developed for MANETs; these algorithms can be classified into two groups: table driven routing (such as DSDV, CGSR, GSR, FSR, HSR, WRP, etc.) [6], [7] and source initiated on demand routing (such as AODV, DSR, TORA, ABR, SSR, etc.) [6], [8]. Both groups need large uncontrolled overheads to solve the routing problem. The number of routing packets increases dramatically as the network size increases. This large routing overhead affects the scalability of the network and affects the network performance since it uses a significant part of the wireless bandwidth and of the node’s limited energy and processing power. In addition, most of these algorithms are optimizing only one parameter, which in most cases is the number of hops. III. ANT COLONY OPTIMIZATION (ACO) ALGORITHM The ACO algorithms have been inspired by the behavior of the real ant colony. The algorithm can find the optimum solution
0733-8716/$20.00 © 2005 IEEE
HUSSEIN et al.: PROBABILITY ROUTING ALGORITHM FOR MOBILE AD HOC NETWORKS’ RESOURCES MANAGEMENT
by generating artificial ants. As the real ants search their environment for food, the artificial ants search the solution space. The probabilistic movement of ants in the system allows the ants to explore new paths and to re-explore the old visited paths. The strength of the pheromone deposit directs the artificial ants toward the best paths and the pheromone evaporation allows the system to forget old information and avoid quick convergence to suboptimal solutions. The probabilistic selection of the paths allows searching large number of solutions. ACO has been applied successfully to discrete optimization problems such at as the traveling salesman problem [9], routing [10], [11]. A number of proofs for the convergence to the optimum path of the ACO can be found in [12] and [13].
IV. WHY ARAMA? The application of ARAMA to MANETs has many advantages. ARAMA is a reliable and survivable routing algorithm. ARAMA has many of the on-demand and table routing advantages and at the same time avoids many of their drawbacks. In addition, ARAMA is self-built and self-configured optimization algorithm that matches the characteristics of MANETs. It depends on probability routing tables, thus providing a high number of redundant and already graded paths to the destination, which increases the survivability of the algorithm. When the best path fails (due to mobility, node battery depletion, etc.), the algorithm immediately uses the next available path. These paths increase the survivability of the algorithm. The updating of the tables is done on demand and is done mainly in the nodes, which leads to the best paths. This lowers the overhead comparable to both table driven algorithms and on demand algorithms. Both table driven and on demand algorithms updates needed and unneeded paths to the destination. In ARAMA, every path discovery packet (ant) generated at the source will result in number of receptions/transmissions proportional to the distance (number of hops) from the source to the destination. This number in the ARAMA case is less than the case of other algorithms, which depend on flooding. In these algorithms, every path discovery results in a number of reception/transmissions proportional to the number of nodes in the network. V. EXISTING ANT ROUTING IN MANETS CLASSES A. Ant-Like Mobile Agents Routing Algorithms These algorithms use ant-like mobile agent in the routing process. Agents move in the network randomly to scan large number of network nodes. While it is moving, it collects information about the network and delivers it to the network nodes. The algorithms of this category are not using the agents to optimize the paths as in S-ACO or S-ACO metaheuristic [11]. It is just used to deliver more updated information about the network to the network nodes, which speeds up the optimization process. An example for this category is GPS/ant-like routing algorithm for mobile ad hoc networks [14] and ant-ad hoc on-demand distance vector routing (AODV) hybrid routing protocol [15].
2249
B. Ant Optimization Routing Algorithms In this category, the algorithms use artificial ant colony in the optimization as S-ACO or S-ACO metaheuristic. The ants finds, maintains, and optimizes the best paths. Examples include the following. 1) The Ant-Colony-Based Routing Algorithm (ARA) [16]: In this algorithm, a forward–backward ant technique, which is very close to blind flooding, is still used for path discovery. A modified simpler version of S-ACO has been used. The algorithm stability when applied to large network is questionable because of the use of S-ACO [11]. 2) Ants-Based Routing in Large Scale Mobile Ad Hoc Networks [17]: In this algorithm, all nodes should be aware of their location and other nodes locations. The algorithm protocols works in two layers, logical (upper) layer and lower layer. The algorithm divides the network into regions and considers each region as logical router. Each logical router’s table is distributed on the region’s nodes satisfying some properties such as redundancy. The ant routing algorithm is working in the logical layer. This proposed algorithm is complex because it needs means to determine the locations of all the nodes. In addition, in each layer, forwarding protocol is needed. VI. ANT ROUTING ALGORITHM FOR MOBILE AD HOC NETWORKS (ARAMA) A. The Algorithm [1]–[5] Every node in the network can function as a source node, destination node, and/or intermediate node. A high-level flow chart for these functions is described in Fig. 1. Every node has a pheromone table (Fig. 2) and a probability routing table. The probability routing table can be constructed as follows: for destination D, at node , the probability of selecting a neighbor is if if where is the pheromone value corresponding to neighbor at node . . is the local heuristic value of /or node . . This value can represent the link neighbor’s information (i.e., neighbors queue delay, battery’s remaining energy, processing power, link’s signal-to-noise ratio, link’s bandwidth, bit-error rate, etc.). is a function in and (this function value is high and are high). is the set of all feasible when neighbor nodes defined by the ant’s information and the routing constraints (i.e., the guarantee of loop free). The pheromone values of each entry in the table can be initialized to equal values, thus providing nonbiased search for the best path. If some information about the best path is available, the pheromone values of the entry can be set to closer values to the optimum, thus, speed up the algorithm (see Destination Trail Ants in Section VI-A2). As in most table routing algorithms, ARAMA provides the source with multiple paths to the destination. These paths are graded and ready to be used in case of the failure of the best path. When a node wants to find and/or maintain a path to a destination, it sends forward ants (FAs) searching for this destination [Fig. 1(a)]. Both intermediate and
2250
Fig. 1.
Fig. 2.
IEEE JOURNAL ON SELECTED AREAS IN COMMUNICATIONS, VOL. 23, NO. 12, DECEMBER 2005
High-level flow chart describing node’s functions.
Pheromone table at node i.
source nodes forward the FAs in the same way. A FA carries the path source address, the destination address, the intermediate node’s ids, and the path information (path information will be defined in details in Section VI-C). The FA’s generation rate can be a function of network dynamics, data rate, time, etc.
A FA moves in the network searching for the destination using the intermediate nodes’ probability routing tables [Figs. 1(b) and 3]. The selection of the next neighbor is done randomly according to the probability distribution function . A sufficient number of the ants will visit the neighbor corresponding to the highest probability in the table, however a number of the FAs still has a probability to visit other nodes and other paths still have a probability to be visited (a comprehensive discussion about the number of ants and the ants distribution across neighbors is presented in [3] and [4]). This will increase the number of the FAs visiting nodes in the region around the best path. In addition, it allows a fair number of FAs to visit other regions in the network. Unlike flooding, in this paper, a FA will be forwarded to only one neighbor. When a FA reaches its destination, the information carried by this FA path will be graded (path grading will be defined in details later in Section VI-C). Then, the FA will be killed and a backward ant will be generated [Figs. 1(c) and 3]. A backward ant carries its corresponding FA’s path grade and path’s intermediate nodes ids ant it will be send back following the reverse path of its corresponding FA. As the backward ant moves in the reverse path, the intermediate nodes modify their pheromone table based on the path grade carried by the backward ant and accordingly update their probability routing tables [Figs. 1(d) and 4] (table updating will be defined in details later in Section VI-B). Finally, the source node receives the backward ant, updates its tables, and kills the backward ant [Figs. 1(e) and 4].
HUSSEIN et al.: PROBABILITY ROUTING ALGORITHM FOR MOBILE AD HOC NETWORKS’ RESOURCES MANAGEMENT
2251
Fig. 3. Reception of FAs.
Other types of ants could be used to enhance the algorithm performance. 1) Negative Backward Ants: If a FA experiences any unwanted path constraint (looping, time-to-live (TTL) reached, etc.), it will be killed and a backward ant with negative grade may be generated and will be sent back to the source of the corresponding FA. The negative ant is deemphasizing this path, which will reduce the probability of visiting this path, thus increasing the probability of visiting other paths. 2) Destination Trail Ants: The ant routing algorithm class guarantees to find the optimum solution [12], [13]. However, as the network becomes larger, the probability to find the destination and the optimum solution becomes smaller, which increases the connection setup time (time needed to find the first path) and the initialization/learning time (the time needed to find the optimum path). A new type of ants, which is the “destination trail ants” will be used to overcome this problem. A destination node generates destination trail ants with low rate to insure low overheads. A destination trail ant moves randomly in the network modifying the pheromone tables and probability routing
tables to favor the links, which leads to its origin node. The effect of this ant to the network pheromone table will be called “the destination’s trail.” This will make the pheromone values in some scattered nodes to be biased toward the destination and toward the best path regions. After a few of these ants are sent in the network, the probability of a FA to intersect with one of the trails increases. In addition, these trails are very good pointer to the new location of the destination as it moves. This technique reduces the time needed for connection setup and insures the delivery of data. B. Table Updating When a backward ant is received at intermediate node , the node collects the path grade from this backward ant. This grade will be used to update the pheromone and, hence, the probability routing table entries corresponding to the FA’s destination. For destination D, at intermediate node , the pheromone value on the incoming link of the backward ant is increased and the values . on other links are decreased
2252
IEEE JOURNAL ON SELECTED AREAS IN COMMUNICATIONS, VOL. 23, NO. 12, DECEMBER 2005
is smaller than overall path information, as the value of along the path. At the smallest local normalized parameter the destination, the grade of a FA path from the source node to the destination node D is calculated by comparing its path information (i.e., path index) to a constant/dynamic reference. , which is the best reThis reference is called ceived in the last window (W ants). The grade can be calculated as follows:
Fig. 4.
Reception of backward ant.
Where is the pheromone value corresponding to neighbor at node , and is the number of received backward ants. is the corresponding FA’s path grade. is the evaporation function. The purpose of the evaporation function is to control the rate of forgetting the old paths. Example of such function is . is the enforcement function. The purpose of the enforcement function is to control the speed of responding . to new information. Example of such a function is , , and . Note that: A window mechanism could be used to minimize the use of the backward ants corresponding to low-grade paths in the updating process [3], [4]. C. Path Information and Path Grading The path information includes the node’s local information and global path information. The path information to be collected should be carefully selected. The more information collected about the nodes and path, the closer to optimum is the solution. However, the ants’ sizes will increase, which increases the routing overheads. A good solution for this is the calcufor each node. lation for the local normalized index , where and , is node’s normalized index, is node’s normalized optimization parameter (i.e., the number of hops, delay, battery’s energy, . is the bandwidth, processing power, etc.). weight given to parameter indicating its importance in the optimization. The node has a high potential to be selected as a member in the source-destination path as the value of become closer to unity. for its path. The path index A FA carries the path index is a function of all the nodes’ information along the path. can be the multiplication of all the nodes’ indices for all , where . the nodes in the path. occupy only one field in the FA. Noticing that the value of is less than one, gives a good indication for the number of hops. As the number of hops increases, the multiplication of s decreases. In addition, gives a good evaluation of the
To demonstrate the potentials of ARAMA, the following two examples will be presented. 1) Minimizing the Number of Hops: This can be achieved by . calculating the node index of any node Now, the path index will be equal to , where is the number of hops traveled by the FA. 2) Distributed Energy Usage Across the Network: In MANETs, a large number of nodes is depending on a limited energy sources such as batteries as their source of energy. If the nodes batteries’ remaining energy is not considered in the optimization, the best path’s nodes energy will be used unfairly more than the other nodes in the network. These nodes may fail after a short time because of their battery depletion, however, other nodes in the network may still have high energy in their batteries. At the same time, the usage of energy of some important nodes (i.e., data servers) should be limited to maximize these nodes’ lifetime. The network nodes should be given different priorities with respect to energy usage. , where This can be achieved by making is the number of hops weight, which is constant. is the battery weight. controls the priority of this node. . is constant. is the normalized battery’s remaining energy with respect to the initial battery’s energy. . D. Sending the Data Packets Data can be sent using many techniques. It can be encapsulated in the FAs, sent following the maximum pheromone path, sent following path of the best FA (the best path found) or a combination of them. E. Conceptual Explanation of the Algorithm Referring to Fig. 5(a), the source node wants to establish communications with the destination node. In this figure, for each line, an angle represents an intermediate node. The source node sends FAs in the network [Fig. 5(b)]. These ants will move randomly in the network using the probability routing tables in the nodes. A number of these ants will find the destination node [Fig. 5(c)]. Then, the destination node will send backward ants on the reverse paths of the corresponding FAs. The pheromone on these paths’ will be increased. These paths will have higher pheromone amounts than the entire network, and data packets could be delivered to the destination node. The found paths may not be the best paths. However, because of the probabilistic movement of the ants, other paths will be explored and the ants will find better paths [Fig. 5(d)]. Eventually, the best path will have the highest pheromone amounts on its links [Fig. 5(e)].
HUSSEIN et al.: PROBABILITY ROUTING ALGORITHM FOR MOBILE AD HOC NETWORKS’ RESOURCES MANAGEMENT
Fig. 5.
2253
Schematic elaboration for how ARAMA works.
If another node wants to find the same destination [Fig. 5(f)], it sends FAs. These ants move randomly in the network. When one of these ants intersects with an existing path to the destination, it will follow, probabilistically, the pheromone on this path to reach the destination since the amount of pheromone is higher in this path direction. The backward ant will update the pheromone on the intermediate nodes. In Fig. 5, if only one parameter is used for optimization—the number of hops in this example—the two hops path will be used until its node battery’s remaining energy is depleted and the path fails. Then, the algorithm will switch to the three hops path until the path nodes’ batteries die; then the algorithm will switch to the four hops path. It is not fair to the minimum hop path in the sense of energy usage. In this case, the battery’s remaining energy should be used for optimization, in addition to the primary optimization parameter. If the remaining local energy in the nodes’ batteries are considered as a parameter in the optimization, this network may respond as follows: the two hops path has the minimum number of hops and it will be used. When the node battery’s remaining energy in this path decreases to a certain threshold, the three hops path information will be better and the data packets will use this path. When this path nodes batteries’ remaining energy decrease to the threshold, the data packets will switch to the four hops path. When the nodes batteries’ remaining energy in the four hops path decrease, the data packets will switch back to the two hops path. The value of this threshold can be controlled and it affects the switching frequency between paths [3], [4]. Fig. 6 shows how the concept of destination trail ant works. In Fig. 6(b), the destination nodes send randomly destination trail ants, which increase the pheromone on the direction toward the destination. When the source sends a FA [Fig. 6(c)] searching for the destination, with high probability, the FA may intersect with one of the destination trails [Fig. 6(d)] and the FA will follow the high pheromone on the trail [Fig. 6(e)]. If the destination node moves [Fig. 6(f)], the new trails, which are formed by the trail ants from the destination new location, will
Fig. 6. Schematic elaboration for how destination trail ants technique works.
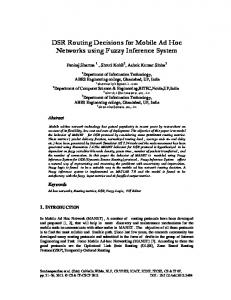
Fig. 7.
ARAMA OPNET model structure.
intersect with the old ones, and the FAs are still able to reach the destination node. VII. PERFORMANCE EVALUATION We have implemented an OPNET simulation model for MANET node as a platform to study the performance of ARAMA. Fig. 7 shows the model used for simulation in this paper. The node model has the OPNET wireless local area network (LAN) as an access layer. The routing layer uses ARAMA as the routing algorithm and a simple first-in–first-out (FIFO) queue. The application layer uses OPNET simple source and sink. In addition, a battery model has been added
2254
IEEE JOURNAL ON SELECTED AREAS IN COMMUNICATIONS, VOL. 23, NO. 12, DECEMBER 2005
to the NIST/AODV OPNET model [18] to be used in the comparison. The algorithm has many parameters and features. The simulation results show the potential of the algorithm in achieving fair energy distribution across the network nodes as an example of network resources management. In addition, the results show the ability of the algorithm to respond to dynamic changes in the network and to consider more than one parameter in the routing. The following definitions will be used in this section discussion. Nnode failure: a node in the network fails when its energy is depleted. Network failure: the network fails when there are no paths available to deliver data to the destination due to energy depletion. Fig. 8. Network topology.
A. Algorithm Parameters The
values
of
the
ARAMA
parameters
are:
, , ,
.
,
,
'
,
'
, , and the ,
. The grading Function , where the scaling is constant , the bias constant and . The effect of all these parameters can be found in [3] and [4]. The nodes’ communication ranges are 300 m (constant). In this model, the data is sent using the best path found technique (Section VI-D). The negative backward ant and the destination trail ant techniques are not enabled. Note that a large data rate has been selected to consume more energy rapidly. B. Battery Model Here, all the nodes use batteries as their source of energy. The energy in a battery will decrease when a packet is sent or received. In this paper, a battery model for the “Lucent waveLAN PC card 2.4 GH direct sequence spread spectrum” [19] has been simplified and use in the node models. From this battery model, only the power consumed by routing (FAs, backward ants, hello messages, reply messages, path request, and path reply) and data packets is considered in this battery model. The power consumed by lower layers is not included. The equations governing the battery model are as follows (simplified version of [19]). When a node sends a packet
When a node receives a packet
where
and
C. Simulation Results Section VII-C1 presents a comparison between ARAMA and AODV [8] on relatively small network to show the advantage of
ARAMA over AODV with respect to following closer to optimum solution. Section VII-C2 presents a comparison between ARAMA and AODV on a larger network to show the advantage of ARAMA with respect to considering the local nodes energy (as an example of network resource) in routing. Section VII-C3 shows the ability of ARAMA to solve the routing problem for larger networks and under mobility conditions. We have conducted many simulations for different size networks. In this paper, we represent the simulation results for a 12 nodes, 19 nodes, and 30 nodes networks are presented. The use of small and medium size networks will allow the trace of low-level details for the responses of the algorithm. In addition, the optimum solution could easily be calculated, which will allow accurate comparison to the optimum. 1) Finding the Best Path: The scenarios presented in this section are based on the network shown in Fig. 8. AODV and ARAMA have been applied to the same scenarios to compare the performance of both algorithms. Here, a simple none mobile (12 static nodes-600 m X 600 m) network has been used to allow the isolation and clear analyses of the responses of the two algorithms. The network has 12 stationary nodes. All the nodes are stationary. Each scenario has been repeated many times with different simulator seed to test the algorithm reliability. Here, for the reason of simplifying the presentation in this paper, only five (S1, S2, S3, S4, S5) of these simulation results are being presented in this section, however, other simulations have been conducted (57 different seeds), which have very similar results to the results presented here. Simulations have been done to compare between performance of ARAMA and AODV (as example for an on-demand algorithm) when optimizing only the number of hops. There are many possible paths from the source to the destination. The marked dashed paths on Fig. 8 are the feasible paths by the algorithm. Many paths (marked black) are eliminated by the algorithm. For example, the path 1-2-3-9-0 is impossible to be used. The path 1-3-9-0 is a part of the path is the multiplication of the path’s and 1-2-3-9-0. As , then of the path 1-3-9-0 is always greater than all of the path 1-2-3-9-0. Fig. 9 shows the number of hops traveled by the received packets for a number of scenarios. In these scenarios, only the number of hop is optimized by applying AODV and ARAMA. S1, S2, S3, S4, and S5 represent five identical scenarios except for the random seed of the simulator. From this figure, we notice
HUSSEIN et al.: PROBABILITY ROUTING ALGORITHM FOR MOBILE AD HOC NETWORKS’ RESOURCES MANAGEMENT
2255
Fig. 9. Number of hops traveled by the received packets in AODV and ARAMA.
the following: for AODV [Fig. 9(a)], the algorithm is following the optimum solution in the scenarios S1 and S4. First, the algorithm is using the two hops paths, which are 1-6-0, 1-7-0, and 1-8-0. When node 6, 7, 8 batteries are depleted, the network switches to the next best paths (three hops), which are 1-3-9-0 and 1-4-10-0. When the three hops paths fail due to energy depletion, the network switches to the next best path (four hops), which is 1-2-5-11-0. When this path fails, the network fails. In some unlucky cases, the algorithm (due ant delay or ant loss) may use nonoptimum path. The algorithm will keep using this active nonoptimal path until it fails. Only when this nonoptimum path fails, the algorithm will research for the optimum path. For example, in S2, S3, and S5, the algorithm switch to the three hops path, while a two hops path is valid, after the three hops path fails, the algorithm search for the optimum path then switch to the two hops path. For ARAMA [Fig. 9(b)], the algorithm is following the optimum solution most of the time. Even if the algorithm drifts from the optimum for a short period, the algorithm quickly switches back to the optimum. Using controlled number of ants, the algorithm is continuously searching for the optimum solution, even a path between the source and the destination is active. For example, in Fig. 9(b), scenario S5, the algorithm starts by using the two hops paths, at time 12 m 56 s, the algorithm switches to a three hops path (due to an error or ant loss), a two hops path still exist and the algorithm quickly switch back to the two hops path. In Fig. 9(b), S1, S2, S3, S4 and S5, it can be seen that there is a small drift from the optimum, but
Fig. 10.
Network topology.
in general, the algorithm is following the minimum number of hops. 2) Fair Nodes’ Local Energy Usage Distribution: ARAMA has been applied to optimize the number of hops and the nodes batteries’ remaining energy. In this section, we are presenting the application of ARAMA and AODV to 19 nodes network (Fig. 10). We are using one source-destination pair. The source is node_1 and the destination is node_0. Five scenarios are presented. All the five scenarios have the same setting except for the simulator seed. We will refer to these scenarios as S1, S2,
2256
IEEE JOURNAL ON SELECTED AREAS IN COMMUNICATIONS, VOL. 23, NO. 12, DECEMBER 2005
Fig. 11.
Scenario S2 nodes’ remaining energy, average, and standard deviation.
Fig. 12.
Nodes’ standard deviation.
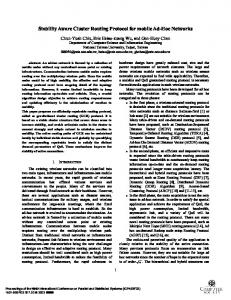
S3, S4, and S5. We will use the following definition. Energy standard divination: the remaining nodes’ energy standard deviation from the average remaining energy for all the network nodes. We are going to use the first node failure time to show the speed of nodes’ energy depletion. Figs. 11 and 12 show the nodes’ battery’s remaining energy responses on the y-axis and the simulation time in the axis. Fig. 11 shows the nodes’ batteries’ remaining energy for AODV and ARAMA for scenario S2. In addition, Fig. 11 shows the average energy and the standard deviation from that average for the network’s nodes. From Fig. 11, we notice the following: The first node failure time is 480 in the AODV case and 1764
in the ARAMA case. Notice that the first node failure time in the ARAMA case is higher than the AODV case by 376.5%. In AODV, the first node failed, it had energy for only the first 20% of the network lifetime. This node was a member of the best path and all the data will be forwarded to it until its energy is depleted. In ARAMA case, the first node failed, it had energy for 75% of the network lifetime. This enhancement happened because the energy usage is distributed across the network nodes. The remaining nodes’ energies have closer values in the case of ARAMA than the AODV case. The maximum energy standard deviation is 10 Ws in AODV case and 6 Ws in ARAMA case. We notice the unfairness in nodes’ energy usage in the case
HUSSEIN et al.: PROBABILITY ROUTING ALGORITHM FOR MOBILE AD HOC NETWORKS’ RESOURCES MANAGEMENT
2257
TABLE I NETWORK FAILURE TIME AND FIRST NODE FAILURE TIME
TABLE II MAXIMUM ENERGY STANDARD DEVIATION IN WATTS PER SECOND
TABLE III NUMBER OF DELIVERED PACKET
of AODV, while more fair energy usage could be achieved by the application of ARAMA. Fig. 12 shows the energy standard deviation for all the five scenarios of the AODV and ARAMA cases. We notice that the maximum standard deviation is lower by about 60% in the ARAMA case than the AODV case. Tables I–III shows a summary for the results for both AODV and ARAMA for the five scenarios. Table I shows the network failure time in seconds and first node failure time in seconds and in percentage with respect to the network lifetime. Table II shows the maximum energy standard deviation. Table III shows the number of packets delivered. From Table I, we notice that the first node failure time is higher in the case of ARAMA. In AODV scenarios, the first node fails after only 20% of the network lifetime (failure time), however, in ARAMA scenarios, the first node failure time ranges from 59% to 77% of the network lifetime. The maximum energy standard deviation is lower by about 60% in the case of ARAMA. The number of delivered packets and the network failure time is lower in the case of ARAMA. The number of delivered packets ratio of ARAMA with respect to AODV ranges from 78% to 82%. In the AODV case, the energy of the first node failed is unfairly depleted in a time close to the network starting time, however, in the ARAMA case, the first node failure time is close to the network failure time. The energy of the network’s nodes is more fairly distributed in the case of ARAMA. The number of delivered packets is less in the case of ARAMA, This packet loss is due to the frequent switching of the best route to fairly distribute the energy usage. 3) Survivability in Larger Networks Under Mobility Conditions: We have applied the algorithm to a 30 nodes network to investigate the dynamic response of the algorithm to dynamic changes due to mobility. We have applied the algorithm to mini-
TABLE IV SCENARIOS COMMON PARAMETERS
Fig. 13. Max_speed 2.5 m/s.
mize the number of hops of the data packets paths. Tables IV and V show the scenarios parameters. Figs. 13–15 show the simulation results for the six scenarios. The figures show the number of received packets at the destination on the axis and their corresponding number of hops at the axis. We have noticed that the algorithm has the ability to respond to dynamic changes in the network due to mobility and it delivers packets from the source
2258
IEEE JOURNAL ON SELECTED AREAS IN COMMUNICATIONS, VOL. 23, NO. 12, DECEMBER 2005
TABLE V SCENARIOS PARAMETERS
parameters. The algorithm has the ability to continuously check for better paths in the network with controlled overheads, which make the algorithm more suitable for network resources management. ARAMA combines many advantages of the on-demand-based and table-based routing algorithms. The redundant paths increase the survivability of the algorithm. Simulation results show the ability of the algorithm to find the optimum solution and to achieve fair energy usage distribution as an example of network resources management. REFERENCES Fig. 14.
Max_speed 5 m/s.
Fig. 15.
Max_speed 10 m/s.
to destination. In addition, we have noticed that as FA’s rate increases, the performance of the algorithm is enhanced. By comparing the number of received packets between the 1 ants/s and the 2 ants/s results, we have found that the number of packets received at lower number of hops increase as the FA’s rate increases. The number of received packets at lower number of hops is higher in the case of 2 ants/s. VIII. CONCLUSION ARAMA is a suitable routing algorithm for managing the energy usage in MANETs. ARAMA is a dynamic routing algorithm with controlled routing overheads. The routing packets are concentrated in the best paths regions. This allows better optimization with lower number of packets. In addition, old explored, unexplored, and bad region are visited with lower rate. This controlled overhead increases the scalability of ARAMA. In addition, ARAMA is self-built and self-configured optimization algorithm that matches the characteristics of MANETs. The algorithm can use different parameters in the optimization process. In this paper, the number of hops and the batteries’ remaining energy have been applied as optimization
[1] O. Hussein and T. Saadawi, “Ant routing algorithm for mobile ad hoc networks,” in Proc. 22nd IEEE Int. Perform., Comput., Commun, Conf., Phoenix, AZ, April 2003, pp. 281–290. [2] O. Hussein, T. Saadawi, and M. Lee, “Ant routing algorithm for mobile ad hoc networks,” in Proc. ARL CTAC2003, Apr. 2003, pp. 141–145. [3] O. Hussein and T. Saadawi, “Ant routing algorithm for mobile ad hoc networks,” Elec. Eng. Dept., City College of New York/CUNY, New York, Tech. Rep., Sep. 4th, 2002. [4] O. Hussein, “Biological based routing algorithm for mobile ad hoc networks,” Ph.D. dissertation, Elec. Eng. Dept., The City College of New York, New York, Dec. 2004. [5] T. Saadawi and O. Hussein, “Routing method for mobile infrastructureless network,” U.S. Patent 6 940 823, Filed Jan. 17, 2003, Issued Sep. 6, 2005. [6] E. Royer and C.-K. Toh, “A review of current routing protocols for ad hoc mobile wireless networks,” IEEE Pers. Commun. Mag., vol. 6, no. 2, pp. 46–55, Apr. 1999. [7] C. E. Perkins and P. Bhagwat, “Highly dynamic destination sequenced distance vector routing for mobile computers,” Comput. Commun. Rev., pp. 234–244, Oct. 1994. [8] C. E. Perkins and E. Royer, “Ad hoc on-demand distance vector routing,” in Proc. 2nd IEEE Workshop Mobile Comput. Syst. Applicat., New Orleans, LA, Feb. 1999, pp. 90–100. [9] T. Stutzle and H. H. Hoos, “The MAX-MIN ant system and local search for the traveling salesman problem,” in Proc. IEEE Int. Conf. Evol. Comput., 1997, pp. 309–314. [10] G. Di Caro and M. Dorigo, “AntNet: distributed stigmergetic control for communications networks,” J. Artif. Intell. Res., vol. 9, pp. 317–365, 1998. [11] M. Dorigo and G. Di Caro, The Ant Colony Optimization MetaHeuristic, New Ideas in Optimization, D. Corne, M. Dorigo, and F. Glover, Eds. New York: McGraw-Hill, 1999, pp. 11–32. [12] W. J. Gutjahr, “ACO algorithms with guaranteed convergence to the optimal solution,” Univ. Vienna, Vienna, Austria, Tech. Rep., ISDS 2001-02. [13] T. Stutzle and M. Dorigo, “A short convergence proof for a class of ACO algorithms,” IRIDIA, Brussels, Belgium, Tech. Rep. 2000-35. [14] D. Câamara and A. A. F. Loureiro, “A GPS/ant-like routing algorithm for ad hoc networks,” in Proc. IEEE Wireless Commun. Netw. Conf., Sep. 2000, pp. 1232–1236. [15] S. Marwaha, C. K. Tham, and D. Srinivasan, “Mobile agents based routing protocol for mobile ad hoc networks,” in Proc. IEEE GLOBECOM, Nov. 2002, pp. 163–167. [16] M. Günes and O. Spaniol, “Routing algorithms for mobile multihop ad hoc networks,” in Proc. Next Generation Netw. Technol. Int. Workshop, Oct. 2002. [17] M. Heissenbüttel and T. Braun, “Ants-based routing in large scale mobile ad hoc networks,” in Proc. Kommunikation in Verteilten Systemen (KiVS03), Mar. 2003.
HUSSEIN et al.: PROBABILITY ROUTING ALGORITHM FOR MOBILE AD HOC NETWORKS’ RESOURCES MANAGEMENT
[18] L. Guemari. Simulation model for the AODV MANET routing protocol. Nat. Inst. Standards and Technol. (NIST). [Online]. Available: http://www.antd.nist.gov/wctg/manet/prd_aodvfiles.html [19] L. M. Feeney, “An energy consumption model for performance analysis of routing protocols for mobile ad hoc networks,” Mobile and Netw., vol. 6, no. 3, pp. 139–249, Jun. 2001.
Osama H. Hussein (M’04) received the B.Sc. degree in electrical engineering from Ain Shams University, Cairo, Egypt, in 1998, and the M.Phil. and Ph.D. degrees in electrical engineering from the City University of New York, in 2002 and 2005, respectively, all in electrical engineering. Currently, he is an Assistant Professor at New York City College of Technology, City University of New York, Brooklyn. He holds one U.S. patent. His current research interests are telecommunications networks and ad hoc networks. Dr. Hussein received the Distinction with Honor from Ain Shams University. He was awarded the Science Fellowship from the Graduate School, City University of New York.
2259
Tarek N. Saadawi received the B.Sc. and M.Sc. degrees in electrical engineering from Cairo University, Cairo, Egypt, and the Ph.D. degree in electrical engineering from the University of Maryland, College Park. Since 1980, he has been with the Department of Electrical Engineering, City College of New York (CCNY), The City University of New York, where he currently directs the Information Networking and Telecommunications Group at CCNY. He has published extensively in the area of telecommunications networks. His current research interests are telecommunications networks, high-speed networks, multimedia networks, ad hoc networks, and packet radio networks. He is a coauthor of a text book on telecommunications. He is also the lead author of Egypt Telecommunications Infrastructure Master Plan covering the fiber network, IP/ATM, DSL, and the wireless local loop. Dr. Saadawi received the IEEE Region 1 Award in 1987. He is a Former Chairman of the IEEE Computer Society (1986–1987)
Myung Jong Lee (SM’98) received the B.S. degree from Seoul National University, Seoul, Korea, and the M.S. and Ph.D. degrees in electrical engineering from Columbia University, New York, in 1986 and 1990, respectively. He is currently a Professor in the Department of Electrical Engineering, City University of New York, and also the Director of Samsung-CUNY Joint Laboratory. He was on leave to Telcordia and Samsung Advanced Institute of Technology. He actively participates in the international standardizations IEEE 802.15 WG’s (WPAN) and ZigBee Alliance, as the Vice Chair for both WPAN Mesh TG and Networking WG. He has published over 100 journal and conference papers and holds 16 U.S. patents. His research interests include wireless sensor networks, ad hoc networks, wireless networking security, and cross-layer optimization of CDMA systems. Dr. Lee received CUNY Excellence Performance Award (1999) and the IEEE CCNC Best Paper Award (2005).