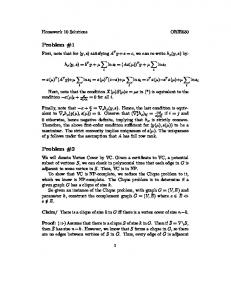
Problem 2: Plate with a hole in tension. ADINA R & D, Inc. 2-1. Problem
description. A plate with a hole is subjected to tension as shown: y x. Thickness =
1 mm.
Problem 2: Plate with a hole in tension
Problem description A plate with a hole is subjected to tension as shown: y p = 25.0 N/mm2
Region to mesh
All lengths in mm. Thickness = 1 mm x
56
E = 7.0 ´ 104 N/mm2 n = 0.25
10
20
In this problem solution, we will demonstrate the following topics that have not been presented in previous problems: • Defining a problem heading • Selecting master degrees of freedom • Entering a geometry point in a cylindrical coordinate system • Defining several geometry surfaces • Defining boundary conditions • Querying the graphics with the mouse • Generating elements onto geometry surfaces, ensuring compatibility • Displaying geometry point, line and surface numbers • Zooming into the graphics window • Plotting original and deformed meshes • Moving and resizing mesh plots with the mouse • Deleting unwanted text with the mouse • Plotting element vectors • Plotting stress bands
ADINA R & D, Inc.
2-1
Problem 2: Plate with a hole in tension
• Graphing stresses along a line • Modifying a graph plot We assume that you have worked through problem 1, or have equivalent experience with the ADINA System. Before you begin Please refer to the Icon Locator Tables chapter of the Primer for the locations of all of the AUI icons. Please refer to the Hints chapter of the Primer for useful hints. This problem can be solved with the 900 nodes version of the ADINA System. Invoking the AUI and choosing the finite element program Invoke the AUI and set the Program Module drop-down list to ADINA Structures. Defining model control data Problem heading: Choose ControlHeading, enter the heading “Problem 2: Plate with a hole in tension” and click OK. Plane for 2D elements: Choose ControlMiscellaneous Options, set the "2D Solid Elements in" field to "XY-Plane, Y-Axisymmetric" and click OK. Master degrees of freedom: Choose ControlDegrees of Freedom, uncheck the Z-Translation, X-Rotation, Y-Rotation and Z-Rotation buttons and click OK. (We perform this step because the two-dimensional solid elements that we will use only provide stiffness for the x-translation and y-translation degrees of freedom. If you omit this step, the AUI will delete the z-translation, x-rotation, y-rotation and z-rotation degrees of freedom for all the nodes when you generate the ADINA Structures data file. So this step is not necessary; ADINA Structures will give the same solution whether or not you perform this step. However, ADINA Structures runs more efficiently if you perform this step.)
2-2
ADINA Primer
Problem 2: Plate with a hole in tension
Defining model geometry Here is a diagram showing the key geometry used in defining this model:
y L8
P2
S3
L9
P7
P3 L4 P4
S1 L1
P8
P1
P9 S2 L2 P5 L6 P6
x
Points: Click the Define Points icon , enter the following information into the X1, X2 columns of the table (you can leave the X3 column blank), then click OK. Point # 1 2 3 4 5 6 7 8
X1 10 0 0 0 5 10 10 0
ADINA R & D, Inc.
X2 28 28 10 5 0 0 10 0
2-3
Problem 2: Plate with a hole in tension
We also need a point mid-way along the hole. The coordinates of this point are most conveniently entered using a cylindrical coordinate system. Click the Coordinate Systems , add coordinate system 1 and set the Type to Cylindrical. Set the components of icon Vector A to (0, 0, 1), the components of Vector B to (1, 0, 0) and click OK. (Vector A gives the direction of the cylindrical axis, and vector B is used to determine the line corresponding to zero angle , as shown in the following figure.)
y r Vector A z Then click the Define Points icon Point # 9
X1 5
X2 45
Vector B
q
x
(X1, X2)=(r, q)
, add an additional row to the table if necessary, enter
X3 0
and click OK. The graphics window should look something like this: TIME 1.000
Y Z
2-4
X
ADINA Primer
Problem 2: Plate with a hole in tension
Arc lines: Click the Define Lines icon , add line 1, set the Type to Arc, set P1 to 4, P2 to 9, Center to 8 and click Save. Then add line 2, set P1 to 9, P2 to 5, Center to 8 and click OK. The graphics window should look something like this: TIME 1.000
Y Z
X
Surfaces: Click the Define Surfaces icon , add surface 1, make sure that the Type is set to Vertex, define the following surfaces and click OK. (Click Add after defining surfaces 1 and 2.) Surface Number 1 2 3
Point 1 7 7 1
Point 2 3 9 2
Point 3 4 5 3
Point 4 9 6 7
To display the geometry point, line and surface numbers, click the Point Labels icon Line/Edge Labels icon and Surface/Face Labels icon look something like the figure on the next page.
ADINA R & D, Inc.
,
. The graphics window should
2-5
Problem 2: Plate with a hole in tension TIME 1.000
Y L8
P2
L9
L3
P4 L1
S1
Z
X
L10
S3
P3 L4
P1
P7 L5 L7 S2
P9 L2
P8
P5
L6
P6
Defining and applying boundary conditions We need two boundary conditions for modeling symmetry. Click the Apply Fixity icon and click the Define... button. In the Define Fixity dialog box, add fixity name YT, check the Y-Translation button and click Save. Then add fixity name XT, check the X-Translation button and click OK. In the Apply Fixity dialog box, set the “Apply to” field to Edge/Line. To set the fixity for lines 4 and 9 to XT, set the Fixity Name to XT and enter 4 and 9 in the first two rows of the table. To set the fixity for line 6 to YT, set the Fixity Name to YT and enter 6 in the first row of the table. Then click OK. When you click the Boundary Plot icon the top figure on the next page.
, the graphics window should look something like
Notice that line 6 is marked with a B. The table at the lower right of the graphics window indicates that the U1 (x) degree of freedom is free and that the U2 (y) degree of freedom is fixed. Similarly, lines 4 and 9 are marked with a C, and the table indicates that the U1 (x) degree of freedom is fixed and that the U2 (y) degree of freedom is free.
2-6
ADINA Primer
Problem 2: Plate with a hole in tension TIME 1.000
Y L8
P2
C L9
C L4
L3
P4 L1
S1
P7 L5 L7 S2
P9 L2
P8
X
L10
S3
P3
Z
P1
P5 B L6
P6
B C
U U 1 2 -
Defining and applying loads Click the Apply Load icon , set the Load Type to Pressure and click the Define... button to the right of the Load Number field. In the Define Pressure dialog box, add pressure 1, set the Magnitude to -25 and click OK. In the Apply Load dialog box, make sure that the “Apply to” field is set to Line and, in the first row of the table, set the Line # to 8. Click OK to close the Apply Load dialog box. When you click the Load Plot icon figure on the next page.
, the graphics window should look something like the
Defining the material and click the Elastic Isotropic button. In the Define Click the Manage Materials icon Isotropic Linear Elastic Material dialog box, add material 1, set the Young's Modulus to 7E4, the Poisson's ratio to 0.25 and click OK. Click Close to close the Manage Material Definitions dialog box.
ADINA R & D, Inc.
2-7
Problem 2: Plate with a hole in tension Y
TIME 1.000 L8
P2
Z
P1
X
PRESCRIBED PRESSURE TIME 1.000 C L9
L3
P3 C L4 P4 L1
L10
S3
S1
25.00
P7 L5 L7 S2
P9 L2
P8
P5 B L6
P6
B C
U U 1 2 -
Defining the elements Element group: Click the Element Groups icon , add group number 1, set the Type to 2-D Solid, set the Element Sub-Type to Plane Stress and click OK. Subdivision data: In this mesh, we will assign a uniform point size to all points and have the AUI automatically compute the subdivisions. Choose MeshingMesh Density Complete Model, make sure that the “Subdivision Mode” is set to “Use End-Point Sizes” and click OK. Now choose MeshingMesh DensityPoint Size, set the “Points Defined from” field to “All Geometry Points”, set the Maximum to 2 and click OK. The graphics window should look something like the top figure on the next page. Element generation: Click the Mesh Surfaces icon , enter 1, 2, 3 in the first three rows of the Surface # table and click OK. The graphics window should look something like the bottom figure on the next page. Note, if the pressure magnitude is 0, return to the ControlMiscellaneous Options dialog box and make sure that the "2D Solid Elements in" field is set to "XY-Plane, Y-Axisymmetric".
2-8
ADINA Primer
Problem 2: Plate with a hole in tension
Y
TIME 1.000 P2
Z
P1
L8
X
PRESCRIBED PRESSURE TIME 1.000 C L9
P3 C L4 P4 L1
L10
S3
P7
L3 S1
25.00
L5 L7 S2
P9 L2
P5 B L6
P8
P6
B C
U U 1 2 -
Y
TIME 1.000 C C C C C C C C C C C C C C C C C C C C C C C C C C
L8
P2
Z
P1
X
PRESCRIBED PRESSURE TIME 1.000 L9
P3 L4 P4 L1
P8
L10
S3
P7
L3 S1
25.00
L5 L7
P9
S2
L2 BBBBBBB P5 B L6 P6
B C
U U 1 2 -
The mesh does not look very pleasing near the hole. We will remesh near the hole, adding more elements. Click the Delete Mesh/Elements icon , set the “Delete Mesh from” field to On Surfaces, enter 1, 2 in the Surface # table and click OK.
ADINA R & D, Inc.
2-9
Problem 2: Plate with a hole in tension
The graphics window should look something like this: Y
TIME 1.000 C C P2 C C C C C C C C C L9 C C C C C C C C P3
L8
Z
P1
X
PRESCRIBED PRESSURE TIME 1.000 L10
S3
L3 S1
C L4 P4 L1
25.00
P7 L5 L7 S2
P9 L2
P5 B L6
P8
P6
B C
U U 1 2 -
Now we decrease the point size of the points on the hole. Choose MeshingMesh Density Point Size, and, in the table, enter 1.0 for the Mesh Size for points 4, 5, 9 and click OK. The graphics window should look something like this: TIME 1.000
Y C C P2 C C C C C C C C C L9 C C C C C C C C P3
L10
S3
P7
L3 S1 L1
25.00
L5 L7 S2
P9 L2
P8
2-10
X
PRESCRIBED PRESSURE TIME 1.000
C L4 P4
Z
P1
L8
P5 B L6
P6
B C
U U 1 2 -
ADINA Primer
Problem 2: Plate with a hole in tension
Now we generate the elements onto surfaces 1 and 2. Click the Mesh Surfaces icon , enter 1, 2 in the first two rows of the Surface # table and click OK. The graphics window should look something like this: Y
TIME 1.000 C C C C C C C C C C C C C C C C C C C C C C C C C C C
P2
Z
P1
L8
X
PRESCRIBED PRESSURE TIME 1.000 L9
P3 S1
P8
L1
25.00
P7
L3
L4 P4
L10
S3
L5 L7
P9
S2
L2 BBBBB B B B B P5 B L6 P6
B C
U U 1 2 -
Generating the ADINA Structures data file, running ADINA Structures, loading the porthole file First click the Save icon
and save the database to file prob02. To generate the ADINA
Structures data file and run ADINA Structures, click the Data File/Solution icon , set the file name to prob02, make sure that the Run Solution button is checked and click Save. When ADINA Structures is finished, close all open dialog boxes. Set the Program Module , set drop-down list to Post-Processing and discard all changes. Then click the Open icon the “File type” field to “ADINA-IN Database Files (*.idb)”, choose file prob02 and click Open. Then click the Open icon
and open porthole file prob02.
Please notice that we first opened the ADINA-IN database, then loaded the porthole file. We did this so that we can create a graph of the stresses along a geometry line later on. The graphics window should look something like the figure on the next page. Notice that the geometry and the deformed mesh are displayed.
ADINA R & D, Inc.
2-11
Problem 2: Plate with a hole in tension Y
TIME 1.000 C C C C C C C C C C C C C C C C C C C C C C C C C C C C
L8
P2
Z
P1
X
PRESCRIBED PRESSURE L9
P4 L1
P8
S1
P9
TIME 1.000 25.00
L3
P3 L4
L10
S3
P7 L5 S2
L7
L2 BBBBBBB B B P5B L6 P6
B C
U U 1 2 -
Examining the solution Original and deformed meshes: Click the Show Original Mesh icon Displacements icon
and the Scale
.
We will plot this mesh along with other mesh plots showing the solution. To make room for the other mesh plots, we need to shrink this mesh using the mouse and move it to the left, so that we obtain the picture shown at the top of the next page. Here are detailed instructions for resizing and moving the mesh plot. To shift the mesh plot, click the Pick icon and the Dynamic Pan icon, then click on one of the lines of the mesh plot. A bounding box appears around the mesh plot; this bounding box indicates the mesh plot is highlighted. Now hold down the left mouse button and move the cursor. The mesh plot moves along with the mouse cursor. When the mesh plot is in the proper position, , release the left mouse button. To resize the mesh plot, click the Dynamic Resize icon hold down the left mouse button and move the mouse diagonally up and to the right to enlarge the mesh plot and move the mouse diagonally down and to the left to shrink the mesh plot. The mesh plot dynamically resizes as you move the mouse. When the mesh plot is the proper size, release the left mouse button. To unhighlight the mesh plot, move the cursor onto empty space within the graphics window and click the left mouse button. Move and resize the boundary condition table and the load legend in the same way.
2-12
ADINA Primer
Problem 2: Plate with a hole in tension DISP MAG 243.1
TIME 1.000
Y Z
C C C C C C C C C C C C C C C C C C C C C C C C C C C C
P2
L8
P1
X
PRESCRIBED PRESSURE TIME 1.000 25.00
L9
S3
L10
P3 P7 L3 L4 S1 L5 P4L1 L7 P9 S2 BBBB BBB BB L2 P8 B P5 L6 P6 B C
U U 1 2 -
Stress band plot: To display another mesh plot, click the Mesh Plot icon . Use the mouse to move and resize the new mesh plot to the right of the first mesh plot. This time, to resize the mesh, make sure that the Dynamic Pan icon the mouse while holding down the Ctrl key.
is pressed, pick the mesh plot, then drag
At this point, there are two sets of axes and two sets of “TIME 1.000” texts displayed. To is pressed, then move the cursor onto remove unwanted text, make sure that the Pick icon the text and click the left mouse button. The text becomes highlighted. Then press the Del or Delete button on the keyboard to erase the text. Remove both sets of axes, both sets of “TIME 1.000” texts and the “DISP MAG” text in the same way. , set the Band Plot Variable to (Stress: STRESS-YY) Now click the Create Band Plot icon and click OK. Move the band plot legends until the graphics window looks something like the top figure on the next page. . Use the Stress vector plot: To display another mesh plot, click the Mesh Plot icon mouse to resize and move the new mesh plot to the right of the previous mesh plot. Remove the new axes and the new TIME 1.000 text. . Move the vector plot legend until the graphics Now click the Quick Vector Plot icon window looks something like the bottom figure on the next page.
ADINA R & D, Inc.
2-13
Problem 2: Plate with a hole in tension Y
TIME 1.000 DISP MAG 243.1 PRESCRIBED PRESSURE
25.00
P2
L8
L9
S3 L10
P1
P3 L3 P7 L4 S1 L5 L7 P4L1 P9 S2 BBBBB BBB B L2 P8 BP5L6 P6 B C
STRESS-YY RST CALC TIME 1.000 104.0 88.0 72.0 56.0 40.0 24.0 8.0
U U 1 2 -
Y
TIME 1.000 DISP MAG 243.1 PRESCRIBED PRESSURE
25.00
B C
2-14
P2
L8
Z
P1
STRESS-YY RST CALC TIME 1.000
L9
X
MAXIMUM 108.8 EG 1, EL 122, IPT 11 (103.2) MINIMUM -4.358 EG 1, EL 102, IPT 11 (-2.610)
TIME 1.000
C C C C C C C C C C C C C C C C C C C C C C C C C C C C C
X
MAXIMUM 108.8 EG 1, EL 122, IPT 11 (103.2) MINIMUM -4.358 EG 1, EL 102, IPT 11 (-2.610)
TIME 1.000
C C C C C C C C C C C C C C C C C C C C C C C C C C C C C
Z
S3 L10
P3 L3 P7 L4 S1 L5 P4L1 L7 P9 S2 BBBBB BBB B L2 P8 BP5L6 P6
104.0 88.0 72.0 56.0 40.0 24.0 8.0
STRESS RST CALC TIME 1.000 + -
96.54
81.00 63.00 45.00 27.00 9.00 -9.00 -27.00
U U 1 2 -
ADINA Primer
Problem 2: Plate with a hole in tension
Nodes and elements near the hole: We will view the node numbers in the mesh near the hole. Click the Clear icon click the Node Labels icon
, then
.
, Since there are so many nodes, we have to zoom in to see them. Click the Zoom icon move the cursor to a point near the top of the hole, press and hold the left mouse button, drag the cursor down and to the right so that the rubber-band box encloses the mesh region near the hole and release the left mouse button. The graphics window should look something like this: 370
429
396 371 397
393
428
392
461
463 440 441
462
412
385
454
434
411
384
455 420
427
386
414 410
433
432 453 416 387
452
415
383
409
444
388
418
443
419 406
381 511
407 535
382 510
534
499
481
543 508 380 459 422 536 372 436 394 447 437 405 480 545 389 439 390 524 398 456 435 501 426 457 438460423 379 505 507 421 373 399 374 525 446 539 458 391 400 404 476 375 425 518 544 401 424 479 514 542 376 445 378 538 483 502 402 403 517 506 519 515 377 537 551 523 484 552 531 488 516 477 554 485 530 512 464 550 541 482 489 503 513 533 520 547 555 465 529 522 549 478 532 490 486 526 487 527 466 540 504 553 521 528 546 491548 467492468 493 469 494 470
475
509
495
474
498
473
497
472
496
471
To learn the current coordinates of node 467, click the Query icon , move the cursor onto the label of node 467 and click the left mouse button. The AUI writes a message such as "Node 467, curr=( 4.99614E+00, 0.00000E+00, 0.00000E+00)" into the message window and into the status bar at the bottom of the control window. For more information about node 467, right-click and choose More. The AUI writes more information into the message window, including the element that is attached to node 467. (To display the message window, choose ViewMessage Window.) To learn the numbers of the elements near the hole, move the cursor onto one of the elements and click the left mouse button. The AUI writes a message such as “Element group 1, element 122, side –1” into the message window and into the status bar at the bottom of the control window. Repeatedly click the left mouse button to cycle through all of the graphics
ADINA R & D, Inc.
2-15
Problem 2: Plate with a hole in tension
objects that can be queried at the cursor location. For more information about a graphics object, right-click and choose More. Now surround some of the graphics using a marquee box. The AUI highlights the selected graphics and writes messages for each graphics object (you may need to display the message window and use the vertical scrollbar in the message window to see all of the messages). Graph of stresses on the horizontal symmetry line: Now we will graph the stresses on the horizontal symmetry line. To do this, we create a “node line”, which lists the nodes on the horizontal symmetry line. Choose DefinitionsModel LineGeneral, add line SYMMETRY, enter the text “LINE 6” (you don't need to enter the quotes) into the first row and column of the table and click OK. The AUI writes the message “9 nodes in gnline” to the message window and to the bottom of the AUI control window. Please note, the above step is possible only if you open the ADINA-IN database before loading the porthole file. This is because the geometry information comes from the ADINA-IN database. Now click the Clear icon and choose GraphResponse Curve (Model Line). Verify that the Model Line Name is SYMMETRY, make sure that the X Variable is set to (Coordinate: DISTANCE), set the Y Variable to (Stress:STRESS-YY), set the Y Smoothing Technique to AVERAGED and click Apply. The graphics window should look something like this:
LINE GRAPH
110.
Line SYMMETRY 100. 90.
STRESS-YY
80. 70. 60. 50. 40. 30. 20. 10.
0.0
0.5
1.0
1.5
2.0
2.5
3.0
3.5
4.0
4.5
5.0
DISTANCE
2-16
ADINA Primer
Problem 2: Plate with a hole in tension
Let's add another stress component to the same graph. In the Display Response Curve (Model Line) dialog box, verify that the Line Name is SYMMETRY, make sure that the X Variable is set to (Coordinate:DISTANCE), set the Y Variable to (Stress:STRESS-XX) and make sure that the Y Smoothing Technique is set to AVERAGED. Also make sure that the Plot Name in the Graph Attributes box is set to PREVIOUS. Then click OK. The graphics window should look something like this: LINE GRAPH
120.
Line SYMMETRY Line SYMMETRY
100.
STRESS-YY
80.
60.
40.
20.
0.
-20.
0.
1.
2.
3.
4.
5.
DISTANCE
Now we will customize the graph title, axes and curves. Choose GraphModify. Title: Click the P button, move the cursor to the graph box and click to highlight it. Then click the ... button to the right of the Graph Depiction field. In the Title Attributes box, set the Type to Custom, enter “Stresses on horizontal symmetry line” in the Graph Title table (you don't need to enter the quotes) and click OK. Click Apply to see the updated title. Use the Pick icon
and the mouse to center the title.
Axes: Set the Action to “Modify the Axis Depiction”. Click the P button, move the cursor to one of the numbers on the Y axis and click to highlight the Y axis. Then click the … button to the right of the Axis Depiction field. In the Label Attributes box, set the Type to Custom, enter “Stress (N/mm**2)” in the Label table and click OK. Click Apply to see the updated axis. Curves: Set the Action to “Modify the Curve Depiction”. Click the P button, move the cursor to the upper curve and click to highlight it. Then click the ... button to the right of the Curve
ADINA R & D, Inc.
2-17
Problem 2: Plate with a hole in tension
Depiction field. Click the Legend tab, then, in the Legend Attributes box, set the Type to Custom, enter “Stress-yy” in the Legend table and click OK. Click Apply to see the updated curve and legend. In a similar way, change the legend for the lower curve to “Stress-xx”. The graphics window should look something like this: Stresses on horizontal symmetry line
120.
Stress-yy Stress-xx
100.
Stress (N/mm**2)
80.
60.
40.
20.
0.
-20.
0.
1.
2.
3.
4.
5.
DISTANCE
Numerical values: Choose GraphList. The value of STRESS-YY at distance 0.0 should be 1.08832E+02 (N/mm2). Click Close to close the dialog box. Exiting the AUI: Choose FileExit to exit the AUI. You can discard all changes.
2-18
ADINA Primer