Int. J. Engng Ed. Vol. 26, No. 4, pp. 820–830, 2010 Printed in Great Britain.
0949-149X/91 $3.00+0.00 # 2010 TEMPUS Publications.
Developing Measures of Roughness: Problem Solving as a Method to Document Student Thinking in Engineering* TAMARA J. MOORE1, MARGRET A. HJALMARSON2 1 Department of Curriculum and Instruction, University of Minnesota, 230A Peik Hall, 159 Pillsbury Drive SE, Minneapolis, MN 55455, USA. E-mail:
[email protected] 2 Graduate School of Education, George Mason University, 4400 University Drive, MSN 4C2, Fairfax, VA 22030, USA. E-mail:
[email protected] The purpose of this study was to analyze the quality and content of responses to a nanotechnology modeling task in a first-year engineering course. Student teams had to determine a method for measuring the roughness of the surface of gold using digital images generated by atomic force microscopy. This study illustrates how modeling tasks of this type document student thinking, the variety of measures and methods students used in response to the task, and the range of performance demonstrating the ability of first-year students to apply their current ways of thinking to solve complex engineering problems. Keywords: modeling; problem solving; nanotechnology; student thinking; authentic assessment
istics for NanoRoughness elicit and document students’ thinking in an engineering context? 2. How can documentation of students’ thinking be analyzed for research?
1. INTRODUCTION THE ABET [1] CRITERIA for engineering programs include that students should have ‘an ability to apply mathematics, science and engineering’, ‘an ability to design a system, component, or process to meet desired needs’, ‘an ability to identify, formulate and solve engineering problems’ and ‘an ability to communicate effectively’, and ‘a knowledge of contemporary issues.’ In addition, nanotechnology (designing and investigating structures at a molecular level) has been cited as an emerging field of interest for engineering research and engineering education [2]. Given these recommendations, the NanoRoughness modeling task was designed for a first-year course in engineering. The task was the fourth in a series of similarly structured tasks designed to elicit and develop students’ problem solving, model development, teamwork, and communication abilities as well as expose them to a range of engineering problems and contexts. In the NanoRoughness task, teams of students designed a procedure for quantifying the roughness of a material surface using digital images generated by atomic force microscopy. The focus of the research was on students’ understanding, interpretation, and application of measures of roughness by examining their final responses to the NanoRoughness task. This paper focuses on two questions:
2. PURPOSE OF MODELING ACTIVITES The theoretical framework of models and modeling encompasses a broad view of modeling. Since there are multiple meanings of modeling in engineering, for this research, a model is a system that explains, describes, or represents another system for a purpose. A model has elements, operations, and relations that allow for logical relationships to emerge. Many times, the model is insufficient to completely describe the system it represents, but if it is useful, it closely approximates the system without being unnecessarily complex. A Model-Eliciting Activity (MEA) is a complex problem solving task set in a realistic context with a client, characteristics that place MEAs in the authentic assessment category [3–4]. Solutions to MEAs are generalizable models, which reveal the thought processes of students. The models developed by students include procedures and, more importantly, metaphors for seeing or interpreting things. This is one of the unique characteristics of MEAs. Most problem solving problems in which students participate require an answer to a problem, which neglects the process that the students went through to arrive at the solution. MEAs require that the solution to the problem is a process for solving not only the problem at hand, but also a class of similar problems (i.e., a model
1. How did the modeling process to develop quantitative measures of qualitative character* Accepted 15 October 2009.
820
Developing Measures of Roughness for a system). This inherently requires that students provide their thoughts about how to deal with the problem without the instructor having to tell the students to ‘show their work’ or ‘explain their thinking.’ The ABET Engineering Criteria [1] has increased the need for readdressing the manner in which engineering is taught. In addition to eliciting models, MEAs require teamwork, design processes, and communication. Because MEAs address these criteria and are accessible to all levels of engineering students, implementing MEAs in courses where the instructor wishes to develop these professional skills and problem solving abilities makes sense. MEAs are created for teams of three to four students to express their model, test it using sample data, and revise their procedure to meet the needs of their client. This requires that students design a solution much in the same manner that engineers in industry address and solve problems. MEAs set in engineering contexts have been developed through the NSF-funded Small Group Mathematical Modeling for Gender Equity in Engineering (SGMM) project [5], the NSF Course, Curriculum, and Laboratory Improvement funded Modeling: Elicitation, Development, Integration, and Assessment (MEDIA) project, and are described at length by Lesh and colleagues [6–7]. The MEA framework provides a means to not only deliver more open-ended engineering content problems but also address multiple ABET criteria, especially those that are problematic to integrate in engineering courses [8]. Several studies on MEAs were the result of the SGMM project. Gender interactions were investigated in an online user interface [9]. Small group interactions were observed to investigate students’ complex mathematical thinking during MEAs [10]. The use of MEAs in a first-year required engineering course have been linked to persistence of women in engineering [5, 11], and team effectiveness and its role in solving MEAs have been researched [12]. MEAs have been the subject of many research projects with students and teachers in K-12 STEM fields. Studies of middle school mathematics students have included investigating proof structures [13], representations [14], and assessment of student work [15]. Sriraman [16] studied mathematics education graduate students by investigating their understandings of the notion of modeleliciting. Koleza and Iatridou [17] studied preservice teachers using experimentation to solve MEAs and the factors that prevent the crossing of boundaries between day-to-day mathematical functioning and school tasks. Hjalmarson [18] studied teachers’ strategies for implementation of MEAs in the middle school classroom, and Moore [19] studied in-service math and science teachers’ solutions to MEAs during master’s level coursework. MEAs were originally designed as a research instrument with three purposes: (1) to reveal student thinking about complex concepts, (2) to
821
simulate real-world applications of mathematics going beyond what is typically required in ‘word problems’, and (3) to characterize students’ knowledge and skills not easily assessed. In order to guarantee alignment with these purposes, there are six principles that guide the design of MEAs [6, 20– 21], which will be described in the next section. A well-constructed MEA ensures that students reveal their thinking as a natural part of the modeldevelopment process. The third purpose is achieved through identification of students that have abilities that were not being identified through other means. Thorough study of students during the problem solving process and solutions to MEAs allow researchers to identify people who can work in teams, complete complex multi-stage tasks, and adapt to continually changing tools (spreadsheets with graphs, calculators, etc.). These qualities emphasize richer mathematics and engineering than typical problem solving activities— focused on descriptions and explanations as much as computation and derivation. Although MEAs were not originally conceived as instructional tools, they have been used and investigated in classroom settings, including engineering [21–22], and are compatible with other instructional tools and assessments. Instructors can see student thinking both in the final products developed by the teams and by listening to teams as they work. In this sense, MEAs can be a type of formative assessment allowing an instructor to shape further instruction or discussion based on observations of what students already know. In addition, realistic contexts allow instructors to bring concrete applications of abstract content into the classroom. Students can learn how engineers use mathematics or other technical concepts answering the ongoing question, ‘When will I need to used this?’ 3. SIX PRINCIPLES OF MEA DEVELOPMENT Six principles of MEA Development (Table 1) guide the design of MEAs [6, 20–21]. The principles serve as criteria for evaluating whether an MEA will elicit and document students’ models in an authentic fashion. The Model Construction Principle requires that the activity elicit a model (i.e., a system to describe, explain, or predict to solve an authentic problem). Students write a procedure (the model) for a client. The requirement to design a procedure or model distinguishes MEAs from other types of problembased learning activities. The need for a procedure is tied to the Generalizability Principle which requires that students develop a procedure that can be applied to other similar sets of data (reusability) and document the procedure in detail so it can be interpreted and applied by someone else (share-ability). Connected to these is the Model Documentation Principle, which allows the instruc-
822
T. J. Moore and M. A. Hjalmarson Table 1. Principles for guiding MEA development
Principle
Description
Model Construction
Ensures the activity requires the construction of an explicit description, explanation, or procedure for a mathematically significant situation.
Generalizability
Also known as the Model Share-Ability and Re-Useability Principle. Requires students to produce solutions that are shareable with others and modifiable for other closely related engineering situations.
Model Documentation
Ensures that the students are required to create some form of documentation that will reveal explicitly how they are thinking about the problem situation.
Reality
Requires the activity to be posed in a realistic engineering context and to be designed so that the students can interpret the activity meaningfully from their different levels of mathematical ability and general knowledge. Ensures that the activity contains criteria the students can identify and use to test and revise their current ways of thinking Ensures that the model produced will be as simple as possible, yet still mathematically significant for engineering purposes (i.e., a learning prototype).
Self-Assessment Effective Prototype
tor to understand students’ thinking about the model generated to solve the client’s problem. Because students write their procedure in the form of a memo, the documentation of the procedure enables analysis and comparison of different classes of models. For the Reality Principle, the context for the problem is essential for motivating students’ engagement in realistic, authentic contexts where they are naturally drawn to reveal and develop their thinking about concepts. The students draw on their own knowledge and intuition about the context. This principle requires students to clarify these assumptions as part of their model. The students need to see the context as authentic, something engineers would actually be required to do, even if the information has been simplified or scaffolded to meet the constraints of the classroom. Introducing a client as the person to satisfy adds authenticity to the problem and motivates the documentation of the model. The Self-Assessment Principle requires teams to assess their progress by going back to the problem statement, the client’s needs, or their own knowledge in order to determine if their procedure is ‘right’. Self-assessment of the procedure encourages successive iterations of the solution to develop a more refined model. Within the team, students may ask each other questions about how they are thinking that push the model forward [10]. The activity should be designed such that the problem requires input from multiple perspectives and is complex enough to force students to move beyond their first interpretation. The Effective Prototype Principle connects all of the other principles. The model needs to provide a useful prototype or metaphor for interpreting other, similar situations. Evidence that this principle has been met comes when students can recreate the general outline of their procedure long after the task has been completed. Depending on the context, overly complex models are often not useful in real-world situations. The Effective Prototype also requires that MEAs are focused on big ideas or significant concepts in engineering that are useful in multiple situations.
MEAs need to be piloted whenever possible before implementation with students. This helps detect issues with adherence to the six principles of MEA development. The MEA in this study was piloted with groups of students and revised based on these pilot studies. Moore & Diefes-Dux [23] describe how the NanoRoughness MEA was designed to fit the six principles. 4. THE NANOROUGHNESS MEA The NanoRoughness MEA is separated into 2 parts. First, students work individually to orient themselves to the context and the problem, then they work in their teams to develop a solution. In the individual work, the students orient themselves to the concept of roughness by answering the following: 1. How do you define roughness? 2. What procedure might you use to measure the roughness of the pavement on a road? 3. Give an example of something for which degree of roughness matters. For your example, why does the degree of roughness matter? How might you measure the roughness (or lack of roughness) of this object? The students read a profile about a company for whom they will work. Then, they individually read a memo from the teams’ ‘boss’, which outlines the team task. It has been found that if students work in teams without processing individually, faster processing members may start working on the problem before all have engaged. The team part of the MEA requires students to develop a procedure to measure roughness given Atomic Force Microscope (AFM) images of three different samples of gold. The students have previously been given background reading on the function of the AFM. The motivation for developing the procedure is established by using a realistic context in which a company specializing in biomedical applications of nanotechnology wishes to start producing synthetic diamond coatings for joint replacements. The company intends to
Developing Measures of Roughness
823
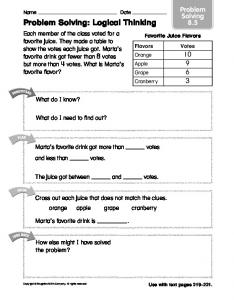
Fig. 1. AFM gold sample given to students as data to develop the procedure for roughness.
extend its experience with gold coatings for artery stents to this new application. The teams must create a procedure to measure roughness using images of gold because the company currently only has one image of diamond since diamond coatings are still in development. Student teams of three or four are required to establish a procedure for measuring the roughness of gold samples that could be applied to diamond samples as they are created. The students then apply the procedure to three different samples of gold (one sample is shown in Fig. 1). The team must write a memo to the company describing their procedure and its application to the sample AFM images and listing the additional information needed to improve their procedure. The entire NanoRoughness MEA can be found at http://modelsandmodeling.net.
5. STUDY DESIGN The participants in the study were students enrolled in a first-year engineering problem solving and computer tools course at a large, public Midwestern university. This course focuses on computer tools such as MATLAB and Excel, basic engineering economics, engineering fundamental statistics, and complex problem solving. The students (N ~ 1400) were divided into laboratory sections of approximately 25 students each in order to complete the NanoRoughness MEA in class. Within the laboratory sections, the students were divided by the graduate teaching assistant into long-term teams of three to four. The students were in two different teams for the course, one in the first half of the semester and one in the second. Since they were working with their second team for the semester, the teaching assistants could use information gathered about students’ prior experiences to generate teams. The only fixed rules (set
by the department) were that a team should have 3 or 4 students total; and, if a team’s membership consists of female or international students, there should be no fewer than two females or no fewer than two international students on that team. 35 responses from teams in different sections of the course were selected for this analysis. Note that the unit of analysis in this study was the team, not the individual. In terms of implementation, this can lead to issues of individual accountability. In the classroom, these issues were addressed by having an individual follow up homework that had students compare and contrast their team model to a traditional model and a team MATLAB1 project that had very specific documentation requirements for individual work. Coding of student responses happened in two stages: quality and model type. Different types of models may be equally ‘good’, and instructors/ researchers may want to describe both the quality and nature of students’ final products. The Quality Assurance Guide (QAG), described in the next section, was used to assign numeric scores from 1 to 5 [15]. Versions of the QAG have been used to analyze student work [12, 24-26]. To carry out both the qualitative and quantitative coding, a team of three researchers with diverse experiences was assembled to provide validity and reliability in the coding process. This team included two mathematics/engineering education researchers and one graduate student in engineering to provide expertise on the technical content. All members of the team had experience designing MEAs, and two members had previously used the QAG to score student work. 5.1 Quantitative analysis with QAG The QAG has five levels with level five representing the highest quality responses. Table 2 provides a description and number of responses in our sample at each level. The primary criteria
824
T. J. Moore and M. A. Hjalmarson Table 2. The Quality Assurance Guide and Total Number of Responses for each category. Total Number of Responses (N=35)
Score
Performance Level
How useful is the product?
1
Requires redirection
The product is on the wrong track. Working longer or harder won’t work. The students may require some additional feedback from the teacher.
2
Requires major extensions or revisions The product is a good start toward meeting the client’s needs, but a lot more work is needed to respond to all of the issues.
16
3
Requires editing and revisions
The product is on a good track to be used. It still needs modifications, additions or refinements.
9
4
Useful for this specific data given, but not shareable and reusable OR Almost shareable and reusable but requires minor revisions
No changes will be needed to meet the immediate needs of the client for this set of data, but not generalized OR Small changes needed to meet the generalized needs of the client.
2
5
Sharable and reusable
The tool not only works for the immediate situation, but it also would be easy for others to modify and use it in similar situations
2
for evaluating student work is how well the procedure could be generalized or used in other situations. The research team focused on the question: ‘Is there enough information provided about the procedure that a third party could use it easily?’ A level 5 response is usable both for the current situation and other situations without revision. At level 1, the team needs to either start over or be redirected. Levels 2, 3 and 4 need varying degrees of revision or modification. The research team first coded responses individually. Then, discussed the coding of responses until a consensus was reached on a score. Student team samples are provided to illustrate the use of the QAG.
6. RESULTS AND SAMPLE RESPONSES To successfully complete the task, a team’s response needs typically to address two major questions in a memo to the client. First, how was a data set going to be generated from the images? Second, how was that data set going to be analyzed
6
in order to rank the images by their degree of roughness? The coding team was looking for clear answers to these questions within the student responses. Answers to both questions are necessary for the client to effectively calculate a measure of roughness and result in different operational definitions of roughness. For example, for data sampling, do peaks and valleys matter or just the peaks? For the calculations, is roughness measured only by the average height of the surface or must deviation from the mean be considered? Is the area of the peaks important? Engineers have differing answers to these questions. In order to clarify how the teams’ responses were scored on the QAG, a set of responses representing the top three levels of the guide are included and described in further detail. 6.1 Samples of student work: Three teams (Figs 2, 3 and 4) will be referred to as the codes are discussed. These teams were chosen to illustrate a variety of solution paths and, for demonstration, solutions that were on the right track (QAG Score > 2). Following each
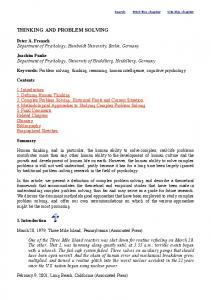
To determine the roughness of each sample, we would first draw a number of lines across the sample. Obviously, the more lines drawn would result in a more accurate approximation, but also take more time. The lines should be in a ratio to the scale of each sample. For example, if we draw a 1 micrometer line on a 2 micrometer by 2 micrometer sample, we would then draw lines of 3 micrometers on a 6 micrometer by 6 micrometer sample. After we had drawn a number of random lines, we would take 10 evenly spaced readings of the height from each. From this recorded data, we could then calculate the mean height across the line. Having taken the measurements for several different lines, we could assume that to be the mean height of the entire sample. Once we calculated the mean, we could then figure the standard deviation using the data points we had recorded. The smoother substance would have a lower standard deviation. Furthermore, if the peaks and valleys that the lines intercept are graphed using straight lines to connect the peaks and valleys, we could then calculate the area. This allows for correction of samples that have fewer peaks but the peaks cover a larger area thereby making the sample rougher. To apply this to the samples we are given, we suggest that five lines be drawn across each sample. In sample A, we would draw lines of 3 micrometers. In sample B, we would draw lines of .5 micrometers, and finally in sample C, we would draw lines of 1 micrometer. We would then take approximate height measurements at 10 evenly spaced points on each line, and record the data. We would then calculate the mean height of each sample, and then the standard deviation using the data we recorded. The data could then be plotted using the distance along the line as the x-axis and the height as the y-axis. If the points are connected, we could then calculate the area under the graph. By comparing these two values we could come up with the smoother substance. To better obtain the values, samples with the same scale would have been more useful, along with a more scientific way to determine the height than judging against a color scale. Fig. 2. Team Alpha’s response to the NanoRoughness MEA.
Developing Measures of Roughness
825
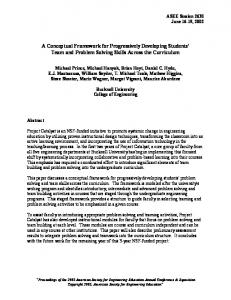
To measure the roughness of a surface using AFM images, we first need to put all the images on the same scale, so that all directions are measured in nanometers. This means height, length and width. Then collect all the heights from the AFM image for that area. Once we have all our data points, we would take the standard deviation of the heights. So that gives us how far the data points are away from the mean; therefore, if a surface has a high standard deviation, then it has a high roughness, because there is a greater change in the surface height. Once we have the standard deviation, we divide by the area of the sample, which gives us the standard deviation per nanometer. We do this because all the samples are different sizes, and if we shrink them down, the resolution doesn’t change, we just lose data points. Another way to determine the roughness is to plot the data points and find a curve between them and take the derivative of this curve. That gives us the rate of change in the heights a low derivative gives us low roughness. To get the data points, we have to use the shading to determine a sample of heights, using the scale given to us. Then we take the standard deviation of all these heights, and then divide by the square area of the sample to get the standard deviation per nanometer. If a sample has a low number per nanometer, then it has a low roughness. Some information that would be useful to better our results is the actual data points used to create the images, so we have exact data points instead of determining the height from the shaded regions. Also the more data points, the more accurate our calculations can be. So we would want a lot of samples and a lot of data points for each of those samples. Also images at the highest resolution possible would make our determination more accurate. Fig. 3. Team Beta’s response to the NanoRoughness MEA.
To begin, it is essential to determine a data set of surface heights so that the roughness of each given surface can be quantified. In order to do this, our team feels that it would be best to divide each of the images into a grid. At this point, it is important to adjust the scales of each image so that they can be easily compared. Measuring the height of the coordinate points would give us a data set of surface heights, which could be used to quantify the roughness of a surface. Once this data set of surface heights was found, we could find the standard deviation, in order to show how much every portion of the image differs from the mean height. This would show us the varying degrees of height. The lower the standard deviation, the less inconsistency of the surface there is, and therefore a smoother surface. It would also be helpful to create a histogram using the data sets we have collected. If it is a normal distribution, a bell graph could be created to determine the probability of the surface height at a given random point. The higher the probability, the smoother the surface is, because it is more likely that points are roughly at the same height. Another important factor to consider are large changes in surface height. To factor this in, it is necessary to look at the minimum and maximum of each image. Using these, we could find the range of the surface heights. While this is not as important as the standard deviation, it should definitely be considered to account for large changes in surface heights. Once these three factors have been determined, it will be necessary to quantify them based on their importance. We felt that the standard deviation was the most important part of our calculations. The probability of occurrence of a chosen height would be secondly important, and the range of the data set would be a minor factor. These factors of importance could be used to quantify the images so that the roughness of the surface can be determined. Our conclusion will give us a number representing the roughness of a surface, which is simply based on our ranking system. This quantity can be compared to the other two quantities to determine the smoothest surface. It would be helpful to have clearer pictures, where the heights can be clearly determined at a given point. Larger pictures on the same scale would greatly improve the quality of our ranking system. Fig. 4. Team Gamma’s response to the NanoRoughness MEA.
team is a list of the codes given to each of the responses. All identifiable data have been replaced by pseudonyms, and grammatical errors have been corrected for ease of reading. On the QAG, Team Alpha received a score of four indicating that the solution was almost shareable and reusable but required minor revisions. The team’s description of graphing the peaks and valleys was not clear to the readers. For instance, is each line plotted on a different graph or are all the data plotted on one graph? If each line was plotted on a graph, they didn’t explain how to aggregate the information from the graphs. Depending on the values, the area under the curve for a plot with more difference between peaks and valleys could have the same area as a curve with fewer, more uniform peaks. It is not clear how the standard deviation would be used to differentiate these two scenarios. Team Beta received a score of 3 on the QAG indicating that the solution required editing and revisions to be usable for the client. The team indicated the need to ‘put all the images on the same scale’ but did not describe a procedure to do
this. They also described using the ‘all the heights from the AFM image for that area’, however, did not specify which heights. In the second paragraph, they implied there is some sample of heights they plan to use based on the shading. So, it becomes unclear whether they intended to include just the heights of peaks in the sample or the height of the surface at any point. For their derivative method, it is not clear how the points from a threedimensional surface would be plotted and then converted into a differentiable function. They mentioned a curve (possibly implying two-variables) but not how such a curve would be generated. They presented two methods (finding the standard deviation and computing the derivative of the curve created by plotting the heights) but did not explain when one procedure should be selected over the other or how they could be aggregated. What is clear from their solution is that they have recognized the need to quantify variation or rate of change in the surface. They have proposed two reasonable measures (standard deviation and the derivative), but they need to clarify how they will generate the data for the procedure.
826
T. J. Moore and M. A. Hjalmarson
Team Gamma used more statistical measures than Alpha and Beta, but their procedure still lacked clarity. The Quality Assurance Guide score of 3 was given to this response indicating that the procedure needed editing and revisions to meet the needs of the client. While the solution had many interesting mathematical and statistical ideas, it lacked details that would enable a third party to implement them. In each of the factors that the team deemed important, they left out details about how to calculate the measures, lay the grid, adjust the scale, etc. The most significant problem with the procedure involved the combining of factors in a ranking method to quantify roughness. While they did provide information about the order of importance of the factors, they left out how to mathematically combine them. They also failed to indicate whether the high or low number represented the roughest sample. For level 1 and 2 responses, the students typically wrote very short responses (only a few sentences) including statements such as ‘find the mean of the heights’ without saying anything about the data sampling process or the subsequent analysis that would be required.
7. QUALITATIVE ANALYSIS As a response to the two major aspects of the model (the sampling process and the data analysis process), three groups of codes have emerged at this point for classifying responses to the NanoRoughness MEA: sampling, procedural, and statistical measures. Descriptors characterizing teams’ responses were generated after the responses had been assigned scores. Then, those descriptors were categorized by type. Sampling codes describe the teams’ methods for sampling data from the images (i.e., selecting points to include in their data set). The teams’ were given just the images without numerical information about individual pixels.
First, differences in sampling methods are relevant because they give insight into their use of the scale of the image. The images were of different scale with the intention that the teams would have to quantify the information in order to determine a ranking of the images by roughness. Not all of the teams noted the difference in scale of the images in their method. Some teams did describe how they built procedures into their method to account for the scale. Second, differences in sampling method are important because they reflect differences in how the teams defined the sample set (e.g., the whole image? the peaks in the image?) to be measured. The following sections will discuss each of the groups of codes: sampling, procedures, and statistical measures. 7.1 Sampling The first stage of model development for each team was designing a method for generating a data sample from the images provided with the task. The sampling context used in this task is unique in the sense that students are not usually asked to generate a sampling method. Additionally, the data points are often obviously discrete objects (e.g., people, trials, measurements). For this task, students did not have specific quantitative data about the images, only a scale showing the correspondence between the gray scale shade of the point and the height at that point. As shown in Table 3, most teams recognized the need for randomness in the sample in order to avoid bias. Many teams used randomly selected points or lines on the image which could be used to select a sample data set. Teams also recognized the need to find a representative sample and included methods that would take height values from either points on a grid drawn on the surface or by finding a crosssection. Table 3 provides an overview and description of the codes used to describe the teams’ sampling methods, as well as the number of teams whose response to the task received each code. Team Alpha (Fig. 2) received the following
Table 3. Sampling codes describing students’ method for sampling data from images
Code
Description
Number of Responses (N=35)
Random points
Selecting some number of points on the image randomly as data points.
Random lines
Drawing random line(s) on the image to create a data set.
10 7
Random area
Drawing a random area to create a data set.
1
Drawing a grid over the image
Draw a grid on the image either to create subsets of data within the cells or along the gridlines.
8
Cross-section
Taking a slice of the image and using height data only from the particular slice and looked at a cross-section.
2
Whole picture
Using every point of data on the image.
4
Eyeball method
Just ‘looking’ at the picture (e.g., finding the peaks that look the biggest) to pick data points.
7
Adjust the scale
Making an adjustment in the data set (e.g., by only using a portion of the image) for the difference in scale between images or convert the scale.
11
Note the scale
Noting that the scale is different, but no adjustments within the procedure to account for the difference.
4
Developing Measures of Roughness codes for sampling: random points, random lines, cross-section, adjust scale. Team Beta (Fig. 3) received whole picture, adjust scale, and Team Gamma (Fig. 4) received grid, adjust scale. Even without knowledge of the models used by engineers, the student-generated models contain some methods used by engineers to generate sample sets of data. For example, drawing random lines can be used to find the height of the surface along a cross-section and preserves the relationship of the points along a ‘horizon’. Finding the mean of all the points on the surface can mask the relationships between adjacent points on a surface. When measuring roughness, it may be important to know the difference in heights between points and their neighbors. In any case, the students’ models were related to the actual models used by engineers for generating samples from a surface. How that sample is generated has implications for the subsequent data analysis. The next two sets of codes describe what the teams did with the data once they had found a sample. In engineering, designing a procedure for analyzing quantitative data is as much a design process as building tangible objects. The engineer must consider the nature of the context, the needs of a client (or other audience), and the available resources for carrying out the task. The engineer must also integrate scientific, mathematical, and technical knowledge in order to design and apply procedures. In the case of the NanoRoughness MEA, the students needed to integrate their knowledge of how the images were generated with their mathematical and statistical knowledge in order to generate a procedure for analyzing the available data. 7.2 Statistical measures Codes for the statistical measures each team computed were assigned. As shown in Table 4, a large majority computed mean or standard deviation. Eighteen of the teams computed both standard deviation and mean. Their use of the statistics varied. It was not necessarily the case that teams determined a sample, computed the mean for the values in the sample and then computed the standard deviation. However, teams typically related greater standard deviation in height values with greater roughness of the surface of the material. This finding is consistent with the literature indicating students know how to compute the mean, and it is a statistic with which they are very familiar and comfortable computing [27–28] even if they do not have a conceptual understanding. For undergraduate students, the standard deviation is a natural next step in a task where the quality to be measured could be described as the variability in the surface, and in particular, the students in this course had revisited the concept of standard deviation and variance earlier in the semester. Computing the mean for this task is a complex endeavor, which must first start with students’ asking: the mean of what? And, then, is having a
827
Table 4. Statistical measures computed as part of the procedure for data analysis
Code Mean Standard Deviation Mode Median Histograms Maximum/minimum Informal measures of spread (e.g., modified standard deviation)
Number of Responses (N=35) 22 23 2 3 6 2 3
high or low mean a greater indicator of roughness? The complexity is not in the computation but in determining what to compute and how to interpret the results. For instance, what information obscured by the mean is highlighted by the standard deviation? As shown in the first coding schema, the students used various sampling schemes to develop a data set. Interpreting the results usually meant they looked for low values of the mean of the heights in their sample. The example teams [Team Alpha (Fig. 2), Team Beta (Fig. 3) and Team Gamma (Fig. 4)] received mean, standard deviation codes for statistical measures. Team Gamma also received the codes max, min, range, histogram. 7.3 Procedures In addition to understanding what statistics students computed, the researchers wanted to understand how the statistics were used and interpreted. The students needed to consider the statistics within a context and in relationship to other values that may be computed. The codes in this category describe both the types of procedures (e.g., local and global) and characteristics of unclear or under-developed procedures (e.g., unnecessary steps). Not all the responses received a code in this category. However, of the teams that did generate and explain procedures, there were a variety of methods for applying and integrating the statistical measures. In addition, developing procedures that are used to describe qualitative characteristics with quantitative information is an important part of engineering. Table 5 describes each of the codes in this category and provides the number of team responses that received each code. Teams could receive more than one code. Curve-fitting was used by four teams even though it probably is not a sensible method for generating a method of roughness. One plausible explanation is that curve-fitting procedures had been covered in the lecture just prior to this laboratory. So, students may have assumed that topics covered in lecture would be the ones to use in the next laboratory. Team Beta (Fig. 3) is an example of a team that tried to use curve-fitting, and so was given this code along with the unnecessary steps code. Team Alpha (Fig. 2) was not
828
T. J. Moore and M. A. Hjalmarson Table 5. Procedural codes indicating aspects of the procedure related to the use or application of statistical measures
Code
Description
Local and global
Carrying out data analysis on subsets of the data and then using that local analysis to make decisions about the whole data set (e.g., find mean height in a cell, then find mean of those mean heights).
5
Distance between the peaks Curve fitting
Using the distance between peaks as a measure of roughness. Fitting a data set to a curve (often a linear approximation).
1 4
Heights at grid intersections points
Finding the heights at the intersection points of a grid drawn on the image and using as a data set.
2
Area fraction
Finding the portion of the area in the image that is lighter than the rest.
1
Area
Finding the area of the peaks.
1
Restate the problem information
Providing no procedure beyond what was given in the problem statement or background information (e.g., ‘use the heights of the peaks to measure the roughness’). Including steps in the procedure that were not used later to make a decision about roughness (often includes statistical computations).
1
Unnecessary steps
given a procedural code, while Team Gamma (Fig. 4) received the codes: height at grid intersections, unnecessary steps. Four teams, including teams Beta and Gamma, received the unnecessary steps code. Both sample teams computed several measures but failed to explain how these would result in quantifying roughness. Hence, it was not clear whether steps were necessary. For example, Beta described a procedure for computing area under the curve generated by the heights but did not describe how that area would be used in conjunction with the standard deviation (or other measures the team could have calculated). Gamma computed a wide variety of measures. If they had begun to work on aggregating the measures with a ranking system, they may have identified some of them as extraneous, but their memo is not clear. Part of the model design process should include analyzing different types of statistical measures.
8. DISCUSSION ABOUT THE DOCUMENTATION OF STUDENT WORK 8.1 Finding a purpose for developing descriptor categories When analyzing student work related to complex problem solving activities, there are a number of aspects that could be assessed. This research focused primarily on what mathematical and statistical constructs students were using in their responses. However, other types of analyses are possible for different types of descriptors. For instance, the students typically complete a warmup, introductory activity where they define roughness. The relationship between their initial definitions of roughness and their final product or how three individual definitions came together into one definition were not examined here. Students’ procedures could also be analyzed in terms of
Number of Responses (N=35)
4
their relationship to ‘real’ engineering methods for measuring roughness. The researchers also could have qualitatively coded the responses by overall definitions of roughness (e.g., roughness as variation in peak height, roughness as difference from the mean, roughness as highest mean). This study also did not focus on students’ individual contributions to the team’s final product. Students could have been explicitly asked what they felt was their contribution to the final product, and other researchers have investigated team interactions and peer review. In this case, the focus was on the knowledge developed and methodologies of analyzing student work that could be extrapolated both to research and instructional settings interested in categorizing the content of student work. 8.2 Developing a quality assurance guide and descriptors in contrast to developing a rubric The purposes in analyzing student work were both evaluative (needing to characterize relative quality) and descriptive (categorizing student work based on its own merit and analyzing the content of students’ models). The challenge in analyzing students’ work for MEAs and other similar activities where multiple solutions may be equally good is assessing students’ work for quality while still allowing room for multiple solution paths. A predetermined rubric is often not robust enough to fairly assess all solution paths. This research not only assesses the quality of students’ work, but also describes the nature of their models, which is much richer than just scoring the solutions. In some sense, MEAs are not open-ended [6] in that there are criteria that make models good. Not every model is equally ‘good’, but there are multiple models and variations on model types. This is why in this study and in other studies of MEAs, researchers focus on types or categories of models rather than selecting particular procedures that are ‘correct’. While instructors and researchers can make some predictions about what students’
Developing Measures of Roughness responses will be, often students will develop models that are unanticipated yet still useful for the situation.
829
follow instructional sessions on the standard deviation, providing a natural extension of the concept and measure to a natural setting. It could also precede these sessions and be used as scaffolding to teach concepts of variability.
9. IMPLICATIONS FOR TEACHING ABETs Criterion 3 a–k [1] provide guidelines for educating engineering students. These guidelines include ‘an ability to apply mathematics, science and engineering’, ‘an ability to design a system, component, or process to meet desired needs’, ‘an ability to identify, formulate and solve engineering problems’ and ‘an ability to communicate effectively’, and ‘a knowledge of contemporary issues.’ The NanoRoughness MEA provides engineering instructors with an activity that meets many of these guidelines. In this task, students are immersed in a meaningful, real-world problem based on actual images of gold surfaces. Students are engaged in a task that is similar to problems confronted by professional engineers. The task requires students to use or construct appropriate measures of center and variability, and to build a model from these measures to address a problem. Sampling schemes need to be devised in order to deal with the large amount of information in each image. The task assesses students’ understanding of statistical concepts such as center and variability in that correct conceptions are needed to produce viable models. And the task, itself, provides a window into students’ understanding of these statistical concepts, as well as information that can be used to remedy misunderstandings and misconceptions. The NanoRoughness MEA naturally elicits the use of statistical measures and the need for taking a sample. It also creates the need to integrate many of these concepts into a single model. The samples of gold do not differ with respect to the average height of the pixels. Yet, the three samples can be distinguished visually. This requires students to come up with a measure to estimate roughness and a measure of variability appears to be a natural choice. The Nanoroughness task could
10. CONCLUDING REMARKS MEAs are impacting engineering education at the undergraduate level [29]. They are providing engineering educators with authentic assessments that can bring upper-level content and problem solving to students at lower levels in ways that allow the instructors to see student thinking. It is important to help our students develop the skills necessary to be effective and forward thinking engineers, and we should start this process as early as possible. The NanoRoughness MEA is a good example of an MEA that is appropriate for lower-levels of undergraduate engineering, while at the same time bringing upper-level material science content to these students. This study’s results reveal a variety of measures and methods the students used in response to the task as well as a range of performance demonstrating the ability of first-year students to apply their current ways of thinking to solve complex engineering problems. While the solutions are not perfect, they demonstrate that students have abilities to work on complex problems even in their first semester of engineering. MEAs can provide engineering students with opportunities to see vast engineering disciplines in motivating ways, which holds the promise to influence their final career choices. Currently, research is being conducted through the MEDIA project aimed at extending the MEA framework to upper levels of engineering content disciplines and creating MEAs that elicit misconceptions and help students make ethical decisions as professional engineers. Acknowledgements—This material is based upon work supported by the National Science Foundation under Grant No. 0120794 and Grant No. 0717529.
REFERENCES 1. ABET, Criteria for accrediting programs in engineering, ABET, 2004. 2. National Academy of Engineering, The Engineer of 2020: Visions of Engineering in the New Century, National Academies Press, Washington, DC, 2004. 3. R. Lesh and S. J. Lamon (eds), Assessment of Authentic School Mathematics, AAAS Press, Washington, DC, 1992. 4. G. Wiggins, Educative Assessment: Designing Assessment to Inform and Improve Student Performance, Jossey-Bass, San Francisco, 1998. 5. J. Zawojewski, H. A. Diefes-Dux and K. Bowman (eds.), Models and Modeling in Engineering Education: Designing Experiences for All Students, Sense Publishers, Roterdam, 2008. 6. R. Lesh, M. Hoover, B. Hole, A. Kelly and T. Post, Principles for developing thought-revealing activities for students and teachers. In: Handbook of Research Design in Mathematics and Science Education, Lawrence Erlbaum, Mahwah, NJ, 2000. 7. R. Lesh and H. Doerr (eds), Beyond Constructivism: Models and Modeling Perspectives on Mathematics Problem Solving, Learning, and Teaching, Lawrence Erlbaum, Mahwah, NJ, 2003. 8. H. A. Diefes-Dux, T. J. Moore, J. Zawojewski, P. K. Imbrie and D. Follman, A framework for posing open-ended engineering problems: Model-Eliciting Activities. Frontiers in Education Conference, Savannah, GA, 2004.
830
T. J. Moore and M. A. Hjalmarson 9. D. K. Follman, C.V. Liguore and C.T. Watkins, Work in progress—Male and female engineering student roles and interaction styles on online collaborative learning teams. ASEE/IEEE FIE, Savannah, GA, 2004. 10. T. Wood, E. Moss and C. Zapato, Learning from observations to establish researchable questions, In: J. Zawojewski, H. A. Diefes-Dux and K. Bowman (eds.), Models and Modeling in Engineering Education: Designing Experiences for All Students, Sense Publishers, Roterdam, 2008. 11. H. A. Diefes-Dux, D. Follman, P. K. Imbrie, J. Zawojewski, B. Capobianco and M. A. Hjalmarson, MEAs: An in-class approach to improving interest and persistence of women in engineering, ASEE, Salt Lake, 2004. 12. T. J. Moore, H. A. Diefes-Dux and P. K. Imbrie, How team effectiveness impacts the quality of solutions to open-ended problems. ICREE, published in the October J. of Engr. Ed., 2007. 13. R. Lesh and G. Harel, Problem solving, modeling, and local conceptual development. Math. Think. & Learn., 5, 2003, pp. 157–189. 14. R. Lesh, The Development of Representational Abilities in Middle School Mathematics. In: I. E. Sigel, (ed.), Development of Mental Representation—Theories and Applications Erlbaum, Mahwah, NJ, 1999. 15. R. Lesh, and D. Clarke, Formulating operational definitions of desired outcomes of instruction in mathematics and science education. In: R. Lesh and E. A. Kelley (eds.), Handbook of Research Design in Mathematics and Science Education Lawrence Erlbaum, Mahawah, NJ, 2000. 16. B. Sriraman, Conceptualizing the notion of model eliciting. Fourth Congress of the ESRME, Spain, 2005. 17. E. Koleza and M. Iatridou, Experimentation: The hidden part of problem solving. 10th ICME, Denmark, 2004. 18. M. A. Hjalmarson, Designing Presentation Tools: A Window into Mathematics Teacher Practice. Purdue University, W Lafayette, IN, 2004. 19. T. J. Moore, Model-Eliciting Activities: A case-based approach for getting students interested in material science and engineering. J. Mat. Ed., 30, 2008, pp. 295–310. 20. M. T. Chamberlin, Design principles for teacher investigations of student work. Math. Teach Ed. Dev., 6, 2004, pp. 61–72. 21. H. A. Diefes-Dux, K. Bowman, J. S. Zawojewski, and M. Hjalmarson, Quantifying aluminum crystal size part 1: The Model-Eliciting Activity. J. STEM Ed., 7, 2006, pp. 51–63. 22. M. Hjalmarson, H. A. Diefes-Dux, K. Bowman and J. S. Zawojewski, Quantifying aluminum crystal size part 2: The Model-Development Sequence. J. STEM Ed., 7, 2006, pp. 64–73. 23. T. J. Moore and H. A. Diefes-Dux, Developing model-eliciting activities for undergraduate students based on advanced engineering context. Frontiers in Education Conference, Savannah, GA, 2004. 24. S. A. Chamberlin, Analysis of Interest During and After Model Eliciting Activities: A Comparison of Gifted and General Population Students. Purdue University, W Lafayette, IN, 2002. 25. G. Carmona, Designing An Assessment Tool To Describe Students’ Mathematical Knowledge. Purdue University, W Lafayette, IN, 2004. 26. T. J. Moore, Student Team Functioning and the Effect on Mathematical Problem Solving in a FirstYear Engineering Course. Purdue University, W Lafayette, IN, 2006. 27. A. Pollatsek, S. Lima and A. Well, Concept or computation: Students’ understanding of the mean. Ed. Studies Math., 12, 1981, pp. 191–204. 28. R. E. Groth and J. A. Bergner, Preservice elementary teachers’ conceptual knowledge of mean, median, and mode. Math. Think. Learn., 8, 2006, pp. 37–63. 29. J. E. Froyd, White paper on promising practices in undergraduate STEM education. National Research Council Workshop—Evidence on Promising Practices in Undergraduate STEM Education. Retrieved 4-13-09 http://www7.nationalacademies.org/bose/PP_Froyd_STEM%20White%20 Paper.pdf, 2008.
Tamara J. Moore is an Assistant Professor of Engineering and Mathematics Education at the University of Minnesota. She holds a Ph.D. in Engineering Education from Purdue University and is a former high school mathematics teacher. Her research involves helping K-16 students engage in STEM (Science, Technology, Engineering, and Mathematics) disciplines through contextual problem solving and modeling, and centers on the integration of STEM concepts in the mathematics and engineering classroom. She has been developing curricular tools, particularly Model-Eliciting Activities, and researching faculty and teacher professional development in this area. Margret A. Hjalmarson is an Associate Professor of Mathematics Education at George Mason University. She holds a Ph.D. in Curriculum and Instruction with a concentration in Mathematics Education from Purdue University. She is the Director of the Mathematics Education Center and the Coordinator of the Mathematics Education Leadership program at George Mason. Her research interests include mathematics curriculum design, development and implementation. She also investigates K-16 engineering education, curriculum, and assessment, and is interested in pre-service secondary mathematics teacher development.