speech is generally considered fast (see Shlesinger 2003), which means that the chosen segment has a fast ..... Pöchhacker, Franz & Shlesinger, Miriam (eds.).
Problems and difficulties in simultaneous interpreting from the point of view of skill acquisition Dalia Mankauskienė
1. Introduction This paper presents the initial findings of a broader study on the problems and difficulties that interpreters face during simultaneous interpreting and looks in particular at how their interpreting skills affect their performance. An experiment was carried out with five groups of interpreters, each with different levels of interpreting experience. They were asked to interpret the same extract twice (taken from a real conference) from English into their mother tongue of Lithuanian. After both interpretations they were asked to mark the parts of the transcript where they felt they had experienced difficulties. The main research questions of the study are the following: 1. Do student and professional interpreters have the same difficulties, but professionals cope with them better? 2. Are interpreters aware of the problems they face? 3. Are interpreters able to improve their performance through freed processing capacity? If so, to what extent? 4. What does this tell us about expertise in simultaneous interpreting? The following section is devoted to the theoretical background underlying this study, and highlights the problems and difficulties that interpreters face; the difference between these two ostensibly similar-sounding categories forms the focus of the article as a whole. The third section presents the methodology of the empirical analysis, while the fourth examines the results.
2. Theoretical background 2.1 Effort Models Daniel Gile’s (1995/2009) Effort Models were first created to explain the interpreting process to students, but soon gained popularity among researchers as well. According to Gile, the process of simultaneous interpreting may be shown as an equation of four Efforts: 1
SI = L + M + P + C, where L stands for the Effort of Listening and Analysis, M – Short Term Memory, P – Production and C – Coordination. Through the Listening and Analysis Effort, the interpreter understands the original text, then stores it in their Short-Term Memory and renders the target text through the Production Effort (which also includes self-monitoring and self-correction). While interpreting, all Efforts are used simultaneously and their sum cannot exceed the total processing capacity of an interpreter. Although the Coordination Effort was only later added to the model, its importance should not be underestimated as it is required to manage the processing capacity allocated to the other Efforts. As Liu (2008:173) notes, the Listening and Analysis Effort and the Production Effort may become less capacity-demanding as expertise develops. Increasing the efficiency of the capacity management mechanism contributes the most to the advancement of the skill of interpreting. Although all Efforts may be used at the same time, they nonetheless deal with different segments of the original text: when listening and analysis is used for segment C, the shortterm memory may be storing segment B while the Production Effort is working with segment A. This is because simultaneous interpreting is not actually simultaneous. Research on earvoice span shows that the time lag between the uttered original text and the uttered interpreted text is between 2 and 10 seconds (Setton 1999:28). The Tightrope Hypothesis followed the Effort Models and was equally illuminating. It showed that the total processing capacity requirements for simultaneous interpreting are close to the total available capacity, i.e. interpreters work close to saturation point of their processing capacity (Gile 1999, 1995/2009, 2011). This theory is supported by at least two facts: (1) that many misinterpretations and omissions are unlikely to have resulted from insufficient comprehension of the source text and (2) that when interpreting the same speech for the second time interpreters make new mistakes in segments they interpreted correctly the first time (Gile 1999). This is why, for the purposes of the present study, it is not only important to understand processing capacity but also the theory of error analysis. 2.2 Error analysis Error analysis is a quantifiable description of how an interpreted text differs from (1) the corresponding original text (accuracy), (2) linguistic norms and (3) the norms of coherence (fluency of delivery) (cf. Falbo 2002). As can be seen from this definition, interpreting errors are generally divided into two broad categories: those pertaining to accuracy and those to 2
fluency of delivery. However, what these broader categories consist of and how they should be measured differs from study to study (e.g. Riccardi 1999, Viezzi 2003, Pio 2003, Gile 2011). This is especially true of errors in source-target correspondence. Researchers have come up with various classifications for these differences but a clear system has yet to be established. In this study, the following accuracy errors were used to examine the discontinuities between the target text and the source text (hereafter errors and omissions or EOs) (based on Riccardi 1999, Falbo 2002, Pio 2003): 1. Omissions – one or more ideas in the source text are totally missing in the target text. This error category has received the most attention from researchers (e.g. Altman 1994, Barik 1994, Riccardi 2002, Setton 2002, Pym 2008 and many others). Researchers do not agree on the nature of omissions and whether all of them should be considered errors. In this study, only omissions of content information will be used, i.e. if the speaker repeats or corrects themself, this will not be factored into in the overall error calculation. 2. Additions – pieces of information in the target text where no reference to it could be found in the source text (Falbo 2002:121). These only include the kind of additions that cannot be justified for pragmatic reasons. 3. Generalisations – this category includes three types of information loss in Falbo’s (2002) classification: a ‘loss by understatement’, i.e. an idea in the source text is toned down in the target text, a ‘loss by generalization’, i.e. the scope of an idea in the source text is extended in the target text and a ‘loss of intensity’, i.e. emotional and rhetorical features of a source text unit are not transferred to the target text. 4. Substitutions – ideas in the source text altered when transferred to the target text (ibid. 2002:122). This kind of change may result in contradictions, ambiguity and misinterpretations with respect to the source text message (Pio 2003). This category also includes Riccardi’s (2001) ‘logical-time sequence errors’, i.e. an improper reproduction in the target text of the logical relation among clauses, phrases or sentences of the source text, as well as Falbo’s (2002) ‘loss of textual link’, i.e. a part of the source text, which is well-placed in its micro-context, is placed in a different part of the target text, so that a different link is created in relation to the preceding and following units. Additions, generalisations and substitutions may be lumped together as errors of meaning, which, according to Gile (2011:209), are ‘target speech segments where it seems 3
clear that the interpreter has misunderstood the idea expressed by a word or group of words’. This can result from insufficient background knowledge or linguistic expertise, from signal distortions (a speaker’s strong or unfamiliar accent, background noise, etc.), from cognitive saturation affecting the Listening Effort, or from a processing capacity deficit in the Production Effort (ibid. 2011:206). Although these errors arise due to the same reasons, it may be argued that generalisation is a less significant error than substitution as in the first case the listener receives the correct information, albeit with less detail, whereas in the second case the speaker’s idea is distorted (as is sometimes the case with additions as well). Fluency of delivery may be more difficult to measure than EOs. As Gile (1995/2009:172) puts it, ‘unless there is a clear difference from one moment to the next, it may be difficult to judge that an acceptable rendition of a particular speech segment could have been better had there not been a problem’. It should also be noted that ‘many grammatical errors in an interpreter’s output suggests a loss of control more strongly than omissions in an output that suffers from no grammatical errors’ (Gile 2011:206). For our purposes fluency of delivery is measured through the following indicators (hereafter FDIs) (based on Riccardi 1999, Pio 2003): 1. Unfilled pauses of more than 3 seconds that are not present in the source text. These lengthy silences may be unpleasant to listen to in terms of fluency and may point to the interpreter’s difficulty in performing his task (Déjean Le Féal 1980). The audience may also sense that they are not receiving trustworthy information, which can ‘undermine the relation of implicit trust between interpreter and the audience. Once you lose trust, you lose everything’ (Pym 2008:99). 2. Filled pauses which are vocalised hesitations such as eh, ehm and mmm. As with unfilled pauses, these signal the interpreter’s difficulty in performing their task and may also be detrimental to the trust between the interpreter and the audience. 3. Language errors is an extremely broad category, including a number of indicators which were measured separately, but due to their low rates of occurrence are more informative as a group: False starts – these occur when interpreters interrupt the translation of a sentence and start a new one. This may result in misinterpretations and deviations. Unfinished sentences. Pronunciation and phonation errors.
4
Repairs – when interpreters give a new rendition of a source segment they have already translated. Repetition of a word or group of words without any rhetorical or stylistic significance. Linguistic interference of the source language (in this case English) – the result of the auditive influence of the source language or source text on structures/elements of the target text that results in a deviation from the norms of the target language (Lamberger-Felber, Schneider 2008). Target language (in this case Lithuanian) errors – unnatural choice of words/syntax, incorrect word endings and similar mistakes that native speakers would notice and find jarring. In addition to these indicators, ear-voice-span (EVS) was calculated for all interpretations, because a longer EVS might signal that interpreters are having certain difficulties. Gerver (1969/2002) found that interpreters lengthened their ear-voice span when dealing with faster speeches. However, Pio’s (2003) analysis of the influence of rapid speech on the quality of interpreting found no such correlation. It is important to note that although these error categories are clearly separated in this paper for the purposes of analysis, they are closely interdependent and may influence one another to a great extent. 2.3 Problems and difficulties Problems and difficulties, as concepts, are closely related to errors. Nord (1991) was the first to distinguish between these two terms. She defined difficulties as subjective obstacles that a particular interpreter or trainee encounters in the translation process. Following this definition, in this study difficulties are considered segments of the source text noted by interpreters themselves as being difficult to interpret, i.e. interpreters subjectively see those specific segments as difficulties. Because they can be overcome by using the appropriate tools, it is reasonable to expect that, due to a higher level of expertise, professional interpreters would deal better with difficulties than student interpreters. On the other hand, problems are objective or at least intersubjective obstacles in translating discourse (Nord 1991:167). They will always remain problems even though a translator may have learned to deal with them rapidly and effectively. Nord’s definition of translation problems seems to correlate well with what is known as problem triggers (PTs) in 5
interpreting. This term was coined by Gile (1995/2009:171), who defined it as ‘anything that increases the processing capacity requirements of an interpreter (more effort needs to be put into listening/understanding, short-term memory or production) or increases signal vulnerability’. This definition is rather broad so it is not surprising that PTs have not been analysed in all their complexity – it is an impossible task. PTs may lead to diminished quality of interpreting in a segment that includes a specific PT, especially if that PT carries no redundant information and therefore must be interpreted in a codeswitching way, such as with numbers or proper names. However, Gile also points out that it may be difficult to associate an instance of diminished quality with the specific problem that caused it as it can lead to a failure sequence, i.e. the interpreter may have difficulties interpreting the segments after the one containing the PT as too much effort was expended rendering the segment with the PT. This has been shown to be true by several studies (e.g. Mazza 2001, Meyer 2008) and will be taken into consideration in our analysis as well. It should be noted that a clear distinction between problems and difficulties remains theoretical as the difficulties singled out by interpreters invariably include and overlap with problems as the latter are essentially universal. However, for the purposes of this analysis these two terms will be distinguished by the aforementioned definitions and will focus on what are obvious problems and what are obvious difficulties, while keeping in mind the conceptual overlap between the two terms. 2.4 Expert-novice paradigm The expert-novice paradigm in interpreting has attracted a great deal of scholarly attention: the performance of student interpreters and professional interpreters has been compared in multiple studies to determine what variances between these groups could be established and attributed to skill acquisition and, consequently, what might be done to improve an interpreter’s expertise (see Dillinger 1989, Sunnari 1995, Moser-Mercer 1997, Moser-Mercer et. al. 2000, Liu 2008, Tiselius 2013, to name a few). A more fine-grained comparison drawn from different levels of novice performers on their way to becoming experts offers even more valuable insights into the progression of skill acquisition. It should be mentioned that ‘the definition of levels of expertise in interpreting continues to compromise the reliability of many of these studies and constitutes an obstacle to replication with a view to validating their results’ (Moser-Mercer 2015:155). Students, for example, may have received varying degrees of training from study to study; similarly, some ‘expert’ interpreters might only be working in 6
their local market while others could have been working regularly for EU institutions that require accreditation. Research has shown that expert output is considered more meaningful and coherent; it sounds smoother and more natural (Barik 1975/2002, Sunnari 1995, Liu 2001). Liu (2009:173) summarised several studies on expert-novice performance and concluded that the product of expert interpreters is characterised by fewer errors, faster responses and less effort expended. Moreover, experts are more flexible in their semantic processing; they demonstrate a greater ability to distinguish essential units of meaning from ones of secondary importance (Liu et al. 2004). This would suggest that the omissions of less experienced interpreters are more likely to contain crucial information. Most studies to date have focused more on relative expertise (comparing novice interpreters to professionals) than absolute expertise (outstanding performers in their own right) (Tiselius 2015:152). This paper is also mostly concerned with relative expertise but research into absolute expertise could be a useful next step.
3. Methodology 3.1 Subjects The study analyses simultaneous interpretations from English into Lithuanian by 18 interpreters in total (4 male and 14 female); 10 interpreting students and 8 professional interpreters, 6 of which are accredited interpreters at EU institutions. All subjects have Lithuanian as their mother tongue and English as their B language. The subjects of the experiment were divided into five categories (Table 1) according to their experience. The division of student interpreters is simple: it was made according to the number of semesters they had received training in simultaneous interpreting. However, the two categories of professional interpreters are not as clear-cut. The first category (Prof1) includes interpreters who are working locally and have fewer opportunities to interpret, as well as one interpreter who had recently acquired EU accreditation but had less than a year of professional experience at the time of the experiment. The second category (Prof2) is comprised of interpreters working full time for EU institutions as well as highly experienced local interpreters, who not only work in the local market, but also teach interpreting at Vilnius University.
7
Student interpreters
Professional interpreters
I semester of II semesters of III semesters of Local and less interpreter interpreter interpreter experienced training training training interpreters 1 sem 2 sem 3 sem Prof1 3 3 4 3
Highly experienced interpreters Prof2 5
Table 1. Participants in the experiment.
3.2 Materials The material is taken from the European Ombudsman seminar: ‘It's our Europe: Let's get active!’, hosted by the European Parliament on 23rd April, 2013. The extract chosen is slightly longer than eight minutes (it is difficult to tell the exact time because it contains some lengthy pauses), consists of 1,223 words uttered by three speakers: the conference moderator, the main speech presenter and the conference secretary who talks about the questions received from online participants (for more details see Table 2). Speaker Moderator (3 interventions) Presenter, part I Presenter, part II Conference secretary
Speaking features native speaker; spontaneous speech
Delivery speed (wpm) 181
non-native speaker; delivers a prepared 139 presentation, but does not read it 156 non-native speaker; spontaneous speech; 157 questions received are read out
Table 2. Speakers and types of speech.
The average speech delivery speed of this extract is 156 words/minute (wpm). A 140wpmspeech is generally considered fast (see Shlesinger 2003), which means that the chosen segment has a fast delivery speed. It should be noted, however, that Dillinger (1989), the creator of the first computational model for simultaneous interpreting, used a deliberately faster rate (145 wpm) ‘in order to generate deviations’ (Setton 1999: 31). Following the example of Liu et al. (2004), the material was chosen so that the interpreters would be working with speech input under stressful conditions which are likely to jeopardise the completeness and accuracy of their output, i.e. the interpreters would be working close to their cognitive saturation level and would be forced to resort to automated interpreting strategies. 3.3 Procedure
8
Due to the busy schedules of the participants, the recordings took place on five separate occasions (June and September 2015; January, May and July 2016) in the professional simultaneous interpreting booths at Vilnius University. All the participants interpreted the same text twice in order to assess the impact of cognitive capacity limitations and sender-related and technical problem triggers. This also increased the likelihood that the subjects would be able to remember and note the difficulties they experienced while interpreting. Before the first interpretation, the participants were briefed about the overall topic and the setting of the conference. They were told that they would have to simultaneously interpret two texts but were not aware that the second text would be the same as the first. After the first interpretation, the participants were given a short break but were asked not to discuss their interpretations with each other. Only before the start of the ‘second’ text were they told this would be the same extract. It should be mentioned that the first few minutes of interpretation were not included in the scope of the analysis in order to give the participants the opportunity to warm up. After the second interpretation, the participants were given the transcript of the extract and were asked to note the segments they had found difficult to interpret and to include a brief explanation where possible. As think-aloud protocols are not possible in the interpreting process, researchers of interpreting often resort to retrospective protocols with either the original speech or the interpreting as a cue (Tiselius 2013). However, this makes it difficult to interview participants immediately after interpreting, which may affect the objectivity of the results. Therefore, a new form of retrospective protocol – marking the transcript – was devised for this study. 3.4 Data analysis Target texts were transcribed and intonation-based punctuation (commas and periods) was added where it seemed natural, with no other marks for prosody. These transcriptions were then compared to the original in the search for EOs, while FDIs were singled out by listening to each recording twice. As suggested by Gile (2011:208), in order to prioritise the reliability of the data a low sensitivity level was chosen, i.e. to reduce the probability of ‘false positives’, e.g. to avoid mistaking acceptable generalisations or compressions as omissions, only instances of what clearly seemed to be EOs were considered. The data was entered into UAM Corpus tool software which was then used to generate the initial results. All errors were noted on the specific segments they affected, which are 9
roughly equivalent to clauses. To keep the figures comparable, however, some clauses had to be divided into smaller segments. These are not the micro-units Gile (2011) used in his study as they were very rarely made up of just one or two words, but rather encompass the whole clause where possible (the average length is 5.5 words per segment). The difficulties that the interpreters noted on the transcript of the extract were also entered into the UAM Corpus tool software using the same segmentation as for the EOs. Additional information on whether the difficulty resulted in an error or omission was also included. In cases where a difficulty did not result in an error or omission, it was noted if an EO was made in the following segment. To check the reliability of the data on the content errors, 8 professional interpreters (out of which 6 are also interpreting/translation trainers at Vilnius University) were randomly divided into two groups of four and asked to identify EOs in two sets of transcripts (262 words) of three different interpretations of the same extract interpreted during the experiment. In set1, I identified 44 erroneously interpreted segments, out of which 39 (or 89%) were identified by all four evaluators, while the remaining 5 were identified by three evaluators. In set2 I identified 36 segments with EOs, out of which 33 (or 92%) were identified by all four evaluators; the remaining 3 were identified by three evaluators. It should be noted that the evaluators identified more EOs, but as a low sensitivity level was selected for this study, the results of this exercise are sufficient to confirm the validity of the findings. The results of this analysis are discussed below. If it is not indicated that a comparison is made between the two interpretations, it means that the discussion focuses only on the first interpretation as best reflecting a real life situation.
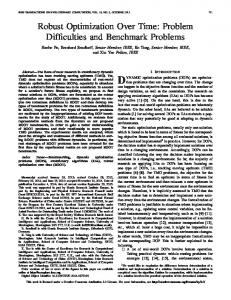
4. Results 4.1 Omissions and errors of meaning Interpreter performances varied from one interpreter to the next: from 20 to 101 EOs. In the student group, the range was between 55 and 101 EOs, while among the professional interpreters the range was from 20 to 77. Figure 1 represents the number and type of EOs made by the different groups of participants in the first and second interpretation. It is notable that on average the professional interpreters made 43 EOs, which break down to 29 omissions, 1 addition, 4 generalisations and 9 substitutions. Whereas the averages were
10
almost double in most categories among the student group: students made 79 EOs on average, consisting of 59 omissions, 2 additions, 5 generalisations and 13 substitutions. Let us first look at the category of omissions. The data show that the number of omissions was very similar among the students at different stages of their training, but in group Prof1 the figure was half that of student interpreters and even less than that in group Prof2. On the one hand, it is not surprising that experienced interpreters omitted less information, yet one might have anticipated greater variation in the performance of student interpreters. As expected, in the second interpretation the number of omissions decreased in all the groups. The figure declined most in group Prof2 (38%), while the smallest change was found in group Prof1 (17%). Yet it should be kept in mind that the absolute number of omissions among the latter group was still much lower than that of the student interpreters. In his study, Korpal (2012) found no statistically significant difference in the number of omissions made by student interpreters and professional interpreters, yet my data suggest the opposite: the amount of omissions in the student group ranged from 43 to 78, while the professional interpreters made between 14 and 56. The difference is statistically significant at a 0.2% significance level (t(stat) = 5.051 > t(krit) = 4.785). Moreover, the correlation between the group and amount of omissions stands at -0.79, indicating a very strong link between the amount of expertise and the number of omissions. The number of additions, on the contrary, was very low in all the groups and they decreased further in the second interpretation, except in group Prof1 where a slight increase was observed. But that is due to an increase from 1 to 2 in one interpreter’s performance and from 4 to 5 in another’s, both of which were exceptions. These low numbers might be due to the fact that the dense and swiftly delivered speech the interpreters were dealing with did not leave them any time to include additional information. The number of generalisations among the interpreters varied from 0 to 11, at an average of 5 per interpretation. It may be assumed that this is because generalisation was used as a coping strategy, but the numbers are too low to be certain. The number of generalisations in the second interpretation increased in the 1 semester student group, but this was due to a single interpretation in which 8 additional generalisations occurred in the second interpretation.
11
The number of substitutions was slightly higher than that of generalisations among all the groups: they ranged from 0 to 20, at an average of 11. A downward trend from the first interpretation to the second was not observed in two of the groups: the students with 3 semesters of training and the less experienced interpreters. In the other two student groups, the decline was minor. Only the more experienced interpreters were able to decrease the number of substitutions by half. These results are somewhat worrisome as substitutions are arguably the most significant errors an interpreter can make due to the fact that they not only omit information but also distort the message of the speaker. 70,0 60,0 50,0
60
58 42
59 45
41
40,0
33 28
30,0 1615
20,0 10,0 -
2024 1 sem
21
74
1110
2 sem
21
64
26
1213
3 sem
2244
1011
16 11
Prof1
52
8
4
Prof2
Omissions 1st Int
Omissions 2nd Int
Additions 1st Int
Additions 2nd Int
Generalisations 1st Int
Generalisations 2nd Int
Substitutions 1st Int
Substitutions 2nd Int
Fig. 1. Errors of meaning and omissions: average number of errors per interpreter within each group in the first and second interpretations.
Merely counting the number of EOs, however, does not present a complete picture. As the focus of this study is the difficulties and problems interpreters face, it would be more relevant to analyse whether the EOs in the second interpretation occurred in the same segments as in the first. For example, one of the students made 89 EOs in the first interpretation and 68 EOs in the second, but these EOs might have been made while interpreting different segments of the text. Therefore, we need to analyse (1) EOs that were made only in the first interpretation, i.e. the ones that were corrected in the second interpretation, (2) EOs that were partially corrected in the second interpretation, (3) EOs that were made in both interpretations and, lastly, (4) EOs that were made only in the second rendition, i.e. new EOs. The data on student performances in all three groups reflect a rather similar output, while there are significant differences between the professional interpreters (for absolute 12
numbers see Fig. 2; percentages are shown in Fig. 3). In the second interpretation student interpreters fully or partially corrected on average 45% of the erroneously interpreted segments of the first interpretation, while in group Prof1 this figure stands at 37% and in group Prof2 at 57%, which is a considerable difference. There was also notable variation in the number of EOs made during both interpretations; this figure is around 40% in all student groups and group Prof1, while in group Prof2 it stands at around 25%. 45
39
40 35 30
39 35
33
30
29
29
24
25 19
20 14
15 10
13
9
10
11
13
5
13
13 8 3
1
1 sem EOs only in 1st Int
2 sem
3 sem
EO was partly corrected in 2nd Int
Prof1 EOs in both Int
Prof2 New EOs in 2nd Int
Fig. 2. EOs according to where they occurred: average per interpreter within each group.
Clearly, the more experienced interpreters corrected more mistakes in the second interpretation, yet the number of ‘new errors’ they made is the smallest only in absolute terms but not in proportion, as one would also expect. The presence of these new EOs suggests that the difficulty of processing capacity management, or cognitive saturation, is at fault rather than poor linguistic or extralinguistic knowledge. The fact that even the most experienced interpreters made new EOs in their performance is consistent with the Tightrope Hypothesis.
13
100%
12%
15%
14%
80% 60%
37%
43%
40%
9%
20%
33% 1 sem
13%
42%
21%
17% 25%
42%
12%
2%
38%
32%
35%
2 sem
3 sem
Prof1
5% 52%
0% EOs only in 1st Int
EO was partly corrected in 2nd Int
EOs in both
Prof2 New EOs in 2nd Int
Fig. 3. Percentage of EOs according where they occurred, if all EOs of the group were equal to 100%.
The segments that were erroneously interpreted in both renditions by several interpreters may be seen as problems of interpretation. These segments will be briefly discussed in the section about difficulties (4.3), but a more detailed analysis is beyond the scope of this paper.
4.2 Fluency of delivery and EVS The three indicators for fluency of delivery show certain dissimilarities between the various student groups and professional interpreters. The biggest difference was in the average of unfilled pauses, which stood at 23 among the student groups but only at 3 among the professional interpreters. The average for filled pauses was 14 and 7 respectively. The students made 9 language errors on average, while the professional interpreters made 6. Unfilled pauses are either due to poor understanding of the original text (Listening and Analysis Effort) or due to reformulation issues (Production Effort). There is a strong correlation (0.70) between the number of EOs made and the instances of silent pauses, which means that unfilled pauses are a good indicator that an interpreter is having difficulties. As Figure 4 illustrates, the student interpreters were clearly struggling much more than their professional counterparts. All the interpreters made considerably fewer unfilled pauses when interpreting the same extract a second time. The greater number of silent pauses in the student groups may also be due to the fact that they have been trained not to interpret something they have not clearly understood. Although the number of filled pauses was lower in the professional group, it should be noted that there was nonetheless a broad range (0 to 34) of this indicator among the 14
interpreters. It largely seems to depend on the style of an individual interpreter – some interpreters tend to include more ehrs and uhms than others. Of 8 professional interpreters, two made more filled pauses, 17 and 22 respectively, while others either did not make them at all or else the number was very low. However, out of 10 student interpreters, only 4 had fewer than 10 filled pauses, which suggests that students have not been able to properly monitor their output. In the second rendition, two interpreters substantially improved their performance, while the performance of 3 other interpreters deteriorated, the overall result of which meant that the averages of both groups went up rather than down. ‘Language errors’ is another indicator that interpreters are having difficulties and are not able to monitor their performance. That is especially true because all participants were interpreting into their mother tongue. The range here is not great – from 3 to 14 errors per interpretation in the first rendition and from 1 to 19 in the second. The most experienced interpreters again made fewer mistakes than the other participants, yet there was no clear downward trend in the first two student groups. 30 25
24
23
20 15
17 16 12
16 13
22 15
13
12 9
10
6
15 14 8
8
7 4
5
4
9 10 3
2
6 2 2
3
4
3
1 sem
2 sem
3 sem
Prof1
Unfilled pauses 1st Int
Unfilled pauses 2nd Int
Filled pauses 1st Int
Filled pauses 2nd Int
Language errors 1st Int
Language errors 2nd Int
Prof2
Fig. 4. FDIs: averages per interpreter within each group in the first and second interpretations.
If we were to add these three FDIs together to indicate the number of times the listener might have been alerted to the fact that the interpreter was having difficulties and compare them to the number of segments affected by EOs, the results would be quite revealing (see Fig. 5). It would be reasonable to expect a downward trend among the students that progresses in line with their training but this is not the case. This may be due to the different pace that individuals improve and acquire new skills. However, there is a clear drop in all indicators 15
when we compare the student and professional interpreters, and an even greater change if we compare the performance of highly experienced interpreters. Moreover, the latter was the only group to decrease the number of errors in both categories almost by half. 90 80 70
80
78 62
60
52
50 40
79 63
57 44
39
49
45 34
45
40
30
30
21
20
15
23 12
10 1 sem
2 sem EOs 1st Int
3 sem EOs 2nd Int
FDIs 1st Int
Prof1
7
Prof2
FDIs 2nd Int
Fig. 5. Number of EOs and FDIs: averages per interpreter within each group in the first and second interpretations.
Another interesting aspect that needs to be discussed is EVS. This was calculated as the arithmetic mean of nine different points in each interpretation (three at the beginning of the extract, three in the middle and three at the end). Only 4 out of 18 participants lengthened their EVS in the second interpretation, which suggests that increased processing capacity allows interpreters to shorten their EVS. This might also account for the fact that professional interpreters, on average, have a shorter EVS than student interpreters (Fig. 6). There is a medium strength correlation (0.53) between the EVS and the number of FDIs, indicating that the longer the EVS, the more difficult it may be for interpreters to perform their task. However, this hypothesis needs to be more thoroughly explored to be confirmed. 5,0 4,0
4,5
4,2 3,5
3,8
3,7
4,3 3,4
3,0
2,8
3,3
3,2
2,0 1,0 1 sem
2 sem EVS 1st interpretation
3 sem
Prof1
Prof2
EVS 2nd interpretation
Fig. 6. Ear-voice-span: average length in seconds per interpreter in each group.
16
4.3 Quantitative analysis of difficulties On average the students reported more difficulties than the professional interpreters (26.8 vs 16.6) and the actual figures vary from 15 to 51 for the students and between 6 to 34 for the professionals. One reason for this difference is the fact that some participants noted whole passages as being difficult, for reasons such as the speed of delivery, which resulted in higher numbers overall as those passages were divided into segments for the data on difficulties to be comparable with the data on EOs. There were 18 segments that three or more professional interpreters noted as difficult, whereas this number stood at 36 for the students. Judging from the fact that the student interpreters noted 16 of the 18 segments noted by professionals, both groups clearly experienced the same difficulties, but the students experienced more of them. There were 63 segments in the student group that were not noted as difficult but which resulted in errors in more than half of the performances, i.e. in five or more interpretations. If a participant noted a segment as difficult and made an error in that segment, his/her error was not included in these calculations, but if he/she did not note the difficulty and made an error, the segment was counted. In the group of professional interpreters this figure stands at 29 which, unsurprisingly, confirms that professional interpreters are more aware of the difficulties they experience while interpreting. Interestingly, out of the 29 segments noted by the professionals, 18 were also referred to by the students. This suggests that these segments are serious translation problems that interpreters remain unaware of rather than accidental errors arising from processing capacity limitations. The data confirms that interpreters learn to deal with the difficulties they face with growing expertise: the proportion of noted difficulties that did not result in any errors was highest in the group of professionals. There is also a clear upward trend if we look at all the groups (see Fig. 7). Moreover, a noticeable increase in all percentages may be observed when comparing the two interpretations, especially in the students with 3 semesters of training and the most experienced interpreters. This suggests that, given the opportunity, more experienced interpreters find a way to cope better with the difficulties they face while novice interpreters still lack the appropriate tools.
17
80,0% 60,0% 40,0%
25,8% 29,6%
32,5%
39,1%
49,8% 33,0%
40,4%
49,0%
47,6%
61,4%
20,0% 0,0% 1 sem
2 sem
3 sem
Prof1
Prof2
% of difficulties that did not result in errors, 1st interpretation % of difficulties that did not result in errors, 2nd interpretation
Fig. 7. Proportion of difficulties that did not result in errors: average percentage among group members.
There is a medium strength correlation (0.61) between the number of EOs and the number of difficulties that resulted in EOs, which confirms the assertion that the more EOs interpreters make, i.e. the less expertise they have, the more challenging it is for them to deal with the difficulties they face while interpreting. This may also be seen from the fact that students tend to mark shorter segments as being problematic, which result in longer sequences of errors, e.g. they mark one word, but omit or mistranslate the whole sentence. On the other hand, the data also suggest that perhaps interpreters are not always aware of the difficulties they encounter or for some reason do not want to admit to experiencing them. Let us take a closer look at the segments that were erroneously interpreted in both interpretations by at least half (9) of the interpreters. There were 28 such segments, out of which only 6 segments were noted as difficult by at least half of both groups, 4 of them coincided in both groups. For the sake of comparison, we can also look at the segments erroneously interpreted by a third of the interpreters. There were 62 such segments, out of which only 12 were marked as difficult by at least half of the students and only 8 by at least half of the professionals (32 by a third of the students and 15 by a third of the professionals). A comparison between the students and professionals in terms of the difficulties they had may be summed up in a simple matrix in which all the segments that had to be interpreted are equal to 100% (Table 3). The fact that the professional interpreters coped better with the segments they found difficult (4% vs 9% in the first interpretation and 3% vs 8% in the second) can be reconfirmed. However, both groups had the same proportion of difficulties that did not result in errors and the student interpreters showed a greater improvement on this indicator in the second interpretation. Student interpreters
Professional interpreters 18
Difficult
Not difficult
Difficult
Not difficult
1st Int
2nd Int
1st Int
2nd Int
1st Int
2nd Int
1st Int
2nd Int
Error
9.0%
7.5%
28.5%
21.3%
4.1%
3.0%
16.4%
11.8%
Non error
3.7%
5.2%
58.8%
66.0%
3.8%
4.9%
75.8%
80.3%
Table 3. Proportion of segments according to whether they were noted as difficult and whether they resulted in errors.
When analysing problems and difficulties, it is worth considering what seems not to have been problematic to interpret. The whole extract was divided into 211 segments and there were only 11 segments that did not result in EOs among both groups (students and professionals) in both interpretations. This figure increases to 35 if we only look at the second interpretation. No professional marked a segment as difficult in 126 cases (more than half), while in the student group this figure is 76 (more than a third). As expected, professional interpreters rendered more segments correctly and without having obvious difficulties (76% vs 59%). The biggest difference between the groups is in the erroneously interpreted segments that did not seem difficult. This could partly be explained by the Tightrope Hypothesis; as interpreters work close to cognitive capacity saturation they make mistakes where no apparent difficulty could be found in the original speech. However, it may also suggest that interpreters, and student interpreters in particular, are not fully aware of the difficulties they have during the act of simultaneous interpreting.
5. Conclusions This paper presents a quantitative analysis of problems and difficulties that student interpreters and professionals face while interpreting simultaneously. The terms of difficulties, or subjective obstacles that are identified in the interpreting process by the interpreters themselves, and problems, or objective obstacles that are difficult to deal with irrespective of how well an interpreter learns to solve them rapidly and effectively, are used throughout the paper as the methodological basis that has helped to confirm some wellknown assertions on interpreting, while also revealing some interesting results concerning all the groups involved in the experiment. Returning to the research questions raised at the beginning of the paper, the hypothesis that students and professionals have the same difficulties while interpreting was confirmed, 19
as well as the assertion that professional interpreters cope better with the difficulties they have. However, the hypothesis that interpreters are aware of the various translation problems they face could not be substantiated as a significant number of EOs were made in the segments that were not noted as difficult, especially among the student participants. As these are the same segments in the first and second interpretation, the EOs cannot be explained by the Tightrope Hypothesis. This conclusion is worrisome as it shows that in some cases interpreters are not able to improve their skills because they are not aware of the difficulties they face and cannot objectively assess their own performance. The study has shown that although the difference in performance by student interpreters and professionals was largely predictable, in certain cases the performances of less experienced professionals were more similar to student interpreters than to the more experienced professionals, while the results of students with 3 semesters of training were more similar to the other two student groups than to the less experienced professionals. This may seem understandable given that these students had only just finished their training. Yet one could reasonably expect their results to be closer to those of practising professionals under consideration that they were soon to start work as professional interpreters. However, the relatively small number of participants in the groups does not allow us to draw definitive conclusions. The results prove that all interpreters improve their performance when given an opportunity to interpret the same extract again: in the second interpretation students made 23% fewer EOs and 18% fewer FDIs, while for professional interpreters these figures stand, respectively, at 32% and 31%. However, it is clear from our results that, in general, student interpreters lack the appropriate tools and their improvement through freed processing capacity is not as substantial as that of professional interpreters. This is especially true with regard to fluency of delivery, providing an indication of what skills students need to develop further. The expert-novice paradigm lends itself to the study of relative expertise. However, this should only be seen as a first step in a study of absolute expertise which might be able to provide us with a clearer idea of how expert interpreters (a term not to be confused with professional interpreters) perform under the everyday pressure they experience. Further steps in this broader study will include scrutiny of all the segments of the extract in order to find out which attributes of the segment (e.g. lexical density, language function, known problem 20
triggers, etc.) and which circumstances (e.g. speed of delivery, native/non-native speaker, spontaneous/prepared speech, etc.) cause the various errors made by interpreters. An additional area of research could be to identify the kind of strategies successful interpreters employ to cope with the problems and difficulties they face while interpreting simultaneously.
21
References Altman, Janet. 1994. Error analysis in the teaching of simultaneous interpretation: A pilot study. In: Lambert, Sylvie & Moser-Mercer, Barbara (eds.). Bridging the gap: Empirical research in simultaneous interpretation. Amsterdam/Philadelphia: John Benjamins, 25-38. Barik, Henri C. 1975/2002. Simultaneous Interpretation: Qualitative and Linguistic Data. In: Pöchhacker, Franz & Shlesinger, Miriam (eds.). The Interpreting Studies Reader. London/New York: Routledge, 79-91. —— 1994. A Description of Various Types of Omissions, Additions and Errors of Translation
Encountered in Simultaneous Interpretation. In: Lambert, Sylvie & Moser-Mercer, Barbara (eds.). Bridging the gap: Empirical research in simultaneous interpretation. Amsterdam/Philadelphia: John Benjamins, 121-137. Déjean Le Féal, Karla. 1980. Die Satzsegmentierung beim freien Vortrag bzw. Beim Verlesen von Texten und ihr Einfluß auf das Sprachvertsehen. In: Kühlwein, Wolfgang & Raasch, Albert (eds.). Sprache und Verstehen. Tübingen: Günter Narr Verlag, 161-168. Dillinger, Michael L. 1989. Component Processes of Simultaneous Interpreting. McGill University: unpublished doctoral thesis. Falbo, Caterina. 2002. Error analysis: a research tool. In: Garzone, Giuliana, Mead, Peter & Viezzi, Maurizio (eds.). Perspectives on Interpreting. Bologna: CLUEB, 111-127. Gerver, David. 1969/2002. The Effects of Source Language Presentation Rate on the Performance of Simultaneous Conference Interpreters. In: Pöchhacker, Franz & Shlesinger, Miriam (eds.). The Interpreting Studies Reader. London/New York: Routledge, 53-66. Gile, Daniel. 1995/2009. Basic Concepts and Models for Interpreter and Translator Training. Revised edition. Amsterdam/Philadelphia: John Benjamins. —— 1999. Variability in the perception of fidelity in simultaneous interpretation. Hermes,
Journal of Linguistics, 22, 51-79. —— 2011. Errors, omissions and infelicities in broadcast interpreting. Preliminary findings
from a case study. In: Alvstad, Cecilia, Hild, Adelina & Tiselius, Elisabet (eds.). Methods and Strategies of Process Research. Integrative Approaches in Translation Studies. Amsterdam/Philadelphia: John Benjamins, 201-218.
22
Korpal, Pawel. 2012. Omission in Simultaneous Interpreting as a Deliberate Act. In: Pym, Anthony & Orrego-Carmona, David (eds.). Translation Research Projects 4. Tarragona: Intercultural Studies Group, 103-111. Lamberger-Felber, Heike & Schneider, Julia. 2008. Linguistic interference in simultaneous interpreting with text: A case study. In: Hansen, Gyde,
Chesterman, Andrew &
Gerzymisch-Arbogast, Heidrun (eds.). Efforts and Models in Interpreting and Translation Research. Amsterdam/Philadelphia: John Benjamins, 215-236. Liu, Minhua. 2001. Expertise in Simultaneous Interpreting: A Working Memory Analysis. University of Texas at Austin: unpublished doctoral thesis. ——2008. How do experts interpret? Implications from research in Interpreting Studies and
cognitive science. In: Hansen, Gyde, Chesterman, Andrew & Gerzymisch-Arbogast, Heidrun (eds.). Efforts and Models in Interpreting and Translation Research. Amsterdam/Philadelphia: John Benjamins, 159-178. Liu, Minhua, Schallert, Diane L. & Carroll, Patrick J. 2004. Working memory and expertise in simultaneous interpreting. Interpreting, 6 (1), 19-42. Mazza, Cristina. 2001. Numbers in Simultaneous Interpretation. The Interpreters’ Newsletter, 11, 87-104. Meyer, Bernd. 2008. Interpreting Proper Names: Different Interventions in Simultaneous and Consecutive Interpreting? Trans-kom, 1 (1), 105-122. Moser-Mercer, Barbara. 1997. The expert-novice paradigm in interpreting research. In: Fleischmann, Eberhard, Kutz, Wladimir & Schmitt, Peter A. (eds.). Translationsdidaktik. Grundfragen der Übersetzungswissenschaft. Tübingen: Gunter Narr, 255-26. ——2015. Expert-novice paradigm. In: Pöchhacker, Franz (ed.). Routledge encyclopedia of
interpreting studies. London/New York: Routledge, 155. Moser-Mercer, Barbara, Frauenfelder, Ulrich, Casado, Beatriz & Künzli, Alexander. 2000. Searching to define expertise in interpreting. In: Englund Dimitrova, Birgitta & Hyltenstam, Kenneth (eds.). Language Processing and Simultaneous Interpreting. Amsterdam/Philadelphia: John Benjamins, 107-132. Nord, Christiane. 1991. Text Analysis in Translation. Theory, Methodology and Didactic Application of a Model for Translation-Oriented Text Analysis. Amsterdam: Rodopi. ——1997. Translating as a Purposeful Activity: Functionalist Approaches Explained.
Manchester: St. Jerome.
23
Pio, Sonia. 2003. The Relation between ST Delivery Rate and Quality in Simultaneous Interpretation. The Interpreters’ Newsletter, 12, 69-100. Pym, Anthony. 2008. On Omission in Simultaneous Interpreting: Risk Analysis of a Hidden Effort. In: Hansen, Gyde, Chesterman, Andrew & Gerzymisch-Arbogast, Heidrun (eds.). Efforts and Models in Interpreting and Translation Research. Amsterdam/Philadelphia: John Benjamins, 83-105. Riccardi, Alessandra. 1999. Attuali metodi di valutazione dell'interpretazione presso la SSLMIT. In: Viezzi, Maurizio (ed.). Quality Forum 1997. Esperienze, Problemi, Prospettive. Trieste: SSLMIT, 33-50. —— 2001. Dalla Traduzione all'Interpretazione – Studi di Interpretazione Simultanea.
Udine: Il Campo. ——2002. Interpreting Research. In: Garzone, Giuliana &
Viezzi, Maurizio (eds.).
Interpreting in the 21st Century. Amsterdam/Philadelphia: John Benjamins, 15-27. ——2005. On the Evolution of Interpreting Strategies in Simultaneous Interpreting. Meta:
Translators' Journal, 50 (2), 753-767. Shlesinger, Miriam. 2003. Effects of presentation rate on working memory in simultaneous interpreting. The Interpreters’ Newsletter, 12, 37-49. Setton, Robin. 1999. Simultaneous Interpretation: A cognitive-pragmatic analysis. Amsterdam/Philadelphia: John Benjamins. ——2002. A methodology for the analysis of interpretation corpora. In: Garzone, Giuliana &
Viezzi, Maurizio (eds.). Interpreting in the 21st Century. Amsterdam/Philadelphia: John Benjamins, 29-45. Sunnari, Marianna. 1995. Processing strategies in simultaneous interpreting: ‘saying it all’ vs. synthesis. In: Tommola, Jorma (ed.). Topics in Interpreting Research. Turku: University of Turku, 109-119. Tiselius, Elisabet. 2013. Experience and Expertise in Conference Interpreting: An Investigation of Swedish Conference Interpreters. University of Bergen: unpublished doctoral thesis. ——2015 Expertise. In: Pöchhacker, Franz (ed.). Routledge encyclopedia of interpreting
studies. London/New York: Routledge, 152-155. Viezzi, Maurizio. 2003. Interpreting Quality: a Model. In: Collados, Ángela & Pinilla, José Antonio Sabio (eds.). Avances en la investigación sobre interpretación. Granada: Comares, 147-171. 24