A Peep at Pornography Web in China Zhaohui Wu
Lu Jiang
Qinghua Zheng
MOE KLINNS Lab and SKLMS Lab Department of Computer Science and Technology Xi'an Jiaotong University Xi'an 710049, P.R.China
MOE KLINNS Lab and SKLMS Lab Department of Computer Science and Technology Xi'an Jiaotong University Xi'an 710049, P.R.China
MOE KLINNS Lab and SKLMS Lab Department of Computer Science and Technology Xi'an Jiaotong University Xi'an 710049, P.R.China
[email protected]
[email protected]
[email protected]
Zhenhua Tian
Jun Liu
Junzhou Zhao
MOE KLINNS Lab and SKLMS Lab Department of Computer Science and Technology Xi'an Jiaotong University Xi'an 710049, P.R.China
MOE KLINNS Lab and SKLMS Lab Department of Computer Science and Technology Xi'an Jiaotong University Xi'an 710049, P.R.China
MOE KLINNS Lab and SKLMS Lab Department of Automation Science and Technology Xi'an Jiaotong University Xi'an 710049, P.R.China
[email protected]
[email protected]
[email protected]
ABSTRACT This paper seeks to gain improved insight into the pornography web in China when the authorities step up the anti-pornography campaigns as part of China‟s Internet regulation. Based on our collected snapshots of 92950 pornographic web pages from 1826 pornographic sites over a span of 10 months, we measured the users‟ visiting behavior in different time scale, and the distribution of porn web sites in quantity and geography. Our findings indicate the clampdown on pornography web made a difference but never eradication to online porn and the pornography web sites‟ geographic distribution is positively correlated with regional economic level. We also find that there exists “Pareto principle” in both online porn visiting number of a user and the number of visits to a porn site. Both visiting number per user and number of users under a certain quantity of online porn visits obey the power law. Similarly, number of visits per porn site and number of porn sites under a certain number of visits follow the power law. To the best of our knowledge, this work is the first quantitative study on the Chinese online porn. We hope our work could shed some light on the present and future of pornography web in China.
Categories and Subject Descriptors J.2 [Computer Applications]: Physical Science and Engineering – engineering, mathematics and statistics, physics.
Permission to make digital or hard copies of all or part of this work for personal or classroom use is granted without fee provided that copies are not made or distributed for profit or commercial advantage and that copies bear this notice and the full citation on the first page. To copy otherwise, or republish, to post on servers or to redistribute to lists, requires prior specific permission and/or a fee. WebSci’10, April 26–27, 2010, Raleigh, North Carolina, USA. Copyright 2010 ACM 1-58113-000-0/00/0010…$10.00.
General Terms Measurement, Economics, Experimentation
Keywords Pornography web, China, anti-pornography, power law
1. INTRODUCTION Up to the end of 2009, the number of netizens in China reached 384 million, the largest population in the world, while 33% are adolescent under 19 mostly in elementary and secondary school [1]. Meanwhile, the juvenile crime rate of China has increased alarmingly up to 80%, and more than 80% of the juvenile delinquents are reported to be affected to some extent by online porn and violence [2]. It seems that “purification of the Internet and fighting of online porn and crime are closely tied to the country‟s stability” is not an alarmism. Thousands of online porn sites were taken down and arrests and criminal cases were investigated in the past years. Central government officials even cited a need to control pornography in ordering that filtering software (named “Green Dam Youth Escort”) be installed on all new computers sold in China. Pornography has become an enormous commercial success in the last two decades in western [3], but it has been and is still illegal in China. What is the real status of online porn becomes an interesting issue. Is the Internet in China now a green one? Did the online porn be clamped down without offering any resistances or made stubborn struggles? By monitoring part of network traffic in Northwest Net of China, from Mar. 29 2009 to Jan. 25 2010, we collected 92950 online porn web pages from 1826 porn sites, including crawling pages and detected user visiting pages. We study our collected dataset to get a peep at the online porn in China and some of our main findings are summarized as follows:
1) Anti-porn campaigns lead significant influence to online porn but new porn sites continuously emerge. 2) “Pareto principle” resides in both users‟ online porn visiting behavior and porn sites‟ visits quantity. 3) Proportion of porn sites, Internet penetration rate and per capital GDP in each province of mainland China are positively correlated with each other. This paper is organized as follows. Section 2 describes our experimental setup, including a brief introduction to the monitoring system and the collected dataset. We conduct measurement on users‟ visiting behavior in Section 3, discussing the daily and average hourly visits and probing into the number of users‟ visits and number of users under a certain visiting times. In Section 4 we focus on the measurement of porn sites. We discuss the distribution of the number of visits to a porn site and analyze the correlation amongst geographic distribution of porn sites, Internet penetration rate and per capital GDP. Finally we make conclusion and present our future work in Section 5.
2. EXPERIMENTAL SETUP All our data are collected by our online monitoring system by two approaches, the porn web page focused crawler and the online pornographic content monitor, from Mar. 29th 2009 to Jan. 25th 2010. Below we give a brief introduction to our monitoring system and describe the dataset collected.
2.1 Introduction to the monitoring system The monitoring system is mainly constituted of data capturing, content analysis, and warning subsystems. The data capturing subsystem captures and reduces all the monitored network flow in real time, mirroring the html page, Flash, image and video in local disk. The reducing speed can reach 700Mbps while the average package loss rate is less than 10%. The content analysis subsystem detects pornographic web pages from the reduced data using technologies combination of black and white list, text and image recognition, URL and web structure analysis. For a new record from the data capturing subsystem, the subsystem first checks whether its URL is in black or white list which record pornographic and benign URL respectively. If neither, its local snapshot will be analyzed using text and image recognition techniques. Number of porn keywords, number of images and text length of the snapshot determine whether text recognition or image recognition will be chosen to analyze the snapshot. In our experimental environment, we found that more than 80% of porn pages were detected by text recognition. The web based warning subsystem provides visualization and retrieval for warning information, such as the latest detected records, the history records, and some statistics based on them. We integrated the focused crawler into the monitoring system as an active agent to discovery pornographic sites. It calls the content analysis subsystem to facilitate its parsing and analyzing for a target web page. A crawled or detected porn page will be recorded in database and mirrored as a snapshot. The record contains the web page‟s URL, user IP, visiting time, capturing time, the snapshot‟s location, the web server‟s IP and other warning information.
2.2 Data Collection The monitoring system begun to run at Mar. 29 2009, monitoring selected networks‟ flow in Northwest Net of China. Up to Jan. 25, we collected 92950 records from 1826 porn sites belonging to 33 different domains in total, where 64474 records are crawled and others detected by the monitor. Notice that text and image recognition cannot guarantee a full precision. The 1826 porn sites are retained after removing misjudges by manual check. Table 1 reports the distribution of each high-level domain. The second column presents the fraction of the collected porn sites belonging to each domain. The third column lists the distribution of domains in China [1]. The „misc‟ category contains other domain such as .cc, .ru, .uk, .us, .tv and so on. We can see a palpable disparity between the domain distribution in porn sites and all Chinese sites. There are 80% sites of “.cn” domain and 16.6% of “.com”. However, in the collected porn sites, 56.8% sites own a domain of “.com”, but only 10.5% porn sites own “.cn”. Such a contrast might reflect the strict domain policy in China. Although our data cannot show the accurate statistics of porn sites domains, we may infer that most porn sites in China do not registered their domains in China but aboard. However, 10.5% is not a small fraction after all. Even under the strict domain policy, there are fishes that have slipped through the net. Table 2 shows the distribution of user IPs. All records are from 1080 user IPs among 110 subnets. Here all IPs are IPv4, and a subnet can hold 254 hosts. For IP class A or B, number of subnets does not equal number of networks of class A or B. For example, 15 subnets distribute in 3 networks of class A. Notice that there also exists some private networks which use private IP address space, and the network flow from them shares the same IP. So the number of user IPs is larger than that of actual users. However, we speculate it will not undercut our measurement. Table 1. Distribution of domains
.com
Percentage in porn sites 56.8%
Percentage in all Chinese sites 16.6%
.cn
10.5%
80.0%
.info
10.5%
-
IP address
7.6%
-
.net
6.0%
2.6%
.jp
1.5%
-
.org
1.4%
0.8%
misc
5.3%
-
Domain
Table 2. Distribution of user IPs IP class
No. of subnets
Fraction of IPs
A
15
13.5%
B
2
0.2%
C
93
86.3%
Table 3. Source of anti-pornography campaign news URL www.isc.org.cn/MoreArticle.php?ClassID=165 www.cyberpolice.cn/infoAction.do?act=noticetune net.china.com.cn/pgl/node_6042.htm
No. of detected online porn visits
Topic Anti-Smut campaigns Trends of anti-porn Porn sites shutdown
600
500
400
300
200
100
0
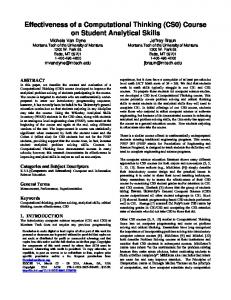
3.1 Basic Analysis In Figure 1 we show the daily online porn visiting number from March 29 2009 to January 25 2010, with date along the x-axis. The horizontal green line in the middle of the figure indicates the average number of daily online porn visits i.e. 90. To investigate whether there exist potential factors affecting the fluctuation in the figure, we examined the dates of anti-pornography campaign news (The URLs are shown in Table 3) issued in governmental or government supported web sites [2], and found most of these dates have below-than-average daily online porn visits. This indicates that the government‟s anti-porn campaign on Internet leads significant influence to online porn. From the news, one can know that thousands of porn sites were shut down in different provinces in China during the campaign. Why number of the online porn visits fluctuates but never creases? The emergence of new porn sites and the rapid change of domain names of existing porn sites may explain the reason. We count each day‟s new porn sites, and plot the cumulative number of porn sites from the first day to the last, shown in Figure 2. Starting from May 17 2009, the increasing trend is approximately linear. The continuous increase trend of new porn sites suggests that China‟s war against online porn might be endless. We also study the distribution of number of visits in different time of a day. For all the detected visiting records, we count the total number of records in each hour of a day. The hourly distribution of online porn visits within a day is shown in Figure 3. We can see that around 12 o‟clock in both day and night are the most active time ranges of online porn visits, while at nadir 6 a.m. there are the fewest visits. In general, visits are inclined to occur in spare time (except sleeping time) than working hours. We infer that such distribution resembles that of normal online visits.
5.17.2009
7.6.2009
8.25.2009
10.14.2009
12.3.2009
1.22.2010
Date
Figure 1. Daily number of detected online porn visits.
2000
Accumulated No. of porn sites
In this section, we focus on the measurement of users‟ visiting behavior. Here a user is defined by a unique IP address. First, in section 3.1 we present the basic analysis grounded on the daily and the average hourly visiting number during the ten months. Second, we delve into the visiting records to seek whether there are some interesting principles in user visiting behavior. Specifically we find that number of online porn visits follows the “Pareto principle”. Besides, the ranked number of users‟ visits and number of users under a certain visiting times are well fitted by power law.
3.29.2009
1500
1000
500
0
8.25.2009 10.14.2009 12.3.2009 1.22.2010
3.29.2009 5.17.2009 7.6.2009
Date
Figure 2. Increasing Trend of porn sites.
0.07
Fractio of online porn visits each hour
3. MEASUREMENT ON VISITING BEHAVIOR
0.06
0.05
0.04
0.03
0.02
0.01
0.00
1
3
5
7
9
11
13
15
17
19
21
23
Hour
Figure 3. Average hourly proportion of detected visits.
3.2 Users’ behavior analysis We begin our analysis on users‟ visit with the following questions: who are the most active online porn visitors? How often do they visit the porn sites? After ranking all the users‟ visiting number, we find that number of online porn visits follows the “Pareto principle” (also known as the 80-20 rule) [4], which is a wide existence in many nature phenomena. In our dataset, top 20% users‟ visits account for 80.4% of the whole. 316 users (29.3%) have only one visiting record and 146 (13.5%) users twice. Based on these statistics, one can conclude that only a small fraction of users may have an addiction to online porn. Most users occasionally visit porn sites, and most of the visits may be accidental. It is possible that they follow some eye-
Figure 4 shows the top 200 users‟ number of visits, where the xaxis represents the rank and the y-axis represents visiting number of users. A long tail is shown in the figure even if it plots only the top 200 users. The well-fitted red curve is the power law curve 1052·x-0.65, evidencing the “Pareto principle” of users‟ visits. Another interesting issue is the distribution of users on a certain number of visits. One may want to know how many users visit only once or how many users visit more than one hundred times. Figure 5 presents the numbers of users under 1 ~ 200 visiting times, which are also well-fitted by the power law curve 319.6 · x-1.21. Figure 6 shows cumulative number of all users under a certain number of visits. From the figure, one can see that 1000 users‟ number of visits are smaller than 100, while there are few users whose number of visits are between 200 and 900.
# of visits per user 1200
fit curve 1052 x
-0.65
1100 1000
# of visits per user
900 800 700
1000 900 800 700 600 500 400 300 0
100
200
300
400
500
600
700
800
900
No. of online porn visit
Figure 6. Cumulative number of users under a number of visiting times.
4. MEASUREMENT ON PORN SITES We focus on measurement on porn sites in this section. First, we examine number of visits to porn sites and number of porn sites in a certain visiting number in Section 4.1, showing that the number of visits to a porn site also follows a Pareto principle. In section 4.2, we present the geographic distribution of porn sites in China. We find that porn sites are mainly distributed in eastern coastal region and the densest regions are Beijing, Shanghai, and their surrounding areas. Furthermore, we study the proportion of porn sites, Internet penetration rate and per capital GDP in each province of mainland China. Results indicate the three indicators are positively correlated with each other.
600
4.1 Visits to Porn Sites Follows Pareto Principle
500 400 300 200 100 0 -100 -20
0
20
40
60
80
100
120
140
160
180
200
220
rank
Figure 4. Number of online porn visits of top 200 users.
# of users under a visiting number 350
# of users under a visiting number
1100
Accumulated No. of user IPs
catching links in their browsing web sites which turn out to be porn. Also, we find that the most active porn visitors are members or even VIP members of porn sites. When the porn sites were shut down or changed domain names, they can continue their access to these sites.
fit curve 319.6x
-1.21
300 250 200 150 100 50 0 -50 -20
0
20
40
60
80
100
120
140
160
180
200
220
# of visits
Figure 5. Number of users under 1 ~ 200 visiting times.
We examine the distribution of the number of visits to a porn site, and find another phenomenon of “Pareto principle”. 89.9% of the detected records belong to 20% sites. Ranking according to the number of visits, we plot the top 200 porn sites and the corresponding fitted curve in Figure 7. The function of the red curve is 4473·x-0.95, implying number of visits to porn sites obeys the power law. We present the top 10 porn sites in Fig 8. In fact, the top 10 sites cover 13977 visits, nearly a half of all detected ones. Moreover, by further scrutinizing these porn sites, we find some of them are actually the same sites with different domain names. Usually their domain names obey some naming patterns. For example, in the top 10 sites, “se.5qqcc.com”, “se.1wwzz.com”, “se.7gghh.com” and “se.6wwdd.com” can be summarized by a regular expression “se\.\d[a-z]{2}[a-z]{2}\.com”. This suggests that a strategy for matching URLs in the black list is able to capture variant domain names of an existing porn site. We also explore the distribution of porn sites under a certain number of visiting times. Is there a similar result to users‟ visiting behavior, or visits number of most sites are very small while few sites have large visits number? We show number of sites of 1 ~ 200 visits in Figure 9 and cumulative number of porn sites under a visiting number in Figure 10. They both justify the “Pareto principle” residing in visits to porn sites. One can observe that there are nearly 1200 sites whose numbers of visits
# of visits to a porn site 5000
fit curve 4473 x
-0.95
4500 4000
# of visits to a porn site
3500 3000
2000
1800
Cumulative number of porn sites
are not more than 3. Very few sites have a number of visits more than 200. This is in turn congruent with our conclusion in Section 3.2, i.e., only a small fraction of users may have an addiction to online porn while most users‟ visits are accidental. The active porn visitors are members or even VIP of porn sites and hence their visits are limited to only a certain set of porn sites. Consequently, this minority occupy a large proportion of visits whereas the majority has few visits.
1600
1400
1200
1000
800
600 0
2500
100
200
300
400
500
600
700
# of visits per site 2000 1500
Figure 10. Cumulative number of porn sites under a visiting number
1000 500 0 -500 -20
0
20
40
60
80
100
120
140
160
180
200
220
rank
Figure 7. Top 200 number of visits of porn sites.
4000
www.29cao.com
3500
a.14sel.com
se.5qqcc.com
2500
2000 www.zuoaifou.com
1500
1000 se.1wwzz.com se.6wwdd.com se.avfang.com se.7gghh.com v.pstang.info dandan.caobaidu.com
500
0
Figure 8. Number of visits of Top 10 porn sites.
# of sites under a visiting number 900
fit curve 773.5x
-1.51
800
# of sites under a visiting number
No. of visits
3000
700 600 500 400 300 200 100 0 -100 -20
0
20
40
60
80
100
120
140
160
180
200
220
# of visits per site
Figure 9. Number of porn sites under 0 ~ 200 visits
4.2 Geographic distribution of Porn Sites We studied the geographic distribution of porn sites in China. The CIIRC [5] reported that 93.2% of the investigated porn sites‟ servers locate aboard. In our collected sites, 12.8% of the porn sites‟ web servers locate in China and their geographic distribution is shown in Figure 11. The porn sites are mainly distributed in eastern coastal region, developed areas in China. The densest regions are Beijing, Shanghai, and their surrounding areas, which are the most developed areas in China. Furthermore, we describe the fraction of porn sites, Internet penetration rate and per capital GDP in each province of the mainland China in Fig 12. The approximate congruence of their trends indicates that the three indicators are positively correlated with each others. However, there are two noticeable glitches in the figure, occurring in Guangdong and Neimeng (Inner Mongolia) province. Guangdong‟s per capital GDP is far less than its neighboring points while Neimeng‟s is much higher than its neighbors in the triangle line. Guangdong actually is the most developed province in China (Shanghai and Beijing are provincial municipality), famous for Pearl River Delta of China and adjacent to Hong Kong and Macao. Its GDP is the top 1 in China but it has the 4th large size of population, which is far larger than that of Shanghai (25th) and Beijing (26th). Neimeng has the 16th GDP but 23th population size. It is the most import animal husbandry base of China, whose territory is covered almost by grassland and desert. In view of this, the glitch at Neimeng is also reasonable.
under a certain online porn visiting times obey the power law; 3) “Pareto principle” dominates both online porn visit times of a user and the number of visits to a porn site; and 4) geographic distribution of porn sites are positively correlated with the regional economic level. We hope our findings can illuminate the present and future of pornography web in China. As future work we will study the structure and evolution of porn web. We believe it has a distinctive degree distribution, a small separation, and clear community structures. Moreover modeling its evolution will be a challenge of interest.
Figure 11. Geographic Distribution of Porn sites in China.
0.8
90000
Per capital GDP
70000
Internet penetration
0.6
Porn sites fraction
Per capital GDP
60000 0.4
50000 40000
0.2
30000 20000
0.0
0
Beijing Shanghai Guangdong Tianjin Zhejiang Fujian Liaoning Jiangsu Shanxi Shandong Hainan Chongqing Qinghai Xinjiang Jilin Shaanxi Hebei Hubei Heilongjiang Neimeng Ningxia HUnan Guangxi Henan Gansu Sichuan Yunnan Tibet Jiangxi Anhui Guizhou
10000
Internet Penetration Fraction of porn sites
80000
Figure 12. Fraction of porn sites, Internet penetration and per capital GDP in each province of mainland China.
5. CONCLUSION AND FUTURE WORK This paper offers a peep at the online porn of China, and concludes the observations in different perspectives: 1) government‟s campaign leads significant influence to online porn; 2) both the ranked number of visits of a user and number of user
6. ACKNOWLEDGMENTS The research was supported by the National High-Tech R&D Program of China under Grant No.2008AA01Z131, the National Science Foundation of China under Grant Nos.60825202, 60803079, 60633020, the National Key Technologies R&D Program of China under Grant Nos. 2006BAK11B02, 2008BAH26B02, 2009BAH51B00, the Open Project Program of the Key Laboratory of Complex Systems and Intelligence Science, Institute of Automation, Chinese Academy of Sciences under Grant No. 20080101, Cheung Kong Scholar‟s Program.
7. REFERENCES [1] “The 25th statistic report on Internet development of China” from China Internet Network Information Center, http://www.cnnic.cn. [2] The Ministry of Public Security of P. R. China, http://www.mps.gov.cn; Internet Society of China, http://www.isc.org.cn/; http://www.cyberpolice.cn. [3] Stack S., Wasserman I., and Kern R. Adult Social Bonds and Use of Internet Pornography. Social Science Quarterly, 85(1): 75-88, 2004. [4] Reed, W. J. "The Pareto, Zipf and other power laws". Economics Letters 74 (1): 15–19, 2001. DOI = 10.1016/S0165-1765(01)00524-9. [5] China Internet Illegal Information Reporting Center, http://ciirc.china.cn/.